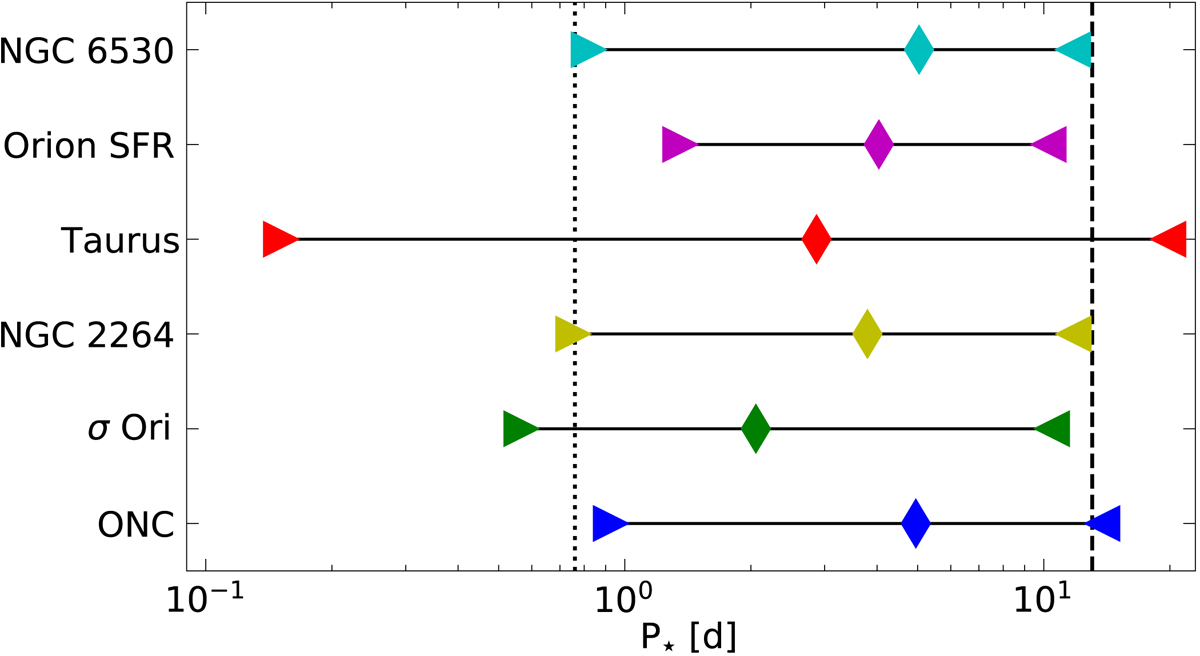
Fig. 6.
Download original image
Comparison between rotational distribution in young clusters and rotation period range at 1 Myr of our fast and slow-rotating models (blue area). The diamonds, left-pointing triangles, and right-pointing triangles are the 50th, 5th, and 95th percentile of the rotational distribution for the respective cluster. The mean values of the 95th (5th) percentiles are indicated by the vertical dashed (dotted) line. See text for references.
Current usage metrics show cumulative count of Article Views (full-text article views including HTML views, PDF and ePub downloads, according to the available data) and Abstracts Views on Vision4Press platform.
Data correspond to usage on the plateform after 2015. The current usage metrics is available 48-96 hours after online publication and is updated daily on week days.
Initial download of the metrics may take a while.