Fig. 5.
Download original image
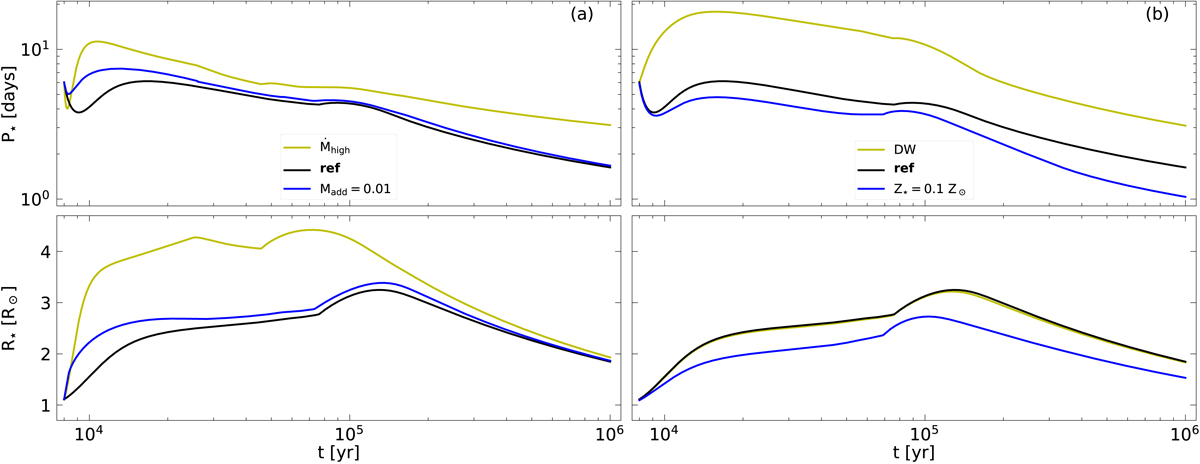
Evolution of the stellar rotation period P⋆ and the stellar radius R⋆ for different variations from the reference model. Column a: region in which Ėadd is distributed, Madd = 0.01 (blue line), and using a different accretion history Ṁhigh (see Fig. 1, yellow line). Column b: low metallicity, Z⋆ = 0.1 Z⊙ (blue line), and including the influence of disk winds (model DW, yellow line). The reference model is marked in boldface.
Current usage metrics show cumulative count of Article Views (full-text article views including HTML views, PDF and ePub downloads, according to the available data) and Abstracts Views on Vision4Press platform.
Data correspond to usage on the plateform after 2015. The current usage metrics is available 48-96 hours after online publication and is updated daily on week days.
Initial download of the metrics may take a while.