Fig. 1.
Download original image
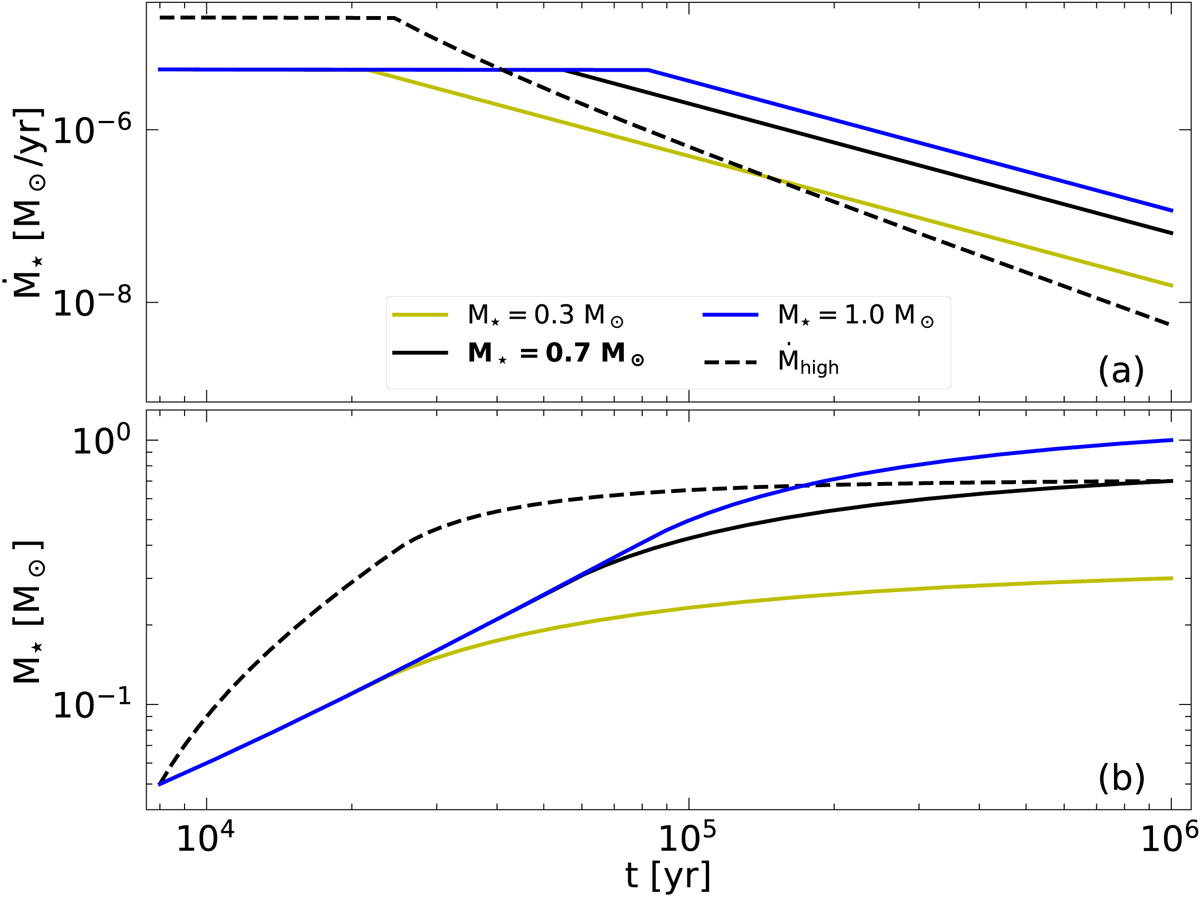
Parameterized illustration of the stellar accretion rate and stellar mass during the first million years of stellar evolution. Panel a shows the accretion rate and Panel b shows the stellar mass over time. The yellow, black, and blue lines represent a final stellar mass of 0.3, 0.7, and 1.0 M⊙, respectively. The black dashed line (Ṁhigh) represents a different accretion history, which also results in a final stellar mass of 0.7 M⊙ at 1 Myr.
Current usage metrics show cumulative count of Article Views (full-text article views including HTML views, PDF and ePub downloads, according to the available data) and Abstracts Views on Vision4Press platform.
Data correspond to usage on the plateform after 2015. The current usage metrics is available 48-96 hours after online publication and is updated daily on week days.
Initial download of the metrics may take a while.