| Issue |
A&A
Volume 670, February 2023
|
|
|---|---|---|
| Article Number | A70 | |
| Number of page(s) | 16 | |
| Section | Extragalactic astronomy | |
| DOI | https://doi.org/10.1051/0004-6361/202245166 | |
| Published online | 07 February 2023 | |
The opaque heart of the galaxy IC 860: Analogous protostellar, kinematics, morphology, and chemistry
1
Department of Space, Earth and Environment, Onsala Space Observatory, Chalmers University of Technology, 439 92 Onsala, Sweden
e-mail: This email address is being protected from spambots. You need JavaScript enabled to view it.
2
Leiden Observatory, Leiden University, PO Box 9513, 2300 RA Leiden, The Netherlands
3
Department of Physics and Astronomy, University College London, Gower Street, London WC1E 6BT, UK
Received:
7
October
2022
Accepted:
14
December
2022
Abstract
Compact Obscured Nuclei (CONs) account for a significant fraction of the population of luminous and ultraluminous infrared galaxies (LIRGs and ULIRGs). These galaxy nuclei are compact, with radii of 10–100 pc, with large optical depths at submm and far-infrared wavelengths, and characterized by vibrationally excited HCN emission. It is not known what powers the large luminosities of the CON host galaxies because of the extreme optical depths towards their nuclei. CONs represent an extreme phase of nuclear growth, hiding either a rapidly accreting supermassive black hole or an abnormal mode of star formation. Regardless of their power source, the CONs allow us to investigate the processes of nuclear growth in galaxies. Here we apply principal component analysis (PCA) tomography to high-resolution (0″.06) ALMA observations at frequencies 245 to 265 GHz of the nearby CON (59 Mpc) IC 860. PCA is a technique to unveil correlation in the data parameter space, and we apply it to explore the morphological and chemical properties of species in our dataset. The leading principal components reveal morphological features in molecular emission that suggest a rotating, infalling disk or envelope, and an outflow analogous to those seen in Galactic protostars. One particular molecule of astrochemical interest is methanimine (CH2NH), a precursor to glycine, three transitions of which have been detected towards IC 860. We estimate the average CH2NH column density towards the nucleus of IC 860 to be ∼1017cm−2, with an abundance exceeding 10−8 relative to molecular hydrogen, using the rotation diagram method and non-LTE radiative transfer models. This CH2NH abundance is consistent with those found in hot cores of molecular clouds in the Milky Way. Our analysis suggests that CONs are an important stage of chemical evolution in galaxies, that are chemically and morphologically similar to Milky Way hot cores.
Key words: galaxies: evolution / galaxies: ISM / galaxies: individual: IC860 / ISM: jets and outflows / ISM: molecules / methods: statistical
© The Authors 2023
 Open Access article, published by EDP Sciences, under the terms of the Creative Commons Attribution License (https://creativecommons.org/licenses/by/4.0), which permits unrestricted use, distribution, and reproduction in any medium, provided the original work is properly cited.
This article is published in open access under the Subscribe-to-Open model. This email address is being protected from spambots. You need JavaScript enabled to view it. to support open access publication.
1. Introduction
A significant portion of luminous and ultra-luminous (LIRGs and ULIRGs) infrared galaxies are shown to host nuclei that are compact (r < 100 pc), hot (T > 100 K), and opaque (N(H2) > 1024 cm−2). These compact obscured nuclei (CONs) account for approximately 40% of ULIRGs and 20% of LIRGs, yet it remains unknown what powers the extreme infrared luminosities of these galaxies (Falstad et al. 2021). The opaque nucleus may contain a supermassive black hole (SMBH) with a high rate of accretion, or an abnormal mode of star formation (Aalto et al. 2015b). How galaxies grow SMBHs, and their relationship with the host galaxy, is one of the most fundamental questions in galaxy evolution (e.g., Sanders & Mirabel 1996; Ferrarese & Merritt 2000; Fabian 2012). If CONs are powered by an active galactic nucleus (AGN), then they likely represent a phase of rapid accretion onto the SMBH embedded in obscuring material. The opaque nucleus is possibly due to a merger or interaction event (Ricci et al. 2017; Boettcher & Gallagher 2020). Regardless, CONs allow us to investigate the relationships between the nuclear growth processes in galaxies, SMBHs, and global galaxy properties.
Compact obscured nuclei are currently identified by vibrationally excited HCN lines (HCN-vib; ∑HCN − vib > 1 L⊙ pc−2 in the J = 3 − 2 transition) from the v2 = 1 state (e.g., Salter et al. 2008; Sakamoto et al. 2010; Aalto et al. 2015a; Martín et al. 2016; Falstad et al. 2021), and are opaque at frequencies above 80 GHz (Barcos-Muñoz et al. 2015; Sakamoto et al. 2017; Barcos-Muñoz et al. 2018; Aalto et al. 2019). X-rays and mid-infrared wavelengths are strongly attenuated in these approximately Av > 1000 galactic nuclei (e.g., Treister et al. 2010; Roche et al. 2015). However, there are some indications that CONs may be identified using mid-infrared polycyclic aromatic hydrocarbon features and continuum ratios (García-Bernete et al. 2022). Nevertheless, the HCN-vib lines are probably excited by a strong mid-infrared radiation field. This radiation field is likely due to a greenhouse effect where photons are trapped by dust. This effect raises the dust temperature to of order 100 K (González-Alfonso & Sakamoto 2019). Thus, the CONs, at least partially, self-heat by trapping emission, similar to Galactic hot cores (Kaufman et al. 1998).
The similarities to Galactic hot cores do not end with the detection of vibrationally excited species and the trapping of infrared photons. Compact obscured nuclei are chemically rich in molecular lines. Martín Ruiz (2018) shows that the spectrum between 218 and 363 GHz consists of transitions from at least 49 different species and ∼1300 transitions toward the known CON Arp 220. By comparison, hot cores may contain 10 000 transitions between 329 and 363 GHz (Jørgensen et al. 2016), and the ALMA Comprehensive High-resolution Extragalactic Molecular Inventory (ALCHEMI) has confirmed 1790 transitions between 84 and 373 GHz toward NGC 253 (Martín et al. 2021). Additionally, CONs seem to have strong, sometimes self-absorbed, lines of many molecules, such as HCN, HCO+, H2S, methanol (CH3OH), and CS (Aalto et al. 2015b, 2019). Of particular note is the detection of complex organic molecules (COMs), such as CH3OH and methanimine (CH2NH). They exist in a variety of astrophysical environments (see reviews Herbst & van Dishoeck 2009; Caselli & Ceccarelli 2012; Jørgensen et al. 2020), but the largest body of detections of COMs comes from observations of hot cores (e.g., Law et al. 2021). Toward these optically thick environments (Av ≫ 1 Ceccarelli et al. 1996), COMs predominantly trace the optically thick, hot (∼100–300 K), dense (> 107 cm−3) gas, in compact cores (∼0.01–0.05 pc). If COMs trace similar gas in galaxies, they may provide powerful diagnostics of the physics and chemistry of the innermost gas of CONs. Simply put, CONs and hot cores contain hot dense material, have high optical depths, and are line-rich sources with many transitions from COMs.
Methanimine (CH2NH) is a COM of particular interest in the interstellar medium, because its presence at high abundances (∼10−8 relative to H2) suggests that it is an important intermediate species in the growth of chemical complexity, especially among nitrogen-bearing species. Typically, COMs are defined as having six atoms, while CH2NH has five. However, CH2NH is the simplest “imine” and a direct precursor of glycine (Theule et al. 2011; Danger et al. 2011), thus earning special status as a COM. CH2NH was first detected in the interstellar medium toward Sagittarius B2 (Sgr B2). Sgr B2 is one of the most massive, molecular clouds in the Milky Way with three embedded hot spots of star formation. CH2NH is also the simplest molecule to contain the carbon-nitrogen double bond (Godfrey et al. 1973).
The first detection of CH2NH in another galaxy was with the Arecibo radio telescope toward Arp 220 (Salter et al. 2008). Since then, CH2NH has been detected toward a number of galaxies (e.g., Aalto et al. 2015b; Muller et al. 2011) and has been shown to exhibit maser activity at low frequencies toward CONs (Gorski et al. 2021). Gorski et al. (2021) detected methanimine toward 80% of CONs, with the only non-detection being toward IRAS 22491−1808, likely due to this galaxy’s greater distance. The excitation of CH2NH lines in CONs suggests this molecule is an especially valuable tracer of the CON environment.
We employ radiative transfer models, rotation diagram analysis, and principal component analysis (PCA) to study the excitation of CH2NH and the morphology of the CON IC 860. IC 860 is classified as a LIRG with log(LIR [L⊙]) = 11.17; a distance of 59 Mpc has been determined through the use of H0 = 75 km s−1 Mpc−1 and the adoption of a flat cosmology ΩM = 0.3 and Ωλ = 0.7 (Sanders et al. 2003). The only known closer CONs are ESO 320-G030 and NGC 4418 (Sanders et al. 2003; Falstad et al. 2021). It is not known if IC 860 hosts an AGN and/or a starburst, as the nucleus is largely obscured by dust (Alonso-Herrero et al. 2006). Aalto et al. (2019) investigated the nucleus of IC 860 with high angular resolution observations (< 0.1″) with the Atacama Large Millimeter Array and the Very Large Array. They uncovered evidence for a compact core fed by inflowing gas and a dense compact outflow. While the exact orientation and morphology of the nucleus remain unclear, Aalto et al. (2019) argue for a north-south oriented inflow and a molecular disk with an east-west oriented outflow (see Sect. 4.3.3 and Fig. 9 therein). The inclination of the nuclear disk is rather unconstrained to between a “near-face-on” (i ≈ 30°) and “near-edge-on” (i ≳ 60°) orientation. Utilizing PCA as a statistical tool to study the spectrum presented by Aalto et al. (2019), in addition to rotation diagram analysis and non-local thermodynamic equilibrium (non-LTE) radiative transfer modeling of the CH2NH lines, we offer a new penetrating look into chemically distinct structures and excitation of molecular gas in the CON IC 860. We provide evidence that CONs have enhanced production of CH2NH compared to Galactic hot cores, and that the disk and outflow are oriented in a near-edge-on orientation.
2. Observations
The properties of the ALMA observations (ALMA project number 2016.1.00800.S) are reported by Aalto et al. (2019), and the relevant details are summarized here. Observations took place on November 17th 2017 with 45 antennas, and the amount of precipitable water vapor was ∼1 mm. The maximal and minimal baselines were 13.9 km and 0.113 km. The minimum baseline length of 113 m corresponds to a maximum recoverable scale of 2 7. The bandpass calibrator, flux calibrator, gain calibrator, and check source are respectively J1256-0547, J1229+0203, J1327+2210, J1314+2348. The phase center was set to α = 13:15:03.5088 and δ= +24:37:07.788 (J2000) and the data were calibrated in the Common Astronomy Software Applications package (McMullin et al. 2007).
We utilize all four 1.875 GHz wide spectral windows centered at 246.4 GHz, 248.2 GHz 262.5 GHz, and 264.1 GHz. The original synthesized beam is  with Briggs weighting parameter robust = 0.5. The final image cubes have been smoothed to a common beam of
  with a position angle of 20° and contains 0
 010 pixels.
Channels are 8 MHz (∼20 km s−1) wide. All velocities are reported in the kinematic local standard of rest (LSRK) frame unless otherwise stated. The resulting sensitivities are 0.29 mJy, 0.32 mJy, 0.47 mJy, and 0.45 mJy for the respective 246.4 GHz, 248.2 GHz 262.5 GHz, and 264.1 GHz. Continuum subtraction was performed by means of the STATCONT software package (Sánchez-Monge et al. 2018). The peak fluxes for the 246.4 GHz, 248.2 GHz 262.5 GHz, and 264.1 GHz windows are 18.5 ± 0.4 mJy, 20.1 ± 0.8 mJy, 22.3 ± 0.5 mJy, and 19.9 ± 1.0 mJy. The continuum was statistically derived on a pixel-by-pixel basis using the sigma clipping method for each individual spectral window.
3. Results
Figure 1 shows the average spectrum of the four image cubes made from the 1.875 GHz wide bands, and the spectroscopic data for relevant transitions are collated in Table 1. Three transitions of CH2NH are detected in the nucleus of IC 860. These are the 7(1,6)–7(0,7), 6(0,6)–5(1,5) and 4(1,3)–3(1,2) transitions, with respective rest frequencies at 250.1617 GHz, 251.4212 GHz, and 266.2700 GHz. Figure 2 shows integrated intensity moment maps of the three identified transitions. All the CH2NH emission exists within a radius of 50 pc (0 18) of the nucleus, and absorption is observed toward the innermost
  . The emission structure is similar to the HCN-vib emission reported in Aalto et al. (2019), and is the strongest along the east-west axis perpendicular to the nuclear rotation.
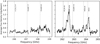 |
Fig. 1. Average spectrum of the four image cubes created from the 1.875 GHz wide bands centered at 246.4 GHz, 248.2 GHz 248.2 GHz, and 262.5 GHz. Spectral lines of particular interest are labeled with vertical dotted lines. |
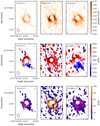 |
Fig. 2. Integrated intensity maps (top row), intensity-weighted velocity maps (middle row), and dispersion maps (bottom row) after removal of the continuum of the CH2NH 7(1,6)–7(0,7), 6(0,6)–5(1,5) and 4(1,3)–3(1,2) transitions. Pixels with a signal < ± 3 times the sensitivity were excluded from the calculation of the velocity field, and the centermost 0 |

Spectroscopic data for relevant transitions from Splatalogue (https://splatalogue.online/).
All three transitions show a north-south velocity gradient. Figure 2 shows the velocity-weighed moment map including all pixels above 3σ. No negative fluxes are included, and therefore velocities toward the nucleus may not be reliable. The center most 0 07 is masked for this reason. The dispersion maps (Fig. 2) generally agree with the HCN-vib maps shown by Aalto et al. (2019). Velocity dispersion ranges from ∼20 − 50 km s−1, with maxima along the east-west axis except for the 6(0,6)–5(1,5) transition which has a maximum dispersion of > 120 km s−1. The CH2NH 6(0,6)–5(1,5) line is contaminated toward the innermost 20 pc by cyclopropenylidene (c-C3H2) lines: an unresolved K-doublet of J = 7 − 6 at 251.3143 GHz and a doublet of J = 6 − 5 lines at 251.5087 and 251.5273 GHz, as seen in other CONs (Sakamoto et al. 2021). We extract the CH2NH spectra from the four pixels indicated in Fig. 3. Emission line parameters from Gaussian fits (Table 2) show that along the east-west axis, the line widths of the 6–5 transition appear larger than the 4–3 and 7–7 transitions. As a consequence, we do not use this line for abundance calculations toward these locations.
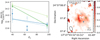 |
Fig. 3. Rotation diagram for the CH2NH lines detected toward IC 860 (left) and the corresponding locations marked on the flux ratio map of the CH2NH 4(1,3)–3(1,2) to HCN 3–2 transitions (right). The flux ratio map only includes pixels with a signal > 3 times the sensitivity of the CH2NH 4(1,3)–3(1,2) transition. |
3.1. Methanimine abundances
We estimate column densities toward four locations in the innermost 100 pc of IC 860. Four locations are chosen as points along the north-south and east-west axis (Fig. 3). In either morphological scenario suggested by Aalto et al. (2019), these four locations sample the outflow and disk.
The rotation diagram method, or the population diagram method, is described in Turner (1991) and Goldsmith & Langer (1999). In short, one can estimate the column density and rotation temperature from a linear fit to the observed intensities and upper state energies, assuming local thermodynamic equilibrium.
 (1)
(1)
Here the integrated intensity is W, the intrinsic line strength is S, the permanent electric dipole moment is μ, gI and gK are the nuclear spin and K-level degeneracies, respectively, the column density is N, Qex is the rotational partition function, the upper-level energy is Eu, and Tex is the excitation temperature. It is often easier to replace the inconvenient units of the Sμ2, being Debye (D) or electrostatic units (esu), with the Einstein Aul coefficient in units of s−1:
 (2)
(2)
Here gu = (2Ju + 1) is the rotation degeneracy of the upper level. Then the left half of Eq. (1) is much easier to work with in common units where W has units of K km s−1, k is the Boltzmann constant in J K−1, h is the Planck constant in J Hz−1, N is in km−2, and Eu/k and Tex are in K:
 (3)
(3)
Here gI and gK are equal to one, as CH2NH is an asymmetric top and there are no interchangeable identical nuclei. The column density and rotation temperature are then the intercept and slope of a linear fit to the diagram. We assume beam filling factors are unity and that the line emission is optically thin. The ranges of excitation temperatures (5–300 K) and column densities(1015–1019 cm−2) were explored with the Markov chain Monte Carlo sampler emcee (Foreman-Mackey et al. 2013). Figure 3 shows the rotation diagram for four locations in IC 860, and the results of the fit are collated in Table 3.
The average rotation temperature, measured by CH2NH emission, of IC 860 is  K with an average column density of CH2NH is
  cm−2. The emission line brightness temperatures are between a factor of two and an order of magnitude less than the derived excitation temperatures. Consequently, the assumption of optically thin emission likely holds for the sampled regions. Aalto et al. (2019) conclude that the continuum is a result of hot, 280 K dust. The continuum is likely more optically thin away from the opaque core toward the four regions identified in Fig. 3. We can estimate the optical depth from the observed intensity, assuming a beam filling factor of unity, from the relationship between optical depth and the temperature of a black body:
 (4)
(4)
where Iν is the observed intensity, and Bν(TD) is the Planck function. For a brightness temperature of 30 K, τ is 0.1. Following from Keene et al. (1982) and Hildebrand (1983), the total gas column density is related to the optical depth by
 (5)
(5)
assuming H2 dominates the gas and a standard dust-to-gas ratio of 1/100 (Bohlin et al. 1978), we find N(H2) ≈1.2 × 1025 cm−2. The average CH2NH abundance (X[CH2NH]) is thus 1.6 × 10⁻⁸.
However, this method overestimates the masses toward opaque nuclei. Wilson et al. (2014) and Aalto et al. (2019) both show that these column density estimates toward Arp 220 and IC 860 respectively, overestimate the dynamical mass by factors of at least two. Both groups effectively present a smaller dust-to-gas ratio as a means to rectify this discrepancy. For this reason, we present the derived CH2NH abundance as a lower limit.
3.2. Principal component analysis tomography
In this section, we apply the technique of PCA to reveal morphological and chemical correlations in the data cubes. PCA is the process of finding eigenvectors of the data that describe orthogonal axes of decreasing variance, and is a form of dimensionality reduction. Observations that contain many dimensions, for example two spatial, one frequency, and many molecules, benefit from dimensionality reduction. The technique of PCA is commonly used to identify correlations between n parameters in an arbitrarily large sample of objects (e.g., Murtagh & Heck 1987; Heyer & Schloerb 1997; Steiner et al. 2009). PCA is exceptionally useful for finding morphological correlations within spectral features in data cubes, and between images, in a variety of astronomical environments (e.g., Meier & Turner 2005; Schnorr Müller et al. 2011; Ricci et al. 2011; Gratier et al. 2017; Navarete et al. 2021).
The method of PCA tomography implemented here is described by Steiner et al. (2009). PCA, when applied directly to the calibrated data cubes, returns the data in a system of uncorrelated orthogonal coordinates called principal components (PCs). The first PC describes most of the variance within the data, with each subsequent PC describing less. The total number of PCs is equal to the total number of variables. Utilizing every PC it is possible to perfectly reconstruct the original data set. For example, a data cube with 128 channels will perfectly be described by 128 PCs. However, the first few PCs usually contain the bulk of useful information, while the other PCs describe the less relevant information, such as uncorrelated information like noise. Each PC has a corresponding tomogram with an eigenspectrum. The tomogram is a slice of the data in eigenvector space. In short, PCA transforms the data into a new coordinate system:
 (6)
(6)
where β is the instructions to map the coordinates x and y to a two-dimensional matrix, Iβν is the original data cube adjusted to have zero mean by subtracting the mean intensity for each frequency ν, and Eνk is the characteristic matrix. The columns of Eνk correspond to eigenvectors also called eigenspectra. Tβk can be unmapped to Txyk to generate tomograms.
We use the python toolkit Scikit-learn (Pedregosa et al. 2011) to perform PCA on the IC 860 data cubes from Aalto et al. (2019). The data cube is not normalized or scaled before PCA implementation. The reason for this is we are interested in the relative strengths of the spectral lines. Figure 4 shows a scree test (Cattell 1966) for the PCs presented here, and we find that PCs below six contain relevant information, with noise dominating all other PCs.
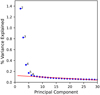 |
Fig. 4. Scree test showing which PCs contain useful information. The red line shows a linear fit to PCs greater than 5. The first PC is out of scale, with a respective value of 0.923. From this test, there is useful information up to PC 6. |
The first PC (PC 1), shown in Fig. 5, explains 92.29% of the variance. It shows correlations between the spectral features in the four data cubes and the continuum. Reversed P-Cygni profiles are seen in HCN and HCO+, and they are interpreted as evidence for self-absorption and inflowing molecular gas as in Aalto et al. (2015a). Additionally, HCN-vib. HC3N-vib, and CH2NH 4–3 and 7–7 lines appear to be correlated with the continuum, whereas the CH2NH 6–5 transition is confused with c-C3H2. This correlation with the HCN-vib and CH2NH lines is also observed in Zw049.057 (Aalto et al. 2015b). The first PC has the benefit of identifying redundant information and is most similar to the integrated spectrum (e.g., Ricci et al. 2011). This trend is seen across many galaxies (Schnorr Müller et al. 2011; Ricci et al. 2014), where moving to higher-order PCs less variance is described, but nonredundant information is easier to identify.
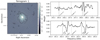 |
Fig. 5. First PC, which explains 92.29% of the variance. The tomogram is plotted to the left and the eigenspectrum to the right. White means stronger correlation, and black means anticorrelation. The 3σ contour of the CH2NH 413–312 transition is plotted in black. The vertical dotted lines represent the redshifted rest frequencies of the detected CH2NH transitions, the vertical dashed lines show the redshifted rest frequencies of the ground-state c-C3H2, HCN, and HCO+ lines, and the vertical dashed-dotted lines represent the redshifted rest frequencies of the HCN-vib and HC3N-vib lines. The two lines on either side of the CH2NH 6–5 transition are unlabeled and correspond to c-C3H2 transitions J = 7 − 6 and a doublet of J = 6 − 5 transitions. |
PC 2 explains 1.35% of the variance and is shown in Fig. 6. Absorption lines of HCN, HCO+, CH2NH, and c-C3H2 are strongly correlated with the millimeter continuum. In an “envelope” around the strongest millimeter continuum, these lines are correlated with emission.
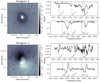 |
Fig. 6. Principal components two and three. White means stronger correlation, and black means anticorrelation. The 3σ contour of the CH2NH 413-312 transition is plotted in black. PC 2 shows evidence for an “envelope” around the millimeter continuum, and PC 3 shows anticorrelated redshifted and blueshifted emission indicative of rotation. The vertical lines mark the redshifted rest frequencies of the same lines identified in Fig. 5. |
The PC 3 explains 0.82% of the variance and is also shown in Fig. 6. It identifies anti-correlated redshifted and blueshifted emission in a symmetric structure about the center in the HCN, HCN-vib, HCO+, CH2NH, and c-C3H2 lines. The orientation of the major axis is north-south, with blueshifted emission in the south, and redshifted emission in the north. We interpret this structure as a rotating disk of material, and is similar to Heyer & Schloerb (1997) who performed PCA on a modeled data cube of a ridged rotating cloud. A major difference between Heyer & Schloerb (1997) and the PC 3 presented here, is the asymmetric appearance of the positively and negatively correlated lobes. In the PC 3 tomogram, the positive and negative lobes appear swirled, implying noncircular motions. The HCN-vib line is weakly associated with this structure compared to the other ground-state transitions. This is likely due to the HCN-vib transition tracing the innermost part of the nuclear region, identified in PC 4 discussed in the next paragraph. Similar structures are shown in NGC 7097 (Ricci et al. 2011), M81 (Schnorr Müller et al. 2011), and ten other AGN (Ricci et al. 2014). The vibrationally excited line HC3N-vib is not identified in this structure. Consequently, this species likely traces some other significant structure.
The fourth, fifth, and sixth PCs respectively explain 0.32%, 0.17%, and 0.13%, of the variance. The PC 5 identifies emission from HCN, HCO+, methanimine, cyclopropenylidene, HCN-vib, and HC3N-vib in a double-lobed structure oriented in an east-west orientation. We interpret this component as a biconical outflow. The position angle of the outflow is 100° measured from the angle between the strongest pixels in the two lobes from PC 5. The resemblance to the outflow cone seen in the PCA of NGC 7097 from Ricci et al. (2011) is remarkable. Ricci et al. (2011) argue that this structure is only seen in the PCA of very edge-on systems. The presence of the vibrationally excited lines in the eigenspectrum of PC 5 also indicates that the excitation of these highly excited transitions is related to the outflow.
The eigenspectra of PC 5 and 6, show anticorrelation between the low-velocity HCN and HCO+ lines and their blue and red wings, suggesting these components are tracing an outflow or outflows. PC 4 is significant in that it also shows anticorrelation between the redshifted and blueshifted features from HCN-vib, HC3N-vib, and c-C3H2 5–4 transitions, implying a second rotating disk within innermost 0 2, or a change in the excitation of the molecular gas compared of PC 3. The eigenspectrum of PC 4 also shows correlation with ground-state line wings of HCN and HCO+ linking this rotating feature to the outflow. The eigenspectrum of PC 6 shows correlation with the low velocity features of the ground state HCN line and weak anticorrelation with the line wings. The fact that PC 4 and PC 6 show roughly opposite spatial orientations and slightly Doppler shifted eigenspectral features could be an indication of a rotating outflow. PC 6 is the least significant PC with a noisy eigenspectrum, thus we claim this is a tentative indication of a rotating outflow.
4. Discussion
4.1. Non-LTE modeling
The conditions within Compton thick nuclei are extreme. Temperatures and molecular gas densities are respectively higher than ≳100 K and ≳105 cm−3, and the molecular gas is exposed to intense continuous radiation from centimeter through near-infrared wavelengths (e.g., Sakamoto et al. 2013, Aalto et al. 2015a,b, 2019, Mangum et al. 2019, Falstad et al. 2021, Gorski et al. 2021). The simplifying assumptions that make the rotation diagram method possible may not yield accurate results under these conditions. Gorski et al. (2021) showed that an internal radiation field is a crucial factor in reproducing the observed excitation of CH2NH in CONs. In particular, they explored the excitation of the CH2NH 1(1,0)–1(1,1) transition, revealing a population inversion and thus maser emission. However, in such an intense radiation field, the strongest transitions will be at millimeter and submillimeter wavelengths.
Using GROSBETA, described by Tabone et al. (2021) for its application to super-thermal OH emission, and by Gorski et al. (2021) to derive conditions for CH2NH masers, we model the observed CH2NH transitions toward IC 860. GROSBETA is a non-LTE radiative transfer code and the successor to RADEX (van der Tak et al. 2007). The grid logarithmically samples densities n(H2) 104 − 109 cm−3 in 31 steps, column densities N(CH2NH) 1015 − 1019 cm−3 in 17 steps, and linearly samples kinetic temperature from 10 − 330 K in 33 steps with a linewidth of 100 km s−1. We utilized crude collision rates scaled by dimensionless radiative line strengths to obtain order-of-magnitude estimates of the density in CH2NH-containing molecular gas (Gorski et al. 2021). A scaling factor was chosen so that the rate for the 101 → 000 transition agreed with that computed by Faure et al. (2018). We also incorporate the radiation field utilized and described by Gorski et al. (2021). The radiation field is constructed from adopted observed fluxes as collected from the NASA/IPAC Extragalactic Database (NED)1 assuming that fluxes below frequencies of ∼3 × 10¹² Hz are contained within the innermost 100 pc of IC 860. We do not know what fraction of the total observed infrared flux is contained within the nucleus at subarcsecond resolutions. Frequencies between ∼3 × 10¹² and ∼6 × 10¹³ Hz are therefore scaled by a factor φ, where φ is the fraction of observed infrared power contained within the source. We consider two model radiation fields consisting of two values of φ, 1.0 and 0.1. Further details about the radiation field are explained in the Sect. 4.2 and the appendix by Gorski et al. (2021).
The parameters of the best fits to the three observed CH2NH transitions are tabulated in Table 4 and the 3σ contours are shown in Fig. 7. Blue contours represent the north-south axis, with the north region filled with dots. The east-west contours are shown in green with respective forward and backward hatch marks.
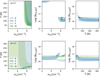 |
Fig. 7. Non-LTE models showing the best fit to the detected CH2NH transitions. Blue contours represent the north-south axis, with the north region filled with dots. The east-west contours are shown in green with forward and backward hatch marks. The top row shows the φ = 0.1 case and the bottom row shows the φ = 1.0 case. The shaded area represents 3σ from the best fit. In both cases, the temperature is generally unconstrained. In the φ = 1.0 case, the density is also unconstrained, but the φ = 0.1 case has a lower limit of 107.5 cm−3. Additionally, both cases show an enhancement of methanimine along the east-west axis. |
The non-LTE models do not well constrain the temperature of the CH2NH-containing molecular gas, with uncertainties exceeding the almost entire range of the sampled parameter space. Temperatures are unconstrained in the φ = 1.0 case, and for φ = 0.1 the kinetic temperature is > 30 ± 10 K. Densities are also not well constrained in the φ = 1.0 case, and for φ = 0.1 case densities are generally > 107 cm−3. In both φ cases, CH2NH column densities are also constrained by a lower limit of 1016.0 cm−2.
In general, the radiation field does not drastically change the estimate of the CH2NH column density. Both φ cases show a slight enhancement of CH2NH along the east-west axis. However, in the φ = 0.1 case, higher column densities up to 1019 are technically allowed within the 3σ contours. The results are in good agreement with the rotation diagram method with CH2NH column densities ∼1017 cm−2, as at current best the collision rates allow for order-of-magnitude precision (Gorski et al. 2021). The average χ2 in the model fitting is lower in the φ = 1.0 case, suggesting that the molecular gas toward these regions feels a significant fraction of the total observed infrared power of IC 860. The models also corroborate more abundant methanimine along the east-west axis of IC 860 for all densities, temperatures, and radiation fields, though the precision of these models allows for significant overlap.
Aalto et al. (2019) claim that IC 860’s nucleus consists of warm (∼280 K) dense (∼107 cm3) molecular gas. Our models are consistent within the uncertainties with this interpretation. The non-LTE models allow for CH2NH column densities two orders of magnitude greater than the rotation diagram method, illustrating that the radiation field may strongly influence the excitation of the molecular gas in IC 860. Furthermore, both methods show evidence that CH2NH is more abundant along the east-west axis, suggesting that CH2NH is enhanced in the outflow of IC 860.
4.2. Comparison to Milky Way environments
4.2.1. Abundances of methanimine in IC 860 and Milky Way environments
Here we compare the CH2NH abundances in IC 860 to three environments known in the Milky Way: The first is toward high-mass star-forming regions (HMSFRs), the second is the entire hot-core population of the Milky Way, and the third to Sgr B2. The average abundance of CH2NH in IC 860 relative to H2, except toward the opaque core, to be approximately 10−8. The abundance may be greater, as H2 column determinations are likely upper limits.
For Milky Way sources, Suzuki et al. (2016) report that the two most abundant CH2NH sources are HMSFRs Orion-KL and G10.47+0.03 with CH2NH abundances of 3.3 × 10⁻⁸ and 3.1 × 10⁻⁸ respectively. Neill et al. (2014) also report an abundance of 8.7 × 10⁻⁹ toward Sgr-B2 core. The abundance of CH2NH in IC 860 is similar to HMSFRs and Sgr B2. As CH2NH is not detected in low-mass star-forming regions (Suzuki et al. 2016), we assert that IC 860 is most similar to hot cores and HMSFRs. The column densities and abundance of CH2NH (this paper, Suzuki et al. 2016), the presence of HCN-vib emission (Aalto et al. 2015a; Boonman et al. 2001), and generally high molecular column densities (∼1025 cm−2; Aalto et al. 2019; Belloche et al. 2008), give credence to the idea that compact obscure nuclei may be scaled-up hot cores (i.e., on scales of tens of parsecs).
Suzuki et al. (2016) argued that CH2NH is formed mainly via radicals – NH + CH3 – that efficiently form in the gas phase once the mantles are evaporated. These two radicals may be the product of the destruction of more complex species. We further speculate that indeed NH and CH3 may be higher in strongly shocked gas (e.g. in the outflow region) because even a short period at very high temperatures would lead to a fast destruction of NH3 and CH4. As shown in the chemical shock models in Viti et al. (2011), for example, the reaction H + NH3 is very efficient for shocks of velocities of at least 40 kms−1, which can lead to a maximum temperature of ∼4000 K. This formation story aligns well with the morphology of IC 860. The inflow feeds the nucleus, where the molecular gas and dust is heated in the core of the CON. The warm and dense environment allows for gas phase reactions to happen, and the evidence is observed in the outflow. We underline however that without a detailed chemical model of the gas observed in IC 860, which is beyond the scope of this paper, we can not confirm this picture.
The high abundance of CH2NH in CONs could mean that as galaxies grow their nuclei, they also grow in chemical complexity. We can compare a rough estimate of the mass of CH2NH contained in Milky Way hot cores and Sgr B2 to IC 860. Lintott et al. (2005) estimate that the total number of hot cores, molecular cores, and hot corinos in the Milky Way is ∼104. For the remainder of this estimate, these will be referred to as only hot cores. Generally, hot cores have radii between 0.01–0.05 pc (Jørgensen et al. 2020; Law et al. 2021). If we assume that all hot cores have a large radius of 0.05 pc, spherical symmetry, and a column density of CH2NH of (2.1 ± 0.7)×1017 cm−2 from the most CH2NH abundant hot cores (Suzuki et al. 2016), then the total amount of CH2NH in all the Milky Way in hot cores is 3.8 ± 1.3 M⊙. Next, if we adopt the average CH2NH column density in IC 860 of (2.0 ± 0.6)×1017 cm−2 from the rotation diagram method (this paper), the larger upper uncertainty as a symmetric uncertainty, and a radius of ∼60 pc (Aalto et al. 2019), the mass of CH2NH in the nucleus of IC 860 is 410 ± 190 M⊙. This is 110 ± 60 times worth all the CH2NH contained in the hot cores worth of the Milky Way. Adopting the far UV (0.153 μm) + total infrared (8–1000 μm) star formation rate from Luo et al. (2022) of 11.16 ± 2.24 M⊙ yr−1, one would expect a mass of CH2NH of 43 ± 17 M⊙. The mass of CH2NH is a factor of 12 ± 6 times greater in the nucleus of IC 860 compared to this expectation. It is likely that this value is larger, as the calculation assumes large and CH2NH abundant hot cores.
We also compare the column of CH2NH in Sgr B2(N) to IC 860. If we take the column density of CH2NH toward Sgr B2(N), a hot spot of massive star formation, to be (7.0 ± 1.4)×1016 cm−2 (Neill et al. 2014), a radius of 2.3 pc (Schmiedeke et al. 2016), and circular symmetry, the mass of CH2NH in Sgr B2(N) is 0.27 ± 0.03 M⊙. the core of IC 860 contains approximately 1900 ± 500 Sgr B2(N)s worth of CH2NH. Considering, the complex organic nature of CH2NH, CONs are potentially a significant manufacturer of complex chemistry in the Universe.
From these rough estimates, one sees that IC 860 produces more CH2NH than predicted by star formation alone. Aalto et al. (2019) suggest that IC 860 may be powered by a deeply embedded AGN or a super-Eddington starburst (e.g., Andrews & Thompson 2011). IC 860’s SMBH is predicted to be under massive, where the total enclosed mass of gas, dust, stars, and the SMBH is of order of the SMBH mass predicted by the MSMBH − σ relationship (MSMBH ∼ 107 M⊙; Aalto et al. 2019; McConnell & Ma 2013; Davis et al. 2019). Less massive SMBHs also more commonly accrete at super-Eddington levels (Shirakata et al. 2019; Farrah et al. 2022). Furthermore, IC 860’s Paα luminosity is under luminous for normal star formation (Alonso-Herrero et al. 2006). Hence, we find that it is probable that the power source of IC 860 is an embedded AGN.
4.2.2. Structure and kinematics
Aalto et al. (2019) provide two potential scenarios for the nuclear structure of IC 860. One scenario with a virtually face-on disk and a blueshifted outflow oriented almost directly toward the observer, and a second scenario with the outflow oriented perpendicular to the observer in the east-west orientation with an almost edge-on disk. With regard to the nuclear outflow, we argue in favor of the second scenario.
From the PCA, we glean that the outflow is oriented in the east-west direction on the sky. The advantage of the PCA, over traditional methods of data cube analysis, is that it can identify correlations over many spectral lines. PC 5 clearly shows a two-lobed structure oriented with a position angle of 100° on the sky, and the eigenspectrum shows correlated red and blue line wings in the HCN and HCO+ transitions. The vibrationally excited species HCN-vib and HC3N-vib show a second rotating structure in PC 4, perhaps suggesting a correlation with the launching points of the outflow, a centrifugal barrier, or a nuclear disk surrounding the base of the outflow. From PC 3 alone, the envelope rotates in the north-south direction; however, there is significant width in the east-west direction, as indicated in the tomogram. This could be due to a thick disk, flared disk, or more moderate inclinations.
Aalto et al. (2019) also showed that the rotational major axis has a position angle of 0° and a peak rotational velocity of 100 km s−1 measured from the HCN-vib lines. Position-velocity (PV) cuts along the major axis confirm that the rotational velocity is ∼100 km s−1 from the HCN-vib line (Fig. 8). The HCN 3–2 emission is distributed over a much larger region of the sky, and the transition is seen in absorption toward the nuclear innermost ∼0 1.
1.
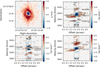 |
Fig. 8. Position-velocity slice through the data cubes along the major axis of rotation. The top-left image shows the integrated flux map of the HCN 3–2 transition. The dashed red region shows the 0 |


The PV diagrams show (Fig. 8) that the brightest velocity components are redshifted and blueshifted, respectively, along the north-south axis, and the rotation signature disappears in the center. The north axis also shows blueshifted emission, but there is a dearth of redshifted emission along the southern axis. If the slice is shifted to the east, relative to rotation, there is clear redshifted emission (Fig. 9). Sakai et al. (2014), Oya et al. (2014, 2016) argue these features are due to a rotating infalling envelope with a centrifugal barrier and an outflow, though on much smaller scales around protostars. Additionally, off the major axis PV plots that show such rotated elliptical structures are potential indicators of rotating outflows (Tabone & Cabrit 2020). By a similar visual inspection, the angular offset between the redshifted and blueshifted velocity components, of the HCN (3–2) line, is 0 13 or 18 pc.
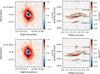 |
Fig. 9. Position-velocity slices through the data cubes along the major axis of rotation. The left column shows the integrated flux map of the HCN 3–2 transition, with the location of the 0 |


4.2.3. Feature enhancement and overall structure of IC 860
Since PCA describes the data in eigenvectors, it is possible to re-weight and isolate these vectors such that they contribute more equally to the reconstructed image. It is important to remember that the eigenvectors are orthogonal and represent uncorrelated phenomena, and that noise can be reduced by eliminating eigenvectors that contain an excessive amount of noise. Steiner et al. (2009), Ricci et al. (2014) show that by normalizing each PC by its variance, removing noise dominated PCs, and reconstructing the data cube, one obtains an image cube where each orthogonal component contributes more equally to the final data product. This “enhanced” image can reveal structures not easily discernible in the original data cube. Since the CONs are optically thick in the center and contain many spectral lines, this method is attractive in the sense that it predicts structures that may not be directly observable. To clarify, we interpret the PCA-enhanced images as a reasonable extrapolation from the data, not an obvious detection of astrophysical phenomena.
Here we reconstruct the data cubes of IC 860 using PCs one through six. These components describe 94.9% of the original data. Figure 10 shows the 262.888 GHz channel of each data cube centered on the CH2NH 4–3 line. From left to right, the panels of Fig. 10 show channels from the original data cube, the PCA-Enhanced data cube, and the continuum-subtracted data cube. Upon inspection, one sees that the original data cube is dominated by the millimeter continuum. The continuum-subtracted data cube shows a biconical structure oriented in the east-west direction and absorption toward the continuum. The PCA enhanced data cube reveals the same biconical structure, and absorption toward the nucleus, but these features are now equally weighted.
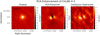 |
Fig. 10. Comparison between the original data cube, the PCA-enhanced cube, and the continuum-subtracted data cube. Each panel shows the 262.888 GHz channel corresponding to −10 km s−1 (blueshifted) of the CH2NH (4–3) transition, adopting a redshift of 0.0129 for IC 860. The left panel displays the original data cube, the center the PCA-enhanced cube, and the right the continuum-subtracted cube. The center image is given in weight and the two other panels in mJy beam−1. |
Figures A.2 and A.3 show selected blue and red channels of the HCN and HCO+ transitions. The eigenspectra of PC 3 are largely dominated by these two lines, and thus the structure of the rotating disk is revealed more clearly. Each of these lines shows strong correlation with a narrow, less than one synthesized beam width (0 06) wide, almost edge-on disk-like structure, and anticorrelation with the outflow. We interpret this as evidence for a nearly edge-on nuclear disk. If these predictions hold true, and the inclination of the nuclear disk is ∼90°, then the dynamical mass estimated by Aalto et al. (2019) is reduced to Mdyn = 2 × 10⁷ M⊙. We estimate the centrifugal barrier (Eqs. (3) and (4) Sakai et al. 2014) for a 2 × 10⁷ M⊙ object with a rotation velocity of 100 ± 20 km s−1 is 17 ± 7 pc. We adopt an ample 20 km s−1 uncertainty to the velocity, corresponding to the 8 MHz channel width. This estimate is consistent with the 37 pc diameter offset seen in the PV diagrams, with an inclination > 61°.
Examining all the PCs, the PCA-enhanced channel maps, and PV slices presented in this paper, we construct a schematic cartoon of the IC 860 system (Fig. 11). IC 860 consists of a flared, rotating, infalling molecular disk, and an encompassing envelope. The outflow is oriented east-west on the sky and shows evidence of rotation. There is evidence of a highly inclined molecular disk. In this picture, IC 860 has extraordinary similarities to the flared disk model of a rotating infalling envelope with a centrifugal barrier and an outflow around protostars (e.g., Sakai et al. 2014).
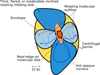 |
Fig. 11. Schematic cartoon of the IC 860 ecosystem. |
5. Conclusions
We have provided an analysis of ALMA 245-265 GHz 0 06 resolution observations of molecular gas associated with the CON IC 860. From PCA tomography, rotation diagram abundance determinations, and non-LTE radiative transfer models, we assert the following:
-
Line ratio maps reveal that CH2NH is more abundant along the east-west axis of IC 860, and non-LTE models concur that the column density is enhanced along the outflow.
-
We calculated and modeled CH2NH column densities in IC 860 utilizing the rotation diagram method and non-LTE modeling. Both methods yield CH2NH column densities ranging from 1017.2–1017.4 cm−2. The fractional abundances relative to H2 of CH2NH are 10−8 in good agreement with Milky Way HMSFRs. However, if we consider that the molecular (H2) column density is probably overestimated, it is likely that methanimine is more abundant. Thus, IC 860 would have the highest fractional abundance of CH2NH currently known.
-
The estimated total mass of CH2NH in IC 860 exceeds what would be predicted by star formation by a factor of 12 ± 6, hinting that CONs could be a significant producer of complex organic chemistry in the Universe.
-
Position-velocity slices through the data, and PCA, show that rotation slows at a radius of 18 pc, and there is a dearth of redshifted emission on the southern half of the major axis. We interpret these features as the signature of a flared, rotating, infalling molecular disk analogous to those of Galactic protostars.
-
We applied PCA tomography to our data cubes and explored the morphology of IC 860. Ground-state transitions of CH2NH, c-C3H2, HCN, and HCO+ trace a large rotating molecular envelope. Vibrationally excited species are revealed to be correlated with a second rotating structure in the innermost 0
 2. The outflow is revealed to be in the east-west orientation with an inclined molecular disk. Line wings of the ground-state lines of HCN and HCO+ appear to be correlated with outflow, where CH2NH, appears to trace slower velocities.
The nuclear power source of CONs is unknown due to their opaque nuclei. However, we have provided evidence that the abundance and mass of methanimine towards known CON IC 860 exceeds that predicted by star formation. Furthermore, there appears to be evidence for morphologically analogous structures similar to protostars. Therefore, the growth process of CONs, and potentially SMBHs, could be analogous to that of Galactic hot cores or protostars, but acting at larger physical scales.
https://ned.ipac.caltech.edu/, NED is funded by the US National Aeronautics and Space Administration and operated by the California Institute of Technology.
Acknowledgments
M.G. would like to thank Professor Tiago Vecci Ricci for his helpful discussions on interpreting tomograms and eigenspectrums of data cubes. S.A., K.O., S.K., C.Y. gratefully acknowledge support from an ERC Advanced Grant 789410 a. S.V. acknowledges support from the European Research Council (ERC) under the European Union’s Horizon 2020 research and innovation program MOPPEX 833460. M.G. acknowledges support from the Nordic ALMA Regional Center (ARC) node based at Onsala Space Observatory. The Nordic ARC node is funded through Swedish Research Council grant No 2017-00648.
References
- Aalto, S., Garcia-Burillo, S., Muller, S., et al. 2015a, A&A, 574, A85 [NASA ADS] [CrossRef] [EDP Sciences] [Google Scholar]
- Aalto, S., Martín, S., Costagliola, F., et al. 2015b, A&A, 584, A42 [NASA ADS] [CrossRef] [EDP Sciences] [Google Scholar]
- Aalto, S., Muller, S., König, S., et al. 2019, A&A, 627, A147 [NASA ADS] [CrossRef] [EDP Sciences] [Google Scholar]
- Alonso-Herrero, A., Rieke, G. H., Rieke, M. J., et al. 2006, ApJ, 650, 835 [Google Scholar]
- Andrews, B. H., & Thompson, T. A. 2011, ApJ, 727, 97 [NASA ADS] [CrossRef] [Google Scholar]
- Barcos-Muñoz, L., Leroy, A. K., Evans, A. S., et al. 2015, ApJ, 799, 10 [Google Scholar]
- Barcos-Muñoz, L., Aalto, S., Thompson, T. A., et al. 2018, ApJ, 853, L28 [Google Scholar]
- Belloche, A., Menten, K. M., Comito, C., et al. 2008, A&A, 492, 769 [CrossRef] [EDP Sciences] [Google Scholar]
- Boettcher, E., Gallagher, John S. I., Ohyama, Y., et al. 2020, A&A, 637, A17 [NASA ADS] [CrossRef] [EDP Sciences] [Google Scholar]
- Bohlin, R. C., Savage, B. D., & Drake, J. F. 1978, ApJ, 224, 132 [Google Scholar]
- Boonman, A. M. S., Stark, R., van der Tak, F. F. S., et al. 2001, ApJ, 553, L63 [NASA ADS] [CrossRef] [Google Scholar]
- Caselli, P., & Ceccarelli, C. 2012, A&ARv, 20, 56 [Google Scholar]
- Cattell, R. B. 1966, Multivariate Behav. Res., 1, 1 [Google Scholar]
- Ceccarelli, C., Hollenbach, D. J., & Tielens, A. G. G. M. 1996, ApJ, 471, 400 [Google Scholar]
- Danger, G., Borget, F., Chomat, M., et al. 2011, A&A, 535, A47 [NASA ADS] [CrossRef] [EDP Sciences] [Google Scholar]
- Davis, B. L., Graham, A. W., & Combes, F. 2019, ApJ, 877, 64 [NASA ADS] [CrossRef] [Google Scholar]
- Fabian, A. C. 2012, ARA&A, 50, 455 [Google Scholar]
- Falstad, N., Aalto, S., König, S., et al. 2021, A&A, 649, A105 [NASA ADS] [CrossRef] [EDP Sciences] [Google Scholar]
- Farrah, D., Efstathiou, A., Afonso, J., et al. 2022, MNRAS, 513, 4770 [NASA ADS] [CrossRef] [Google Scholar]
- Faure, A., Lique, F., & Remijan, A. J. 2018, J. Phys. Chem. Lett., 9, 3199 [NASA ADS] [CrossRef] [Google Scholar]
- Ferrarese, L., & Merritt, D. 2000, ApJ, 539, L9 [Google Scholar]
- Foreman-Mackey, D., Hogg, D. W., Lang, D., & Goodman, J. 2013, PASP, 125, 306 [Google Scholar]
- García-Bernete, I., Rigopoulou, D., Aalto, S., et al. 2022, A&A, 663, A46 [NASA ADS] [CrossRef] [EDP Sciences] [Google Scholar]
- Godfrey, P. D., Brown, R. D., Robinson, B. J., & Sinclair, M. W. 1973, Astrophys. Lett., 13, 119 [NASA ADS] [Google Scholar]
- Goldsmith, P. F., & Langer, W. D. 1999, ApJ, 517, 209 [Google Scholar]
- González-Alfonso, E., & Sakamoto, K. 2019, ApJ, 882, 153 [Google Scholar]
- Gorski, M. D., Aalto, S., Mangum, J., et al. 2021, A&A, 654, A110 [NASA ADS] [CrossRef] [EDP Sciences] [Google Scholar]
- Gratier, P., Bron, E., Gerin, M., et al. 2017, A&A, 599, A100 [CrossRef] [EDP Sciences] [Google Scholar]
- Herbst, E., & van Dishoeck, E. F. 2009, ARA&A, 47, 427 [NASA ADS] [CrossRef] [Google Scholar]
- Heyer, M. H., & Schloerb, F. P. 1997, ApJ, 475, 173 [NASA ADS] [CrossRef] [Google Scholar]
- Hildebrand, R. H. 1983, QJRAS, 24, 267 [NASA ADS] [Google Scholar]
- Jørgensen, J. K., van der Wiel, M. H. D., Coutens, A., et al. 2016, A&A, 595, A117 [Google Scholar]
- Jørgensen, J., Belloche, A., & Garrod, R. T. 2020, ARA&A, 58, 727 [CrossRef] [Google Scholar]
- Kaufman, M. J., Hollenbach, D. J., & Tielens, A. G. G. M. 1998, ApJ, 497, 276 [NASA ADS] [CrossRef] [Google Scholar]
- Keene, J., Hildebrand, R. H., & Whitcomb, S. E. 1982, ApJ, 252, L11 [NASA ADS] [CrossRef] [Google Scholar]
- Law, C. J., Zhang, Q., Öberg, K. I., et al. 2021, ApJ, 909, 214 [Google Scholar]
- Lintott, C. J., Viti, S., Williams, D. A., Rawlings, J. M. C., & Ferreras, I. 2005, MNRAS, 360, 1527 [NASA ADS] [CrossRef] [Google Scholar]
- Luo, Y., Rowlands, K., Alatalo, K., et al. 2022, ApJ, 938, 63 [NASA ADS] [CrossRef] [Google Scholar]
- Mangum, J. G., Ginsburg, A. G., Henkel, C., et al. 2019, ApJ, 871, 170 [NASA ADS] [CrossRef] [Google Scholar]
- Martín Ruiz, S. 2018, IAU Symp., 332, 37 [Google Scholar]
- Martín, S., Aalto, S., Sakamoto, K., et al. 2016, A&A, 590, A25 [NASA ADS] [CrossRef] [EDP Sciences] [Google Scholar]
- Martín, S., Mangum, J. G., Harada, N., et al. 2021, A&A, 656, A46 [NASA ADS] [CrossRef] [EDP Sciences] [Google Scholar]
- McConnell, N. J., & Ma, C.-P. 2013, ApJ, 764, 184 [Google Scholar]
- McMullin, J. P., Waters, B., Schiebel, D., Young, W., & Golap, K. 2007, ASP Conf. Ser., 376, 127 [Google Scholar]
- Meier, D. S., & Turner, J. L. 2005, ApJ, 618, 259 [NASA ADS] [CrossRef] [Google Scholar]
- Muller, S., Beelen, A., Guélin, M., et al. 2011, A&A, 535, A103 [NASA ADS] [CrossRef] [EDP Sciences] [Google Scholar]
- Murtagh, F., & Heck, A. 1987, in Multivariate Data Analysis (Berlin Heidelberg: Springer-Verlag), 131 [CrossRef] [Google Scholar]
- Navarete, F., Damineli, A., Steiner, J. E., & Blum, R. D. 2021, MNRAS, 503, 270 [CrossRef] [Google Scholar]
- Neill, J. L., Bergin, E. A., Lis, D. C., et al. 2014, ApJ, 789, 8 [Google Scholar]
- Oya, Y., Sakai, N., Sakai, T., et al. 2014, ApJ, 795, 152 [NASA ADS] [CrossRef] [Google Scholar]
- Oya, Y., Sakai, N., López-Sepulcre, A., et al. 2016, ApJ, 824, 88 [Google Scholar]
- Pedregosa, F., Varoquaux, G., Gramfort, A., et al. 2011, J. Mach. Learn. Res., 12, 12 [Google Scholar]
- Ricci, T. V., Steiner, J. E., & Menezes, R. B. 2011, ApJ, 734, L10 [NASA ADS] [CrossRef] [Google Scholar]
- Ricci, T. V., Steiner, J. E., & Menezes, R. B. 2014, MNRAS, 440, 2419 [NASA ADS] [CrossRef] [Google Scholar]
- Ricci, C., Bauer, F. E., Treister, E., et al. 2017, MNRAS, 468, 1273 [NASA ADS] [Google Scholar]
- Roche, P. F., Alonso-Herrero, A., & Gonzalez-Martin, O. 2015, MNRAS, 449, 2598 [NASA ADS] [CrossRef] [Google Scholar]
- Sakai, N., Sakai, T., Hirota, T., et al. 2014, Nature, 507, 78 [Google Scholar]
- Sakamoto, K., Aalto, S., Evans, A. S., Wiedner, M. C., & Wilner, D. J. 2010, ApJ, 725, L228 [Google Scholar]
- Sakamoto, K., Aalto, S., Costagliola, F., et al. 2013, ApJ, 764, 42 [Google Scholar]
- Sakamoto, K., Aalto, S., Barcos-Muñoz, L., et al. 2017, ApJ, 849, 14 [Google Scholar]
- Sakamoto, K., Martín, S., Wilner, D. J., et al. 2021, ApJ, 923, 240 [NASA ADS] [CrossRef] [Google Scholar]
- Salter, C. J., Ghosh, T., Catinella, B., et al. 2008, AJ, 136, 389 [Google Scholar]
- Sánchez-Monge, Á., Schilke, P., Ginsburg, A., Cesaroni, R., & Schmiedeke, A. 2018, A&A, 609, A101 [Google Scholar]
- Sanders, D. B., & Mirabel, I. F. 1996, ARA&A, 34, 749 [Google Scholar]
- Sanders, D. B., Mazzarella, J. M., Kim, D. C., Surace, J. A., & Soifer, B. T. 2003, AJ, 126, 1607 [Google Scholar]
- Schmiedeke, A., Schilke, P., Möller, T., et al. 2016, A&A, 588, A143 [NASA ADS] [CrossRef] [EDP Sciences] [Google Scholar]
- Schnorr Müller, A., Storchi-Bergmann, T., Riffel, R. A., et al. 2011, MNRAS, 413, 149 [CrossRef] [Google Scholar]
- Shirakata, H., Kawaguchi, T., Oogi, T., Okamoto, T., & Nagashima, M. 2019, MNRAS, 487, 409 [NASA ADS] [CrossRef] [Google Scholar]
- Steiner, J. E., Menezes, R. B., Ricci, T. V., & Oliveira, A. S. 2009, MNRAS, 395, 64 [NASA ADS] [CrossRef] [Google Scholar]
- Suzuki, T., Ohishi, M., Hirota, T., et al. 2016, ApJ, 825, 79 [NASA ADS] [CrossRef] [Google Scholar]
- Tabone, B., Cabrit, S., Pineau des Forêts, G., et al. 2020, A&A, 640, A82 [CrossRef] [EDP Sciences] [Google Scholar]
- Tabone, B., van Hemert, M. C., van Dishoeck, E. F., & Black, J. H. 2021, A&A, 650, A192 [NASA ADS] [CrossRef] [EDP Sciences] [Google Scholar]
- Theule, P., Borget, F., Mispelaer, F., et al. 2011, A&A, 534, A64 [NASA ADS] [CrossRef] [EDP Sciences] [Google Scholar]
- Treister, E., Urry, C. M., Schawinski, K., Cardamone, C. N., & Sanders, D. B. 2010, ApJ, 722, L238 [NASA ADS] [CrossRef] [Google Scholar]
- Turner, B. E. 1991, ApJS, 76, 617 [NASA ADS] [CrossRef] [Google Scholar]
- van der Tak, F. F. S., Black, J. H., Schöier, F. L., Jansen, D. J., & van Dishoeck, E. F. 2007, A&A, 468, 627 [NASA ADS] [CrossRef] [EDP Sciences] [Google Scholar]
- Viti, S., Jimenez-Serra, I., Yates, J. A., et al. 2011, ApJ, 740, L3 [NASA ADS] [CrossRef] [Google Scholar]
- Wilson, C. D., Rangwala, N., Glenn, J., et al. 2014, ApJ, 789, L36 [Google Scholar]
Appendix A: Principal components and eigenvectors, and PCA-enhanced data cubes
Figure A.1 shows the tomograms and eigenvectors of IC 860. Figures A.2 and A.3 show the comparison between the original data cubes, and the PCA-enhanced data cube. The left column shows channels from the original calibrated data cube. The center column shows a channel of the PCA-enhanced data cube. The right column shows channels of the continuum-subtracted data cube. The same channel, from the three data cubes, is shown across each row and identified in the top right.
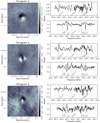 |
Fig. A.1. Principal components four to six. White means stronger correlation and black means anticorrelation. The 3σ contour of the CH2NH 413-312 transition is plotted in black. PC 4 shows anticorrelation between redshifted and blueshifted emission from vibrational transitions, indicating a more slowly rotating structure and a change in excitation of the molecular gas. PC 5 shows a double-lobed structure associated with line wings. PC 6 shows a correlation with the low velocity components of the ground state HCN line and a weak anti-correlation with the line wings. The vertical lines mark the redshifted rest frequencies of the same lines identified in Fig. 5. |
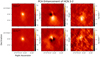 |
Fig. A.2. Comparison between the original data cube, the PCA-enhanced cube, and the continuum-subtracted data cube. The left column displays the original data cube, the center column the PCA-enhanced cube, and the right column the continuum-subtracted cube. The top row of panels shows the 262.657 GHz channel corresponding to -179 km s−1 of the HCN (4-3) transition, adopting a redshift of 0.0129 for IC 860. The bottom row of panels shows the 262.285 GHz 246 km s−1 channel. The center image is given in weight and the other two panels in mJy beam−1. |
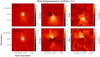 |
Fig. A.3. Comparison between the original data cube, the PCA-enhanced cube, and the continuum-subtracted data cube. The left column displays the original data cube, the center column the PCA-enhanced cube, and the right column the continuum-subtracted cube. The top row of panels shows the 264.318 GHz channel corresponding to -191 km s−1 of the HCN (4-3) transition, adopting a redshift of 0.0129 for IC 860. The bottom row of panels shows the 263.979 GHz 194 km s−1 channel. The center image is given in weight and the other two panels in mJy beam−1. |
All Tables
Spectroscopic data for relevant transitions from Splatalogue (https://splatalogue.online/).
All Figures
|
Fig. 1. Average spectrum of the four image cubes created from the 1.875 GHz wide bands centered at 246.4 GHz, 248.2 GHz 248.2 GHz, and 262.5 GHz. Spectral lines of particular interest are labeled with vertical dotted lines. |
| In the text | |
|
Fig. 2. Integrated intensity maps (top row), intensity-weighted velocity maps (middle row), and dispersion maps (bottom row) after removal of the continuum of the CH2NH 7(1,6)–7(0,7), 6(0,6)–5(1,5) and 4(1,3)–3(1,2) transitions. Pixels with a signal < ± 3 times the sensitivity were excluded from the calculation of the velocity field, and the centermost 0 |
| In the text | |
|
Fig. 3. Rotation diagram for the CH2NH lines detected toward IC 860 (left) and the corresponding locations marked on the flux ratio map of the CH2NH 4(1,3)–3(1,2) to HCN 3–2 transitions (right). The flux ratio map only includes pixels with a signal > 3 times the sensitivity of the CH2NH 4(1,3)–3(1,2) transition. |
| In the text | |
|
Fig. 4. Scree test showing which PCs contain useful information. The red line shows a linear fit to PCs greater than 5. The first PC is out of scale, with a respective value of 0.923. From this test, there is useful information up to PC 6. |
| In the text | |
|
Fig. 5. First PC, which explains 92.29% of the variance. The tomogram is plotted to the left and the eigenspectrum to the right. White means stronger correlation, and black means anticorrelation. The 3σ contour of the CH2NH 413–312 transition is plotted in black. The vertical dotted lines represent the redshifted rest frequencies of the detected CH2NH transitions, the vertical dashed lines show the redshifted rest frequencies of the ground-state c-C3H2, HCN, and HCO+ lines, and the vertical dashed-dotted lines represent the redshifted rest frequencies of the HCN-vib and HC3N-vib lines. The two lines on either side of the CH2NH 6–5 transition are unlabeled and correspond to c-C3H2 transitions J = 7 − 6 and a doublet of J = 6 − 5 transitions. |
| In the text | |
|
Fig. 6. Principal components two and three. White means stronger correlation, and black means anticorrelation. The 3σ contour of the CH2NH 413-312 transition is plotted in black. PC 2 shows evidence for an “envelope” around the millimeter continuum, and PC 3 shows anticorrelated redshifted and blueshifted emission indicative of rotation. The vertical lines mark the redshifted rest frequencies of the same lines identified in Fig. 5. |
| In the text | |
|
Fig. 7. Non-LTE models showing the best fit to the detected CH2NH transitions. Blue contours represent the north-south axis, with the north region filled with dots. The east-west contours are shown in green with forward and backward hatch marks. The top row shows the φ = 0.1 case and the bottom row shows the φ = 1.0 case. The shaded area represents 3σ from the best fit. In both cases, the temperature is generally unconstrained. In the φ = 1.0 case, the density is also unconstrained, but the φ = 0.1 case has a lower limit of 107.5 cm−3. Additionally, both cases show an enhancement of methanimine along the east-west axis. |
| In the text | |
|
Fig. 8. Position-velocity slice through the data cubes along the major axis of rotation. The top-left image shows the integrated flux map of the HCN 3–2 transition. The dashed red region shows the 0 |
| In the text | |
|
Fig. 9. Position-velocity slices through the data cubes along the major axis of rotation. The left column shows the integrated flux map of the HCN 3–2 transition, with the location of the 0 |
| In the text | |
|
Fig. 10. Comparison between the original data cube, the PCA-enhanced cube, and the continuum-subtracted data cube. Each panel shows the 262.888 GHz channel corresponding to −10 km s−1 (blueshifted) of the CH2NH (4–3) transition, adopting a redshift of 0.0129 for IC 860. The left panel displays the original data cube, the center the PCA-enhanced cube, and the right the continuum-subtracted cube. The center image is given in weight and the two other panels in mJy beam−1. |
| In the text | |
|
Fig. 11. Schematic cartoon of the IC 860 ecosystem. |
| In the text | |
|
Fig. A.1. Principal components four to six. White means stronger correlation and black means anticorrelation. The 3σ contour of the CH2NH 413-312 transition is plotted in black. PC 4 shows anticorrelation between redshifted and blueshifted emission from vibrational transitions, indicating a more slowly rotating structure and a change in excitation of the molecular gas. PC 5 shows a double-lobed structure associated with line wings. PC 6 shows a correlation with the low velocity components of the ground state HCN line and a weak anti-correlation with the line wings. The vertical lines mark the redshifted rest frequencies of the same lines identified in Fig. 5. |
| In the text | |
|
Fig. A.2. Comparison between the original data cube, the PCA-enhanced cube, and the continuum-subtracted data cube. The left column displays the original data cube, the center column the PCA-enhanced cube, and the right column the continuum-subtracted cube. The top row of panels shows the 262.657 GHz channel corresponding to -179 km s−1 of the HCN (4-3) transition, adopting a redshift of 0.0129 for IC 860. The bottom row of panels shows the 262.285 GHz 246 km s−1 channel. The center image is given in weight and the other two panels in mJy beam−1. |
| In the text | |
|
Fig. A.3. Comparison between the original data cube, the PCA-enhanced cube, and the continuum-subtracted data cube. The left column displays the original data cube, the center column the PCA-enhanced cube, and the right column the continuum-subtracted cube. The top row of panels shows the 264.318 GHz channel corresponding to -191 km s−1 of the HCN (4-3) transition, adopting a redshift of 0.0129 for IC 860. The bottom row of panels shows the 263.979 GHz 194 km s−1 channel. The center image is given in weight and the other two panels in mJy beam−1. |
| In the text | |
Current usage metrics show cumulative count of Article Views (full-text article views including HTML views, PDF and ePub downloads, according to the available data) and Abstracts Views on Vision4Press platform.
Data correspond to usage on the plateform after 2015. The current usage metrics is available 48-96 hours after online publication and is updated daily on week days.
Initial download of the metrics may take a while.