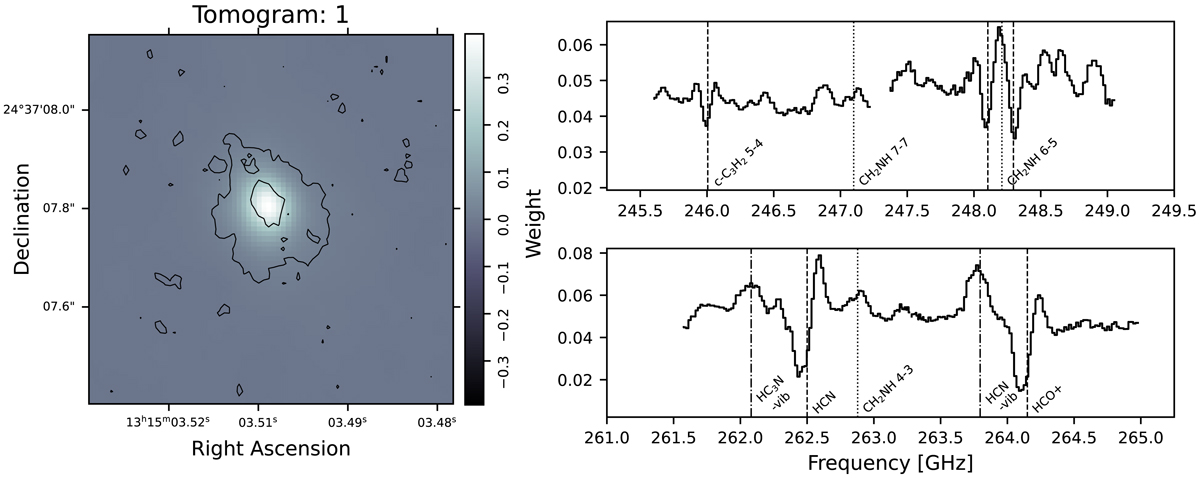
Fig. 5.
Download original image
First PC, which explains 92.29% of the variance. The tomogram is plotted to the left and the eigenspectrum to the right. White means stronger correlation, and black means anticorrelation. The 3σ contour of the CH2NH 413–312 transition is plotted in black. The vertical dotted lines represent the redshifted rest frequencies of the detected CH2NH transitions, the vertical dashed lines show the redshifted rest frequencies of the ground-state c-C3H2, HCN, and HCO+ lines, and the vertical dashed-dotted lines represent the redshifted rest frequencies of the HCN-vib and HC3N-vib lines. The two lines on either side of the CH2NH 6–5 transition are unlabeled and correspond to c-C3H2 transitions J = 7 − 6 and a doublet of J = 6 − 5 transitions.
Current usage metrics show cumulative count of Article Views (full-text article views including HTML views, PDF and ePub downloads, according to the available data) and Abstracts Views on Vision4Press platform.
Data correspond to usage on the plateform after 2015. The current usage metrics is available 48-96 hours after online publication and is updated daily on week days.
Initial download of the metrics may take a while.