Fig. 9.
Download original image
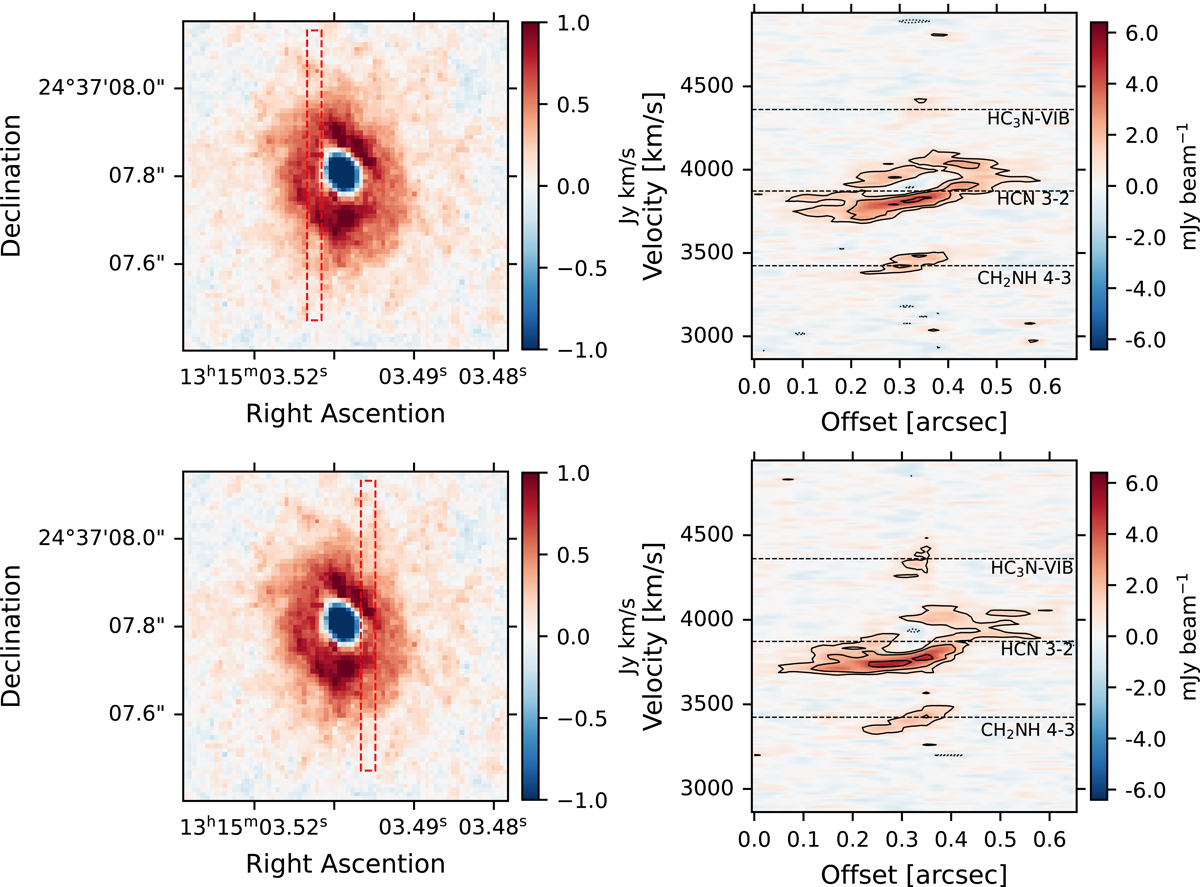
Position-velocity slices through the data cubes along the major axis of rotation. The left column shows the integrated flux map of the HCN 3–2 transition, with the location of the 0![]() 7 by 0
7 by 0![]() 033 PV slice through the data cube containing the HCN 3–2 transition. The contours show 3, 6, 12, 24, and 48 times 0.3 mJy. The horizontal dashed black lines show the systemic velocity of the indicated transitions, and the velocity axis is shown in the optical convention utilizing the rest frequency of the HCN 3–2 transition.
033 PV slice through the data cube containing the HCN 3–2 transition. The contours show 3, 6, 12, 24, and 48 times 0.3 mJy. The horizontal dashed black lines show the systemic velocity of the indicated transitions, and the velocity axis is shown in the optical convention utilizing the rest frequency of the HCN 3–2 transition.
Current usage metrics show cumulative count of Article Views (full-text article views including HTML views, PDF and ePub downloads, according to the available data) and Abstracts Views on Vision4Press platform.
Data correspond to usage on the plateform after 2015. The current usage metrics is available 48-96 hours after online publication and is updated daily on week days.
Initial download of the metrics may take a while.