Fig. A.1.
Download original image
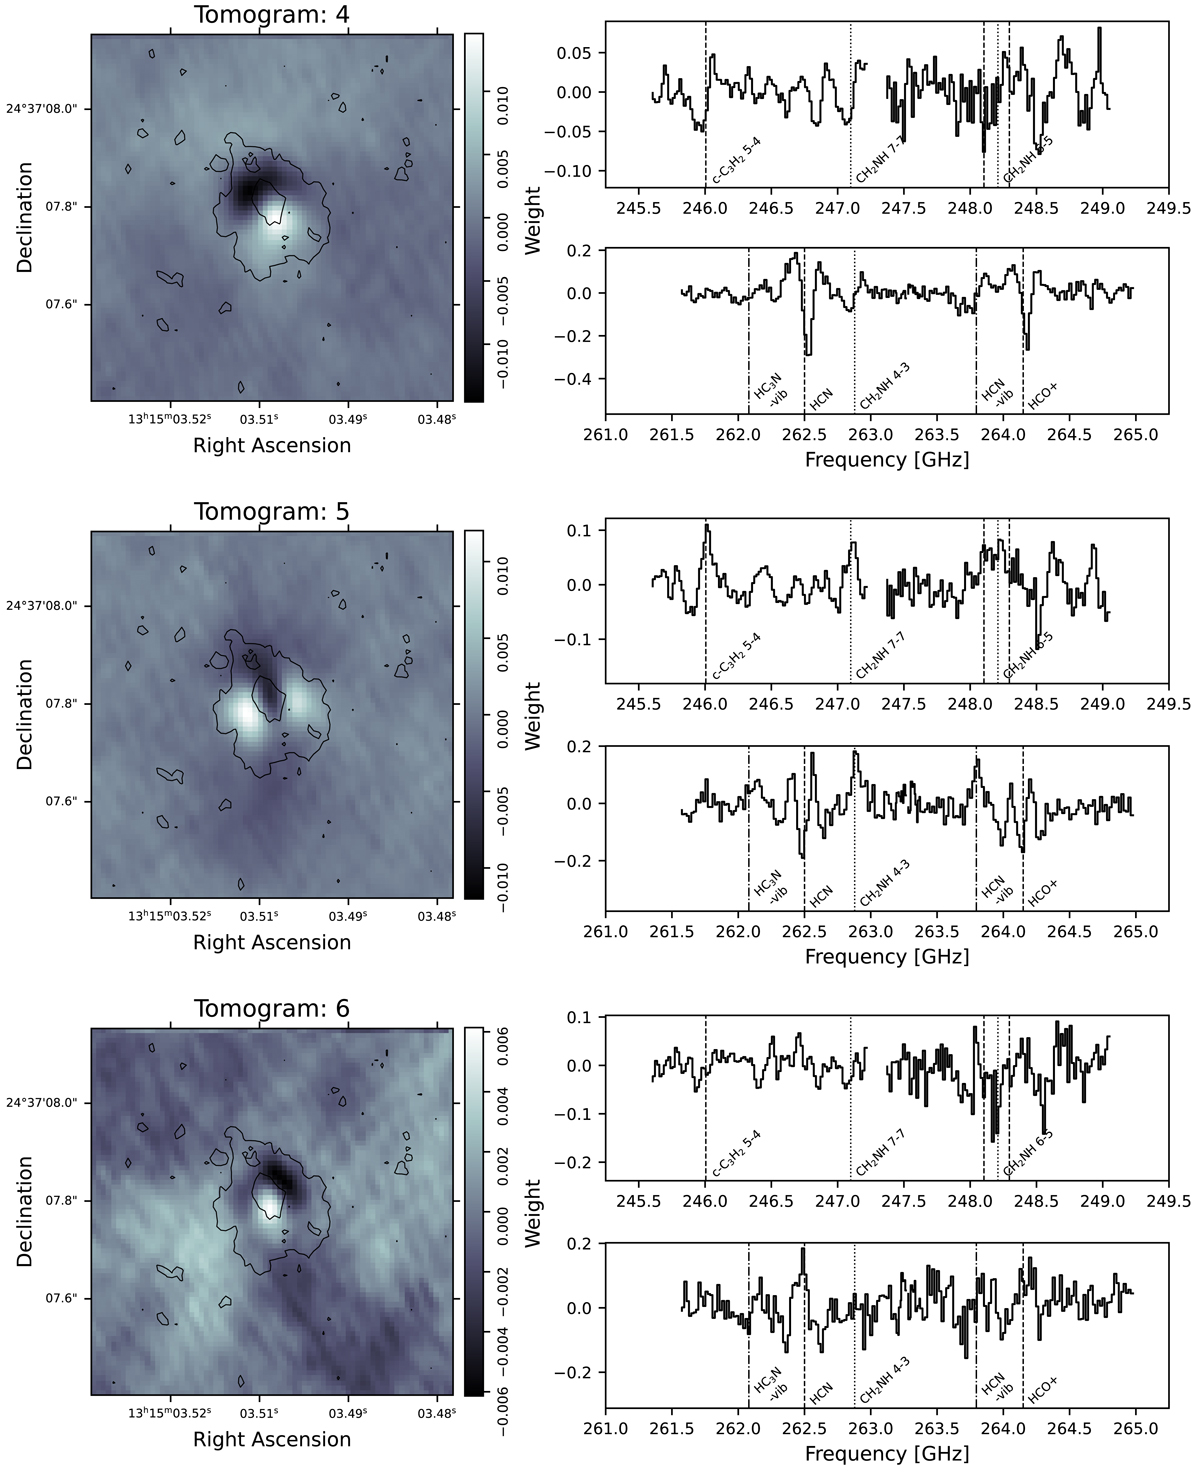
Principal components four to six. White means stronger correlation and black means anticorrelation. The 3σ contour of the CH2NH 413-312 transition is plotted in black. PC 4 shows anticorrelation between redshifted and blueshifted emission from vibrational transitions, indicating a more slowly rotating structure and a change in excitation of the molecular gas. PC 5 shows a double-lobed structure associated with line wings. PC 6 shows a correlation with the low velocity components of the ground state HCN line and a weak anti-correlation with the line wings. The vertical lines mark the redshifted rest frequencies of the same lines identified in Fig. 5.
Current usage metrics show cumulative count of Article Views (full-text article views including HTML views, PDF and ePub downloads, according to the available data) and Abstracts Views on Vision4Press platform.
Data correspond to usage on the plateform after 2015. The current usage metrics is available 48-96 hours after online publication and is updated daily on week days.
Initial download of the metrics may take a while.