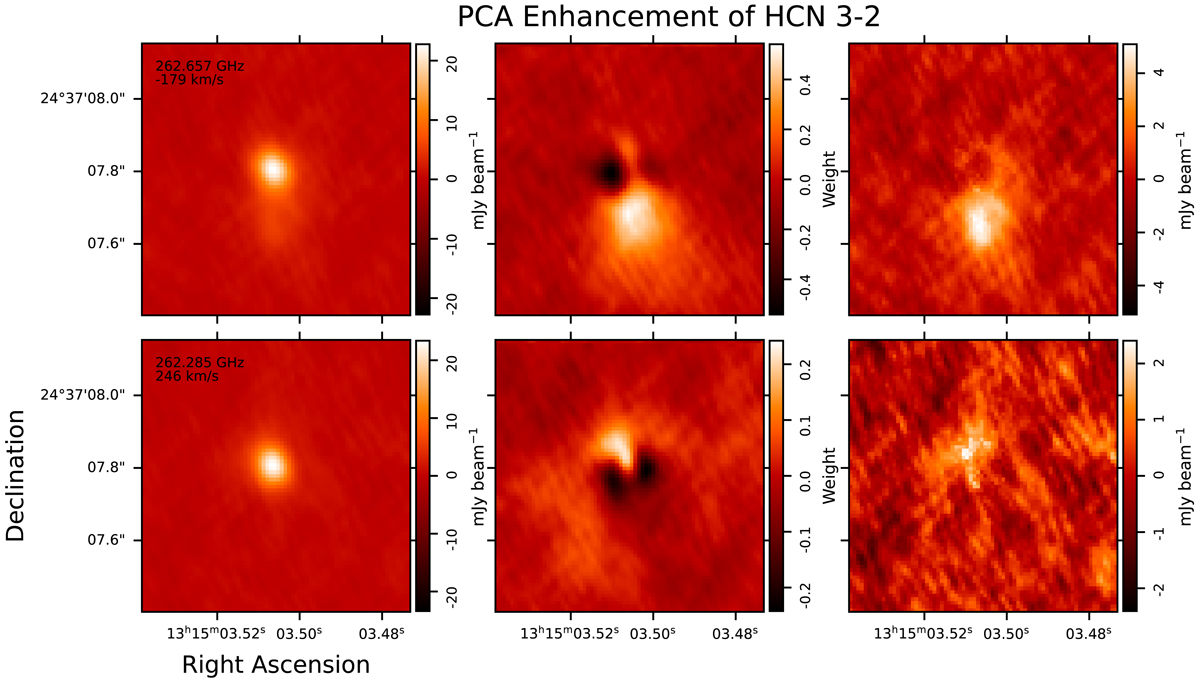
Fig. A.2.

Download original image
Comparison between the original data cube, the PCA-enhanced cube, and the continuum-subtracted data cube. The left column displays the original data cube, the center column the PCA-enhanced cube, and the right column the continuum-subtracted cube. The top row of panels shows the 262.657 GHz channel corresponding to -179 km s−1 of the HCN (4-3) transition, adopting a redshift of 0.0129 for IC 860. The bottom row of panels shows the 262.285 GHz 246 km s−1 channel. The center image is given in weight and the other two panels in mJy beam−1.
Current usage metrics show cumulative count of Article Views (full-text article views including HTML views, PDF and ePub downloads, according to the available data) and Abstracts Views on Vision4Press platform.
Data correspond to usage on the plateform after 2015. The current usage metrics is available 48-96 hours after online publication and is updated daily on week days.
Initial download of the metrics may take a while.


