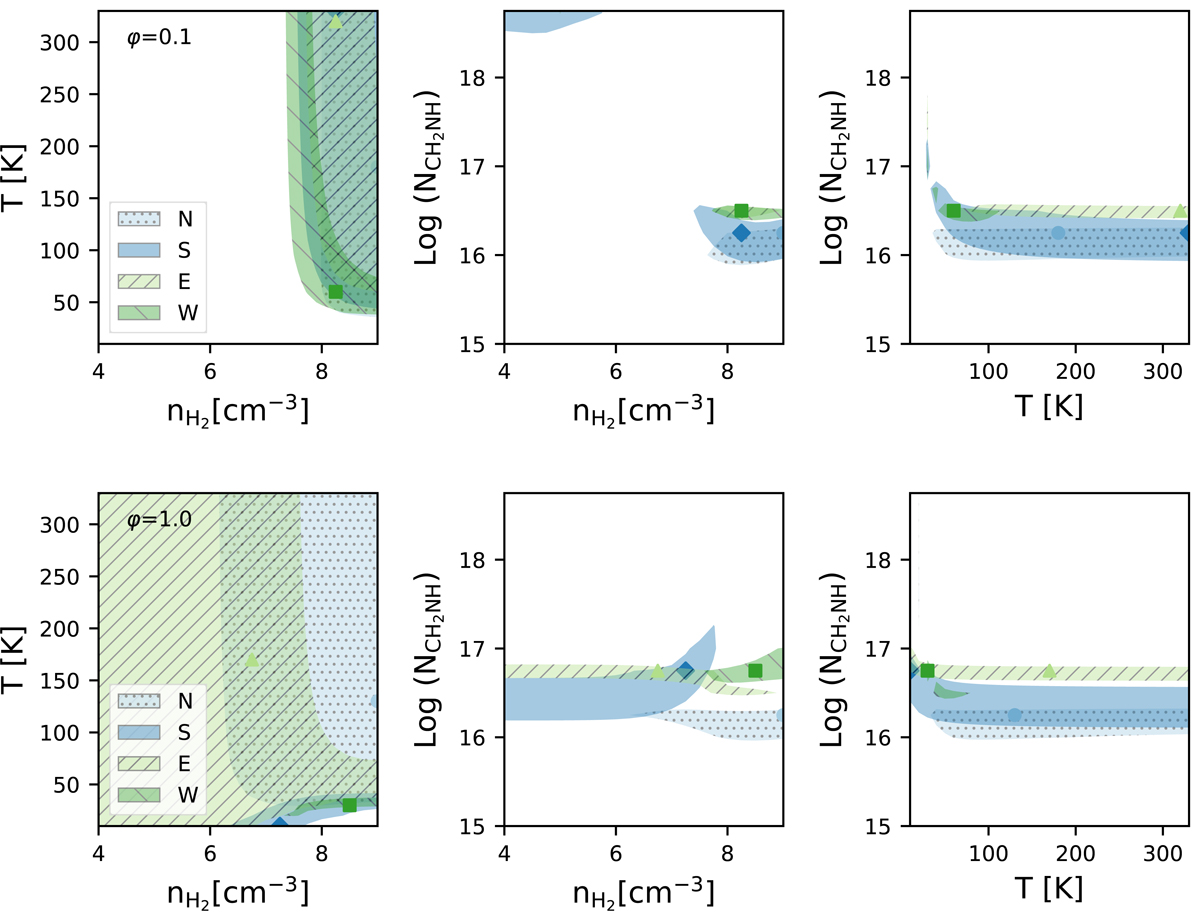
Fig. 7.
Download original image
Non-LTE models showing the best fit to the detected CH2NH transitions. Blue contours represent the north-south axis, with the north region filled with dots. The east-west contours are shown in green with forward and backward hatch marks. The top row shows the φ = 0.1 case and the bottom row shows the φ = 1.0 case. The shaded area represents 3σ from the best fit. In both cases, the temperature is generally unconstrained. In the φ = 1.0 case, the density is also unconstrained, but the φ = 0.1 case has a lower limit of 107.5 cm−3. Additionally, both cases show an enhancement of methanimine along the east-west axis.
Current usage metrics show cumulative count of Article Views (full-text article views including HTML views, PDF and ePub downloads, according to the available data) and Abstracts Views on Vision4Press platform.
Data correspond to usage on the plateform after 2015. The current usage metrics is available 48-96 hours after online publication and is updated daily on week days.
Initial download of the metrics may take a while.