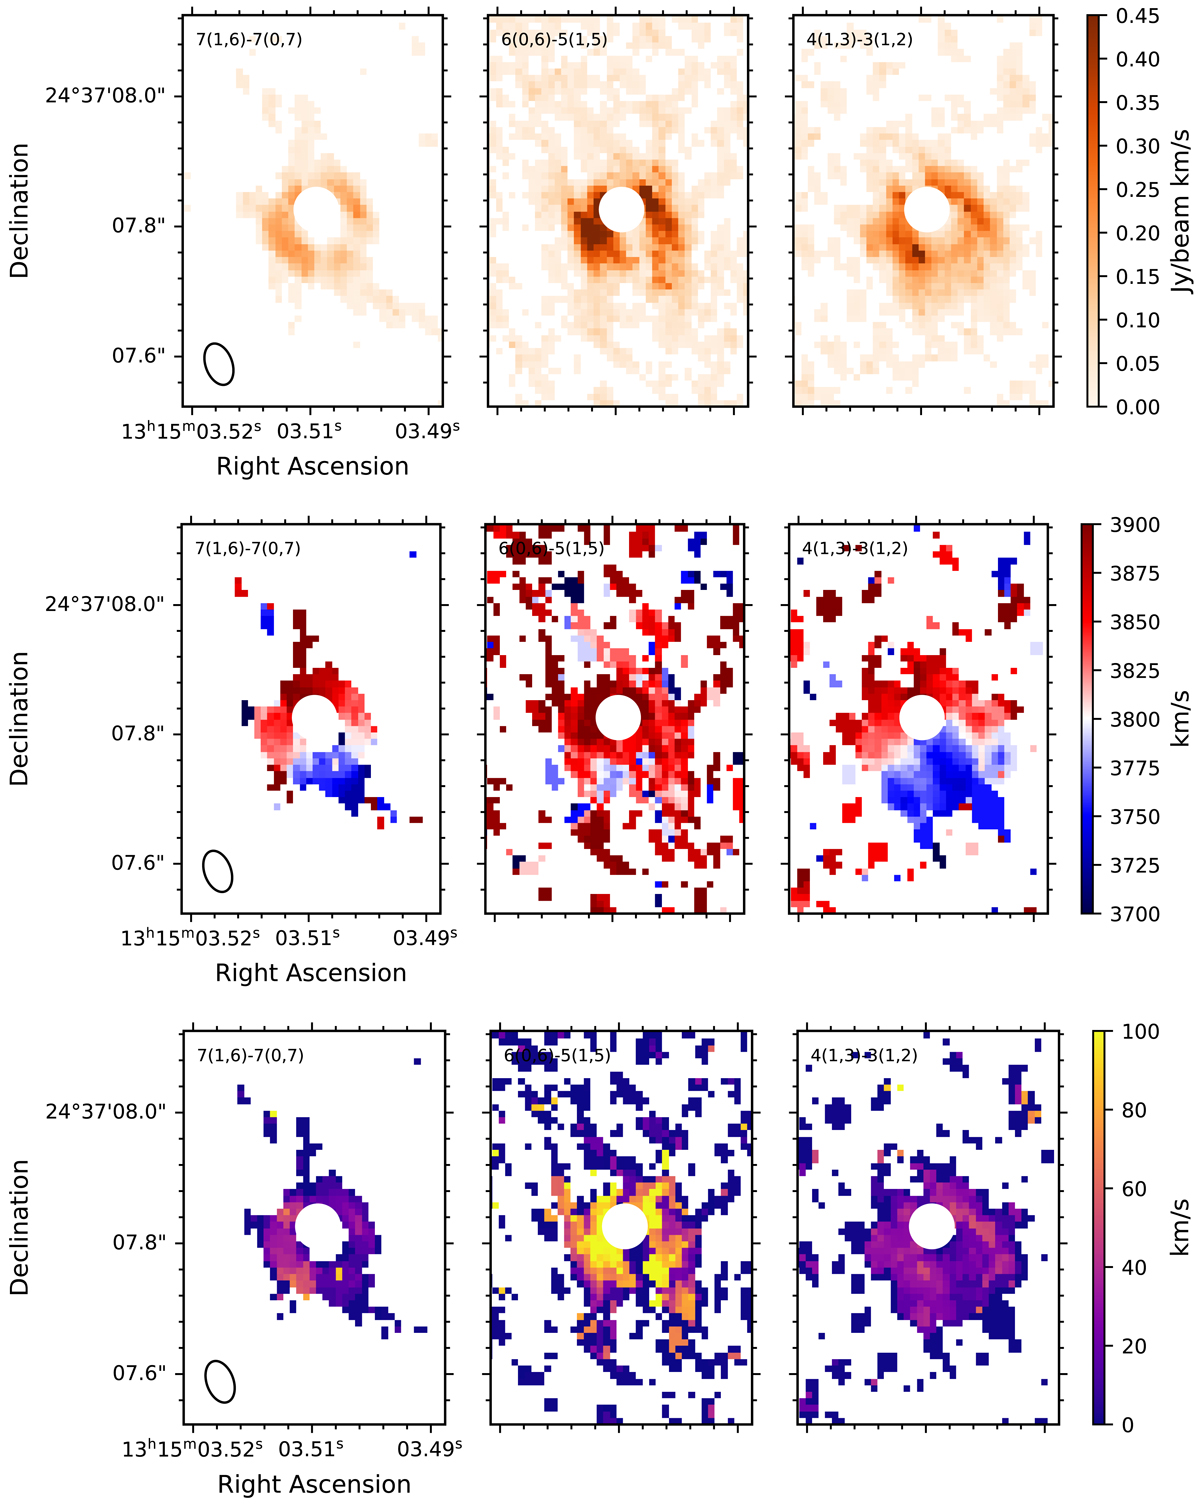
Fig. 2.
Download original image
Integrated intensity maps (top row), intensity-weighted velocity maps (middle row), and dispersion maps (bottom row) after removal of the continuum of the CH2NH 7(1,6)–7(0,7), 6(0,6)–5(1,5) and 4(1,3)–3(1,2) transitions. Pixels with a signal < ± 3 times the sensitivity were excluded from the calculation of the velocity field, and the centermost 0![]() 07 is masked.
07 is masked.
Current usage metrics show cumulative count of Article Views (full-text article views including HTML views, PDF and ePub downloads, according to the available data) and Abstracts Views on Vision4Press platform.
Data correspond to usage on the plateform after 2015. The current usage metrics is available 48-96 hours after online publication and is updated daily on week days.
Initial download of the metrics may take a while.