Open Access
Fig. 3.
Download original image
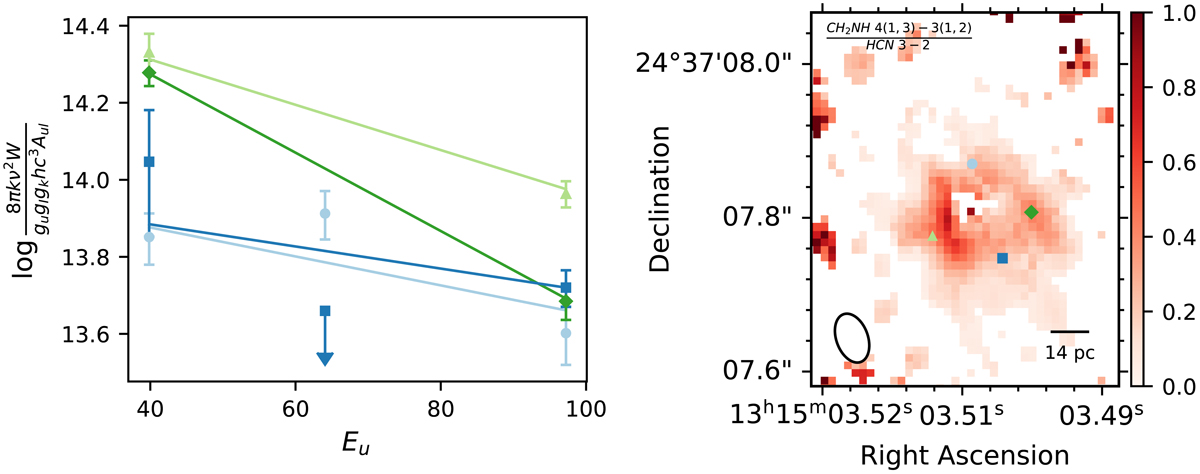
Rotation diagram for the CH2NH lines detected toward IC 860 (left) and the corresponding locations marked on the flux ratio map of the CH2NH 4(1,3)–3(1,2) to HCN 3–2 transitions (right). The flux ratio map only includes pixels with a signal > 3 times the sensitivity of the CH2NH 4(1,3)–3(1,2) transition.
Current usage metrics show cumulative count of Article Views (full-text article views including HTML views, PDF and ePub downloads, according to the available data) and Abstracts Views on Vision4Press platform.
Data correspond to usage on the plateform after 2015. The current usage metrics is available 48-96 hours after online publication and is updated daily on week days.
Initial download of the metrics may take a while.