| Issue |
A&A
Volume 670, February 2023
|
|
|---|---|---|
| Article Number | A32 | |
| Number of page(s) | 17 | |
| Section | Astrophysical processes | |
| DOI | https://doi.org/10.1051/0004-6361/202244967 | |
| Published online | 02 February 2023 | |
Taking a break: Paused accretion in the symbiotic binary RT Cru
1
CONICET-Instituto de Astronomía y Física del Espacio Ciudad Universitaria – Pabellon 2 Intendente Güiraldes 2160, C1428EGA Ciudad Autónoma de Buenos Aires, Argentina
e-mail: This email address is being protected from spambots. You need JavaScript enabled to view it.
2
Universidad de Buenos Aires, Facultad de Ciencias Exactas y Naturales, Buenos Aires, Argentina
3
Universidad Nacional de Hurlingham, Av. Gdor. Vergara 2222, Villa Tesei, Buenos Aires, Argentina
4
CRESST and X-ray Astrophysics Laboratory, NASA Goddard Space Flight Center, Greenbelt, MD 20771, USA
5
Department of Physics, University of Maryland, Baltimore County, 1000 Hilltop Circle, Baltimore, MD 21250, USA
6
Columbia Astrophysics Lab. 550 W120th St., 1027 Pupin Hall, MC 5247 Columbia University, New York, NC 10027, USA
7
Mullard Space Science Laboratory, University College London, Holmbury St Mary, Dorking, Surrey RH5 6NT, UK
8
Department of Physics & Astronomy, Stony Brook University, Stony Brook, NY 11794-3800, USA
9
Gemini Observatory/NSF’s NOIRLab, Casilla 603, La Serena, Chile
10
Institute of Astronomy and National Astronomical Observatory, Bulgarian Academy of Sciences, 72 Tsarigradsko Chaussee Blvd., 1784 Sofia, Bulgaria
11
Departamento de Física, Universidade Federal de Sergipe, Av. Marechal Rondon, s/n, 49100-000 São Cristóvão, SE, Brazil
12
Observatório Nacional, Rua Gal. José Cristino 77, 20921-400 Rio de Janeiro, RJ, Brazil
13
Instituto de Ciencias Astronómicas, de la Tierra y del Espacio (ICATE-CONICET), Av. España Sur 1512, J5402DSP San Juan, Argentina
14
Instituto de Investigación Multidisciplinar en Ciencia y Tecnología, Universidad de La Serena, Av. R. Bitrán 1305, La Serena, Chile
15
Departamento de Astronomía, Universidad de La Serena, Av. J. Cisternas 1200, La Serena, Chile
16
Universidad Nacional de Córdoba, Observatorio Astronómico de Córdoba, Laprida 854, 5000 Córdoba, Argentina
17
Consejo Nacional de Investigaciones Científicas y Técnicas (CONICET), Godoy Cruz 2290, Ciudad Autónoma de Buenos Aires, Argentina
Received:
13
September
2022
Accepted:
23
November
2022
Abstract
Symbiotic binaries sometimes hide their symbiotic nature for significant periods of time. There is mounting observational evidence that, in symbiotics that are powered solely by the accretion of the red giant’s wind material onto a white dwarf, without any quasi-steady shell burning on the surface of the white dwarf, the characteristic emission lines in the optical spectrum can vanish, leaving the semblance of an isolated red giant spectrum. Here we present compelling evidence that this disappearance of optical emission lines from the spectrum of RT Cru in 2019 was due to a decrease in the accretion rate, which we derived by modeling the X-ray spectrum. This drop in accretion rate leads to a lower flux of ionizing photons and thus to faint or absent photoionization emission lines in the optical spectrum. We observed the white dwarf symbiotic RT Cru with XMM-Newton and Swift in X-rays and UV and collected ground-based optical spectra and photometry obtained over the last 33 yr. This long-term coverage shows that, during most of the year 2019, the accretion rate onto the white dwarf was so low, Ṁ = (3.2 ± 0.06) × 10−11 M⊙ yr−1 (d/2.52 kpc)2, that the historically detected hard X-ray emission almost vanished, the UV flux faded by roughly 5 mag, the U, B, and V flickering amplitude decreased, and the Balmer lines virtually disappeared from 2019 January through March. Long-lasting low-accretion episodes such as the one reported here may hamper the chances of RT Cru experiencing a nova-type outburst despite the high mass of the accreting white dwarf.
Key words: binaries: symbiotic / X-rays: stars / stars: individual: RT Cru
© The Authors 2023
 Open Access article, published by EDP Sciences, under the terms of the Creative Commons Attribution License (https://creativecommons.org/licenses/by/4.0), which permits unrestricted use, distribution, and reproduction in any medium, provided the original work is properly cited.
This article is published in open access under the Subscribe-to-Open model. This email address is being protected from spambots. You need JavaScript enabled to view it. to support open access publication.
1. Introduction
Luna et al. (2013) proposed a definition for a symbiotic system, aiming to be as free as possible from observational biases: “a binary in which a red giant transfers enough material to a compact companion to produce an observable signal at any wavelength”. Among the symbiotic systems, those that accrete onto a white dwarf (WD) are dubbed “white dwarf symbiotics”. Among the WD symbiotics, systems with a high WD luminosity (L ≳ 10 L⊙) are powered by nuclear burning on the WD surface, while those with lower WD luminosities are powered by accretion. Among the accretion-powered WD symbiotics, one system stands out for its particularly high energy emission: RT Cru. RT Cru was first detected in the high energy regime with INTEGRAL in 2003−2004 (Chernyakova et al. 2005) at approximately a 3 mCrab level, in 2012 at a 13 mCrab level (Sguera et al. 2012), and in 2015 at a 6 mCrab level (Sguera et al. 2015). Luna et al. (2018a) analyzed multiwavelength data covering the late-2000 to mid-2017 period, when two brightening episodes with small amplitudes (ΔV ∼ 1.5) were observed in the optical, one of which was simultaneously covered with the Swift/Burst Alert Telescope (BAT) in high energies. The authors suggested that the brightness increases when the accretion rate through the accretion disk rises, but does not increase by the amount necessary to significantly change the optical depth of the disk’s innermost region. This behavior stands in contrast to what is observed in most dwarf novae or other symbiotics (e.g., T CrB; Luna et al. 2018b), where the accretion rate increases above the amount necessary to change the optical depth of the boundary layer, most likely due to disk instabilities.
In this article we describe new multiwavelength observations of RT Cru collected between 1989 and early 2022 that indicate a dramatic fade in the flux at all wavelengths since the beginning of 2019. In the following sections we describe the observations and the reduction procedure for every data set analyzed, showing that high dispersion spectra revealed no optical emission lines from 2019 January through March, while the fading was more pronounced and lasted longer in the high energy regime. Throughout the article we assume a distance of 2.52±0.19 kpc (Bailer-Jones et al. 2021). The results of the analysis of X-ray, UV, and optical data are described in Sect. 3. In Sect. 4 we discuss our conclusion, that the observed fading episode was due to a decrease in the rate of accretion through the disk.
2. Observations and data analysis
We observed RT Cru in X-rays and UV with XMM-Newton and Swift and obtained optical spectra with the SMARTS telescope. Fast optical photometry was obtained with the Helen Sawyer Hogg (HSH), Gemini-South, Swope, du Pont, and Transiting Exoplanet Survey Satellite (TESS) telescopes. We also collected multi-epoch photometric observations in the V and B bands from the American Association of Variable Star Observers (AAVSO) and the All Sky Automated Survey (ASAS; Pojmanski 2002). Figure 1 summarizes the data sets described above.
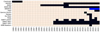 |
Fig. 1. Schematic view of the data sets used in this study. Filled black squares highlight the years of the observation obtained from a given instrument, database, or literature. Blue squares mark the year of the optical spectroscopic data. |
Figure 2 shows AAVSO, ASAS, and ASAS-SN optical photometry plus photometric observations extracted from Cieslinski et al. (1994), Swift/BAT/X-Ray Telescope (XRT)/Ultraviolet Optical Telescope (UVOT) light curves, and Hα and He I 6678 Å flux evolution.
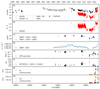 |
Fig. 2. Long-term optical to hard-X-ray variability of RT Cru. Panel a: RT Cru optical B- and V-band light curves with measurements from Cieslinski et al. (1994, black plus signs), ASAS (gray dots), AAVSO (black crosses for the V band, red circles for the B band), and ASAS-SN (open circles). Panel b: B − V curve from AAVSO data. Panel c: Swift/UVOT UVM2 (open circles) and UVW2 (blue dots) light curves. Panel d: Swift/BAT 14−50 keV measurements (light blue dots) with 100-day bins (with 1σ error bars). The maximum in the BAT light curve around 2011−2013 is due to an increase in the accretion rate, which did not increase enough to reach the level where the boundary layer becomes optically thick and a super-soft X-ray component arises (see Luna et al. 2018b). Between late 2019 and late 2020, RT Cru was not detected by Swift/BAT in 100-days bins. Panel e: Swift/XRT 0.3−10 keV count rate in log scale to highlight the fade in flux in 2019. Panel f: Swift/XRT softness ratio. Panel g: Hα (blue dots) and adjacent continuum (yellow dots) flux evolution. Panel h: He I 6678 Å (red dots) and adjacent continuum (black dots) flux evolution. Starting around mid-2017, the B − V color became redder for a few years (panel b), during which time the hard X-ray flux dipped (panel d). The UV and soft X-ray emission (panels c and e) also dipped at around that same time. |
2.1. XMM-Newton
RT Cru was observed with XMM-Newton for 58.8 ks on 2019 March 3 following our request through Director’s Discretionary Time (ObsID 0831790801). The EPIC MOS1, MOS2, and pn cameras were operated in full window mode, with the optical blocking medium filter. We selected standard grades for the pn (0−4) and MOS 1/2 (0−12) cameras. The RGS1 and RGS2 cameras were operated in spectroscopy mode but rendered spectra with low signal-to-noise, useless for performing spectral analysis. The optical monitor in fast mode provided photometry by switching between the UVW1, UVW2 and UVM2 filters.
Data were reduced with the Science Analysis Software (SAS) version 20.0.0. Removing intervals with high flaring background, the net exposure time of the EPIC cameras was reduced to 36.4 ks. X-ray spectra from the source and background were constructed using data extracted from circular regions with 20 and 45 arcsec radii, respectively. The source region was centered on RT Cru’s optical coordinates, while background was selected in a nearby, source-free area. We used the rmfgen and arfgen scripts to build the redistribution matrices and ancillary EPIC responses. The energy channels were grouped in such a way that each spectrum had at least 25 counts per bin. In the case of the Optical Monitor (OM), we used the omfchain/SAS task to extract photometric series from the UVW1 filter with a bin size of 120 s. RT Cru was not detected in the UVW2 and UVM2 filters.
2.2. Swift
Swift/XRT and UVOT pointed observations aside from those already reported in Luna et al. (2018a) were obtained through Target of Opportunity request every 1−2 months from 2019 January 15 to 2022 April 24.
2.2.1. Swift/BAT
The Swift/BAT light curve in the 14−50 keV was extracted from the Swift/BAT Hard X-ray Transient Monitor (Krimm et al. 2013) and binned at 100 days using the HEASOFT tool lcurve (see panel d in Fig. 2).
2.2.2. Swift/XRT
Since 2005, Swift has observed RT Cru with the XRT more than a hundred times, with a total exposure time of 240 ks. The exposure time of each of these snapshots was generally short, less than 2 ks on average, and thus the number of counts in each spectrum was low, precluding spectral modeling of the spectra individually. The XRT light curve from the individual pointings is clearly variable on short and long terms (see panels e and f in Fig. 2). With the goal of studying the long-term behavior in X-rays, we selected events with grades 0−12 and constructed six spectra from the XRT data by combining the event files from 2005 August 20 to 2007 September 29 (Swift 2005), 2009 April 19 to 2009 December 26 (Swift 2009), 2011 June 7 to 2012 December 12 (Swift 2011), 2015 November 16 to 2016 April 23 (Swift 2015), 2019 January 15 to 2019 February 12 (Swift 2019A) and 2019 September 1 to 2022 April 24 (Swift post-2019). Figure 3 shows the XRT light curve and the intervals from which the event files were combined and spectra extracted.
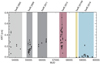 |
Fig. 3. Swift/XRT count rate light curve in the 0.3−10 keV energy range. The colored boxes show the observations that were combined to obtain the spectra analyzed in Sect. 2.2.2. |
We extracted a long-term light curves and softness ratios (see panels e and f in Fig. 2) during each XRT pointing by selecting those photons enclosed in a 12 arcsec radius circular region centered on coordinates provided by the tool xrtcentroid, which did not differ significantly from the optical coordinates. The corresponding background was extracted from an annulus region of 60 arcsec inner radius and 95 arcsec outer radius centered on the same coordinates as the source region. The same regions were used to extract the combined spectra, and the corresponding ancillary matrices were generated using the HEASOFT tool mkrarf while the response matrices were downloaded from the Calibration site of the High Energy Astrophysics Science Archive Research Center (HEASARC1).
Very bright optical sources tend to generate artifacts that mimic X-ray photons or change the grades and energies of the X-ray photons, a process known as optical loading. Given that on average, the V optical magnitude of RT Cru is 12 mag, we emphasize that both grade distribution and offset maps, as expected, indicate that the Swift/XRT and XMM-Newton/EPIC data were not affected by optical loading, and that the soft X-rays in their spectra are real2.
2.2.3. Swift UVOT
The UVOT aboard Swift observed concurrent with the XRT instrument in either a lenticular filter or the UV grism. The lenticular filters used were one of UVW2, UVM2, UVW1, U, or V. The images were used to check that the observation was good, that is, that the source did not fall on one of the patches of lower sensitivity and that the pointing was stable. Calibrated magnitudes and the corresponding errors (Poole et al. 2008; Breeveld et al. 2011) were obtained using the HEASOFT V6.28 Ftool uvotsource, which had been modified to flag data falling on a low-sensitivity patch on the detector3. The Swift/UVOT Calibration Database (CALDB) version used was 20201019, which includes the most recent updated calibration files accounting for sensitivity changes4. The observations with the grism were checked for substantial contamination by any of the many sources in the crowded field. The valid roll angles varied throughout the year, and data for some dates were not usable. Also, the UV brightness in RT Cru was seen from time to time to drop below the detection level, in which case RT Cru was only detected above 4000 Å. In order to obtain good S/N, extracted UVOT spectra from exposures spanning one day at most were summed. We used the calibration by Kuin et al. (2015), and the spectral extraction software from Kuin (2014).
2.3. Optical spectroscopy
We obtained 31 spectra of RT Cru between 2019 January 26 and 2022 April 15 (see the observing log in Table A.1) using the Chiron spectrograph (Tokovinin et al. 2013). Chiron is a bench mounted fiber fed cross-dispersed echelle spectrograph on the 1.5 m on the SMARTS telescope at the Cerro Tololo InterAmerican Observatory. We took data in “fiber mode”, with 4 × 4 on-chip binning yielding a resolution λ/δλ≈27 800. Exposure times range from 10 to 30 min in 10 min integrations.
The data were reduced using a pipeline coded in Interactive Data Language (IDL; Walter 20175). The images were flat-fielded. Cosmic rays were removed using the L.A. Cosmic algorithm (van Dokkum 2001). The 74 echelle orders were extracted using a boxcar extraction, and instrumental background, computed on both sides of the spectral trace, was subtracted. As Chiron is fiber-fed, there is no simple method for subtracting the sky. The fibers have a diameter of 2.7 arcsec on the sky. In any event, for bright targets like RT Cru, night sky emission is generally negligible apart from narrow [OI] and Na D lines and some OH airglow lines at longer wavelengths. Wavelength calibration uses ThAr calibration lamp exposures at the start and end of the night, and occasionally throughout the night. Chiron in fiber mode is stable to better than 250 m s−1 over the course of many nights.
The instrumental response was removed from the individual orders by dividing them by the spectra of a flux-standard star, μ Col. This provides flux-calibrated orders with a systemic uncertainty due to sky conditions. The individual orders were spliced together, resulting in a calibrated spectrum from 4083 to 8900 Å. Finally, we used contemporaneous BVRI photometry to scale the spectrum to approximately true fluxes.
2.4. Optical photometry
2.4.1. ASAS and AAVSO
For the ASAS data, we only considered those with quality flag “A” in the GRADE column and apertures with radii less than 30 arcsec. In the case of AAVSO, we selected V and B magnitude measurements, ignoring those data without measurement error bars.
2.4.2. Swope, du Pont, and Gemini telescopes
In the framework of a long-term optical survey aimed at searching and characterizing rapid photometric variability (i.e., flickering) in southern symbiotic stars and nova-like objects (Angeloni et al. 2012, 2013), we have been monitoring RT Cru since 2012 with various facilities in Chile. The flickering data presented in this paper were collected at the 1 m Swope telescope and at the 2.5 m du Pont telescope of the Las Campanas Observatory as well as at the 8.1 m Gemini-South telescope.
Table A.2 presents a list of the observations where, for each date, we report the MJD, calendar date, the maximum minus minimum magnitudes (max-min), average magnitude, band, facility (telescope/instrument combination), the overall length of each light curve and the duration of individual exposures. For technical details about the telescope/instrument configuration (e.g., field-of-view, pixel-scale, read-out times, etc.), we refer the interested reader to the official observatory websites678. The data reduction for this quite heterogeneous data set was self-consistently performed with THELI v3.0.5 (Schirmer 2013), a powerful and versatile tool for the automated reduction of astronomical images. The differential ensemble photometry (Honeycutt 1992) was then performed with VAPHOT (Deeg 2013; Deeg et al. 2001), an aperture photometry package running within the IRAF environment, specifically developed for dealing with precise time-series photometry of uncrowded fields. Its characteristic feature is the ability to work with aperture sizes that have been finely tuned (through preliminary point-spread-function fitting) to generate the best signal-to-noise ratio for each target/comparison star(s) in a single CCD frame.
Because of RT Cru’s large brightness variation in the course of the last fifteen years, it was not possible to use the same exposure times nor the same set of comparison stars across the different observing runs. Moreover, even though the flickering survey was preferentially conducted through the Johnson U filter, during RT Cru’s low state we had to resort to the B filter in order to both keep the sampling rate of the flickering light curve reasonably short (i.e., under about 5 min) and, at the same time, reach suitable S/N values. We conservatively assumed as photometric error of our RT Cru flickering light curve the standard deviation of the differential light curves built with the comparison stars used for the ensemble photometry (refer to Angeloni et al. 2012; Milone & Pel 2011 for more details about this technique).
2.4.3. Helen Sawyer Hogg (HSH) telescope
Photometric observations in B, V, and R bands were obtained with the 0.6 m HSH telescope located at Complejo Astronómico El Leoncito, Argentina9, from 2021 February 15 to 2022 May 4 (see also Table A.2). The telescope is equipped with a SBIG STL-1001E CCD camera and UBVRI Johnson-Cousins filters.
The data reduction and aperture photometry were performed by using AstroImageJ (Henden et al. 2015). The data reduction included: bias and dark subtraction and flat field correction. The photometric standards from the AAVSO Photometric All-Sky Survey (APASS) catalog (Collins et al. 2017), 2MASS 12345405-6435040 (T2), 2MASS 12345752-6435099 (T3), and 2MASS 12345855-6436071 (T4), were used to obtain absolute magnitude of RT Cru. These stars are located at an angular distance of less than 2.2 arcmin from RT Cru. The observing log is listed in Table A.2 while light curves from each observing run are displayed in Fig. A.1.
2.4.4. TESS
TESS (Ricker et al. 2014) observed the field of RT Cru during Sector 11 (2019 April 22–May 21) and again in Sectors 37 and 38 (2021 April 2–May 26). Cadences were 30 min in Sector 11, and 10 min in Sectors 37 and 38. For all sectors, the photometric accuracy was 0.001 mag. TESS is a single-channel photometer with a 6000−10 000 Å bandpass.
We downloaded 40 × 40 pixel cuts from the full frame image data from the MAST archives using the TESScut software (Brasseur et al. 2019). TESS images, while photometrically stable and of continuous cadence, suffer from coarse spatial resolution (21″ pixels). We extracted the data using aperture photometry with a 2.5 pixel radius. Background is extracted from an annulus between 5 and 10 pixels from the source. Because there are often other sources in the background annulus, we iteratively select the background pixels, removing those more than 3σ from the median level until we converge on the median background level. We assume that the background is spatially flat in this region.
Figure 4 shows the light curves of Sectors 11, 37, and 38. There is a gap in each sector because the spacecraft is reoriented to dump data in the midst of each sector. Consequently, we analyzed each half of the 27 day light curve of each sector separately. To study the short (minutes to a few hours) timescales, we subtracted from each light curve a Savitzky–Golay (SG; Savitzky & Golay 1964) filter to remove the long-term (days) trend.
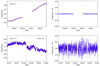 |
Fig. 4. TESS light curves of the observations obtained during Sector 11 in 2019 with a 30 m cadence (top row), and the light curves from observations obtained during Sectors 37 and 38 in 2021 with a 10 m cadence (bottom row). The vertical dashed line in the lower left-hand plot marks the separation between Sectors 37 and 38. In the right-hand panel, each portion of the light curve of each sector has a SG filter (red line in the left panels) subtracted from it to enable the study of short-term, flickering-type variability. Variability on timescales shorter than 10 min (in Sectors 37 and 38) or 30 min (in Sector 11) cannot be detected. In addition, the measurement errors (0.001 mag) are larger than the observed dispersion; no short-term variability can be detected. |
We searched for periods in the light curve by using the R10 implementation of the REDFIT algorithm (Schulz & Mudelsee 2002), which uses the Lomb-Scargle algorithm, accounts for and models the red noise, and performs Monte Carlo tests for computing red noise false-alarm levels at the 1, 2, and 3σ levels.
2.4.5. Classification of the optical spectrum during the optical minimum
In contrast to the optical spectra from 2018 presented in Luna et al. (2018a), the optical spectra taken in 2019 reminds one of a single red giant. We first corrected the optical spectrum obtained on 2019 March 17 with SMARTS and the 2019 January UV spectrum obtained with Swift/UVOT for interstellar reddening using EB − V = 0.53 (roughly corresponding to the interstellar absorption toward RT Cru as provided by the STructuring by Inversion the Local Interstellar Medium team11Capitanio et al. 2017) and the extinction law of Cardelli et al. (1989). We then performed spectral classification of March SMARTS spectrum with the Python package PyHammer (Kesseli et al. 2017), which enables the comparison of various spectral templates with the spectrum under investigation, and visual inspection. PyHammer gives spectral type M5 as the best fit to the spectrum. The precision with which PyHammer works is approximately one spectral subtype (Kesseli et al. 2017). The spectrum was normalized by the flux at 8150 Å. Using the minimum V-band magnitude in 2019 when the optical emission lines disappeared (mV = 13.303 ± 0.026, from the AAVSO database) and the distance of 2.52 ± 0.19 kpc, we calculated MV = −0.28 ± 0.18. We find the luminosity class of RT Cru to be III, as derived from spectral type-absolute magnitude (MV) calibration (Table 2 in Straizys & Kuriliene 1981). The B − V color from early 2017 through late 2020 indicates that the emission from the system became redder during that time (see Fig. 2 panel b), supporting our contention that the red giant emission overwhelmed that from the WD and/or the accretion disk. Comparing the spectrum with templates of M giants by Zhong et al. (2015) we find that the spectrum was closer to the M6 III template. In Fig. 5 we plot the 2019 March 17 spectrum and the UVOT 2019 January with the template obtained from Zhong et al. (2015). The UVOT spectrum is also compatible with that of a single M6 III red giant (the flux calibration above 4000 Å is highly uncertain due to possible contamination of higher order spectra and was removed from the data).
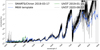 |
Fig. 5. SMARTS optical spectrum of RT Cru obtained on 2019 March 17 (black line) and the UVOT spectra obtained on 2019 January 15 (green line) and 2020 August 12 (gray line), corrected for the interstellar extinction using E(B − V) = 0.53. The blue line is a template spectrum of an M6III giant from Zhong et al. (2015). |
3. Results
Below, we describe evidence that the changes in the observational appearance of RT Cru beginning in mid-2017 – namely the vanishing of characteristic symbiotic-star optical emission features along with the scaling down of the flickering amplitude and the X-ray luminosity – were the result of a strong drop in the rate of accretion onto the WD. This finding was possible thanks to the broadband energy coverage, which allowed us to measure the accretion rate via modeling of the X-ray spectrum, along with quasi-simultaneous observations of phenomenological changes at other wavelengths.
3.1. The disappearance of optical emission lines in 2019
The first hint of a decrease in the accretion rate came from the disappearance of the typically-observed Balmer emission lines, with the optical spectrum coming to resemble that of a single red giant (see Fig. 5).
In Fig. 6 we show a series of optical spectra taken from 2019 March to 2022 April, when it can be seen that Hα (usually the strongest emission line in RT Cru as observed in spectra taken in 2012; see Luna et al. 2018a) was in absorption through 18 March, and was weakly in emission by 2019 May 22, after which the strength grew more or less monotonically (see panel g in Fig. 2).
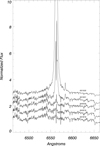 |
Fig. 6. Selected optical spectra taken with the SMARTS/Chiron telescope from 2019 March through 2022 March (see the complete list of spectra in Table A.1). Since 2019 March, Hα has been detected in emission and its flux has increased monotonically (see panel g in Fig. 2). Other lines, such as N[II] 6584 Å, were also missing in 2019 and reappeared in emission afterward. |
3.2. The reduction of rapid optical and UV variability in 2019
In symbiotics powered by accretion alone, a hallmark of the presence of the accretion disk is the strong variability in optical/UV brightness observed on timescales of a few seconds to a few minutes (Sokoloski et al. 2001; Luna et al. 2013), namely, flickering. Since its discovery, RT Cru has shown strong flickering in every wavelength observed, from X-rays to optical (Schmid 1994; Ducci et al. 2016; Luna et al. 2018a; Danehkar et al. 2021). Our ground-based optical photometric observation runs spanned on average a few hours, with varying exposure times during different observing runs. In order to study the flickering amplitude in AAVSO data, we grouped those observation taken within a single night and with more than 70 measurements with a maximum cadence of 1 min. The TESS light curves show significant contribution of red noise during Sectors 37 and 38, whereas during Sector 11 (observed in 2019 April), the light curve did not show significant variability on short timescales. No periods were detected above a detection threshold of 1, 2 and 3σ (see Fig. 7). The flickering amplitudes from the ground-based observations and TESS, measured as max-min in each light curve, are listed in Table A.2. During most of 2019 the amplitude clearly decreased, as evidenced by the small amplitude of flickering in the U and B light curves in 2019 February taken with the du Pont telescope, in 2019 March and July taken with the Swope telescope and in 2019 April and May taken with TESS (see Figs. A.3 and 4). The UVM1 XMM-Newton/OM light curves obtained during the 2019 observation show a much fainter UV emission than during the Swift observations in 2016 and 2021, with high photometric errors. Thus, the uncertainty in the amplitude is comparable to the amplitude itself (max-min = 0.76±1.07), pointing to an unusually small variability that is consistent with the major drop in the amplitude of the rapid variability seen from the ground (see Fig. 8).
 |
Fig. 7. Search for periodicities in the TESS light curves. Top: TESS light curve of the second half of Sector 38. Bottom: Lomb-Scargle power spectrum (green line) with red noise model (black line) and detection levels at 3σ (orange). |
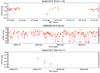 |
Fig. 8. UVW2 Swift/UVOT and XMM-Newton/OM light curves with 120 s bins. The UVOT light curves from dates outside the low-flux optical state (years 2016 and 2021; top and bottom panels) show strong variability, whereas the light curve from the 2019 XMM-Newton/OM observation (middle panel) shows a much fainter source with no significant variability. |
3.3. The decrease in absorbing column and accretion rate from the X-ray spectrum
By modeling the X-ray spectrum, we can estimate the accretion rate through the optically thin emitting boundary layer (e.g., Luna et al. 2018b). The hard X-ray spectrum of accreting WDs can be described by that of an isobaric cooling flow, where the plasma is radiatively cooling from a high post shock temperature under constant pressure. Given the high temperature of the X-ray emission, the most likely region where this emission arises is the accretion disk’s boundary layer, where strong enough shocks are expected in the case of a massive WD. In such a case, its luminosity should be half of that provided by the accretion flow. The mkcflow XSPEC model yields the accretion rate through its normalization. We fit the Swift-combined spectra (see Sect. 2.2.2) with a model similar to that used to model earlier X-ray spectra from NuSTAR (obtained in 2016 November 22) and Suzaku (obtained in 2012 February 06) in Luna et al. (2018a): with full-covering and partial-covering absorbers that modify an isobaric cooling flow plus a Gaussian profile to account for the presence of the Fe Kα fluorescence line at 6.4 keV (TBabs×pcfabs×(mkcflow+gauss)). In the spectra Swift 2005, Swift 2009, Swift 2011, and Swift 2015 an additional optically thin thermal model (apec) is needed to fit the emission at energies below 1 keV. This extra emission is consistent with β-type emission (Muerset et al. 1997), and, as it is not subject to the same absorption as the cooling flow component, we suggests that it arises in a colliding-winds region. We note, however, that due to the low number of counts in this spectral region, the resulting parameters from the fit cannot be constrained. The XMM-Newton (2019 March) and Swift/2019 spectra (2019 January–February) required a simpler model without the need of a partial covering absorber or an additional thermal component.
The investigation of all spectra assumed a maximum temperature of 53 keV, as determined in Luna et al. (2018a), and the normalization of the mkcflow component was allowed to vary freely and ultimately correspond to the expected accretion rate through the optically thin portion of the accretion disk’s boundary layer. The resulting parameters from the fit are listed in Table 1. Figure 9 shows the spectra and corresponding best-fit models, where we omitted the MOS 1 and MOS 2 XMM-Newton spectra for clarity, but used them during the spectral modeling. The absorption column shows a significant decrease during the 2019 observations, with the lowest value during the XMM-Newton observation in 2019 March. In the course of low accretion periods, less material is available to absorb the X-ray emission from the inner accretion disk, and thus a lower absorption column results from the spectral modeling. If the orbital-modulated accretion rate scenario proposed by Luna et al. (2018a) is correct, then the low accretion rate, low absorption periods take place during apastron.
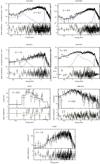 |
Fig. 9. X-ray spectral evolution between 2005 and 2022, as revealed by XMM-Newton and Swift. The solid curves in the top portion of each panel are the best-fit models, while dotted lines show the contribution of each spectral component in the cases where more than one spectral component was needed to model the spectrum (see Sect. 3.3). Each panel lists the accretion rate through the optically thin boundary layer (Ṁ, in units of 10−9 M⊙ yr−1). The resulting fit parameters are listed in Table 1. The spectra taken in 2019 with Swift and XMM-Newton clearly show a decrease both in absorption and accretion rate. |
The accretion rates through the optically thin portion of the accretion disk boundary layer derived from the fit of X-ray spectra taken at the different epochs described in Sect. 2.2.2 (see Table 1) show that the accretion rates during the XMM-Newton and Swift 2019A spectra were the lowest measured in RT Cru.
The NuSTAR spectrum analyzed in Luna et al. (2018a) shows that the X-ray emission in the 14−50 keV energy range arises from the same cooling flow as the lower energy X-ray emission. Thus, the Swift/BAT flux can be used to trace the accretion rate through the boundary layer. The Swift/BAT light curve indicates a low-accretion-rate period during a large fraction of 2019, when the flux reached a minimum of 1.7×10⁻⁵ cts cm−2 s−1. For comparison, during the maximum in 2011−2013, the BAT flux reached 1.8×10⁻³ cts cm−2 s−1 and outside the maximum or the minimum, it has an average flux of 9×10⁻⁴ cts cm−2 s−1.
4. Discussion and conclusions
We have witnessed a significant decrease in the flow of matter through the accretion disk in a symbiotic star and the subsequent recovery. This conclusion is supported by our observational data as follows:
-
The significant decrease in hard X-ray flux in the Swift/BAT band during most of the year 2019 in addition to the softness of the X-ray spectrum obtained with XMM-Newton indicates that accretion through the optically thin portion of the boundary layer decreased by two orders of magnitude, down to 3.2 ± 0.06 × 10⁻¹¹ M⊙ yr−1 (d/2.52 kpc)2, and the strong absorption of X-rays usually observed during high-accretion-rate periods decreased as well.
-
The conclusion regarding the decrease in the accretion rate is also supported by our analysis of the rapid variability in the optical light curves. In 2019, the short-term U, B, V, UVW2, and TESS optical light curves did not show the rapid variability typically observed during high-accretion, optically bright states. It is noteworthy that a significant decrease in Ṁ manifests itself only as a modest overall dimming in optical – by approximately 1 mag (see Fig. 2); it was enough, however, to cause a significant decrease in the flickering amplitude. Given that flickering is a hallmark of an accretion disk, its low amplitude indicates that accretion significantly decreased in 2019 and recovered afterward. Decreases in the optical flickering amplitude have been observed in other symbiotics (e.g., MWC 560 Zamanov et al. 2011, CH Cyg Sokoloski & Kenyon 2003a). Low (respectively high) X-ray states have been associated with low (respectively high) optical line flux states in SU Lyn (Mukai et al. 2016; Lopes de Oliveira et al. 2018; Iłkiewicz et al. 2022). We are not aware of other observations of symbiotic stars that have revealed such extreme multiwavelength changes associated with a change in optical flickering.
-
Observed changes in UV flickering also support our conclusion about reduced accretion onto the WD. Non-burning symbiotic stars with hard X-ray emission and X-ray luminosities of about 1032 ergs s−1 (in the 0.3−10 keV range) show detectable flickering in the Swift/UVOT photometric data, whereas those with lower X-ray luminosities have lower UV flickering amplitudes (Luna et al. 2013). During the low state of RT Cru reported here, the same trend is clear.
-
The decrease in Ṁ also had significant effects on the optical spectra. The usually strong optical emission lines, such as Hα and He I, were absent in the spectra taken at the beginning of 2019, indicating the luminosity of the ionizing source decreased as a consequence of the lower accretion rate.
The detection of flickering within the TESS bandpass (6000−10 000 Å) indicates that the accretion disk contributes significantly to the spectral energy distribution above 6000 Å (see Fig. 4). This might be the case in other symbiotics observed with TESS (results of TESS observations of symbiotics will be presented in a forthcoming article).
The transition in and out of the low state, observed at all wavelengths, took about 2−3 yr. Other symbiotics with similarly massive WDs but shorter orbital periods, such as T CrB, have longer-lasting high and low states. The red giant in T CrB is thought to fill its Roche lobe (Kraft 1958). Thus, the accretion disk is probably usually present, and the brightening episodes, such as the one reported in Luna et al. (2018b, 2020), are most likely the result of disk instabilities such as those in dwarf novae. In long-orbital-period symbiotics where accretion proceeds through wind-capture, as we suspect is the case in RT Cru and SU Lyn, just to mention a few examples, multiple factors could control the accretion rate: (1) an eccentric orbit; (2) wind accretion leading to a transient disk (Hillman & Kashi 2021); (3) changes in the mass loss rate from the red giant donor (Hillman & Kashi 2021); (4) disruption of the inner disk after a collimated outflow is launched, as in the long-orbital-period symbiotic CH Cyg (Sokoloski & Kenyon 2003b); or (5) dwarf-nova-like disk instabilities (Duschl 1986).
Given the estimated mass of the WD in RT Cru of at least about 1.2 M⊙ (Luna & Sokoloski 2007), it might seem somewhat surprising that no nova-type outbursts have been recorded over the last century. However, theoretical models by Yaron et al. (2005) predict that, at a constant accretion rate of 10−8 M⊙ yr−1, a thermonuclear runaway would occur with a recurrence time of greater than 200 yr. At RT Cru’s optical maximum, the accretion rate reaches 10−8 M⊙ yr−1, but this phase tends to only last for about 3−4 yr. Around the time of the previous optical minimum, in 2007, the accretion rate was about 5.83×10⁻⁹ M⊙ yr−1 (d/2.52 kpc)2 (Luna et al. 2018a), and during the optical minimum reported here, the accretion rate dropped to as low as 3.2×10⁻¹¹ M⊙ yr−1 (d/2.52 kpc)2. Thus, a scenario in which the WD in RT Cru primarily accumulates material during high states and takes more than a century to accumulate the mass needed to trigger a nova eruption is consistent with observations of high states that only occur every decade or so.
See https://www.swift.ac.uk/analysis/xrt/optical_loading.php for the optical loading thresholds in Swift/XRT.
Based on data obtained at Complejo Astronómico El Leoncito, operated under agreement between the Consejo Nacional de Investigaciones Científicas y Técnicas de la República Argentina and the National Universities of La Plata, Córdoba and San Juan.
Acknowledgments
We acknowledge the anonymous referee whose comments helped to improve this manuscript. We acknowledge with thanks the variable star observations from the AAVSO International Database contributed by observers worldwide and used in this research. We thank Dr. Luis Mammana for his help during the HSH observing run at CASLEO. We acknowledge the use of public data from the Swift data archive as well as the frequent ToO observations performed upon our request. We thank Dr. N. Schartel for the approval of our DDT request to observe RT Cru with XMM-Newton. Based on observations obtained at the Swope and du Pont, telescopes of the Las Campanas Observatory (through programs CN2012B-5, CN2013A-114, CN2019A-64). Based on observations obtained at the international Gemini Observatory (through the poor-weather program GS-2016B-Q-94), a program of NSF’s NOIRLab, which is managed by the Association of Universities for Research in Astronomy (AURA) under a cooperative agreement with the National Science Foundation. on behalf of the Gemini Observatory partnership: the National Science Foundation (United States), National Research Council (Canada), Agencia Nacional de Investigación y Desarrollo (Chile), Ministério de Ciencia, Tecnología e Innovación (Argentina), Ministério da Ciência, Tecnologia, Inovações e Comunicações (Brazil), and Korea Astronomy and Space Science Institute (Republic of Korea). Based on data obtained at Complejo Astronómico El Leoncito (HSH-2021A1-01), operated under agreement between the Consejo Nacional de Investigaciones Científicas y Técnicas de la República Argentina and the National Universities of La Plata, Córdoba and San Juan. Based in part on data obtained with the Chiron Spectrograph, operated by the SMARTS partnership. AJP is a Consejo Nacional de Investigaciones Científicas y Tócnicas fellow. G.J.M.L. and N.E.N. are members of the CIC-CONICET (Argentina) and acknowledge support from grant ANPCYT-PICT 0901/2017. N.P.M.K. acknowledges support from the UK Space Agency. J.L.S. acknowledges support from SAO DD0-21118X and NASA award 80NSSC21K0715. R.A. acknowledges financial support from DIDULS PR#1953853 by Universidad de La Serena. F.M.W. acknowledges support from NSF grant AST-1614113. R.L.O. acknowledges financial support from the Brazilian institution CNPq (PQ-312705/2020-4). Y.N. acknowledges support by Bulgarian National Science Fund – project KΠ-06-M58/1 and project KΠ-06-H28/2. M.J.A. acknowledges the financial support of DIDULS/ULS, through the project PAAI2021.
References
- Angeloni, R., Di Mille, F., Ferreira Lopes, C. E., & Masetti, N. 2012, ApJ, 756, L21 [NASA ADS] [CrossRef] [Google Scholar]
- Angeloni, R., Di Mille, F., Lopes, C. E. F., & Masetti, N. 2013, in Feeding Compact Objects: Accretion on All Scales, eds. C. M. Zhang, T. Belloni, M. Méndez, & S. N. Zhang, 290, 179 [NASA ADS] [Google Scholar]
- Bailer-Jones, C. A. L., Rybizki, J., Fouesneau, M., Demleitner, M., & Andrae, R. 2021, VizieR Online Data Catalog: I/352 [Google Scholar]
- Brasseur, C. E., Phillip, C., Fleming, S. W., Mullally, S. E., & White, R. L. 2019, Astrophysics Source Code Library [record ascl:1905.007] [Google Scholar]
- Breeveld, A. A., Landsman, W., Holland, S. T., et al. 2011, in Gamma Ray Bursts 2010, eds. J. E. McEnery, J. L. Racusin, & N. Gehrels, AIP Conf. Ser., 1358, 373 [Google Scholar]
- Capitanio, L., Lallement, R., Vergely, J. L., Elyajouri, M., & Monreal-Ibero, A. 2017, A&A, 606, A65 [NASA ADS] [CrossRef] [EDP Sciences] [Google Scholar]
- Cardelli, J. A., Clayton, G. C., & Mathis, J. S. 1989, ApJ, 345, 245 [Google Scholar]
- Chernyakova, M., Courvoisier, T. J.-L., Rodriguez, J., & Lutovinov, A. 2005, ATel, 519, 1 [NASA ADS] [Google Scholar]
- Cieslinski, D., Elizalde, F., & Steiner, J. E. 1994, A&AS, 106, 243 [NASA ADS] [Google Scholar]
- Collins, K. A., Kielkopf, J. F., Stassun, K. G., & Hessman, F. V. 2017, AJ, 153, 77 [Google Scholar]
- Danehkar, A., Karovska, M., Drake, J. J., & Kashyap, V. L. 2021, MNRAS, 500, 4801 [Google Scholar]
- Deeg, H. J. 2013, Astrophysics Source Code Library [record ascl:1309.002] [Google Scholar]
- Deeg, H. J., & Doyle, L. R. 2001, in Third Workshop on Photometry, eds. W. J. Borucki, & L. E. Lasher, 85 [Google Scholar]
- Ducci, L., Doroshenko, V., Suleimanov, V., et al. 2016, A&A, 592, A58 [NASA ADS] [CrossRef] [EDP Sciences] [Google Scholar]
- Duschl, W. J. 1986, A&A, 163, 61 [NASA ADS] [Google Scholar]
- Henden, A. A., Levine, S., Terrell, D., & Welch, D. L. 2015, Am. Astron. Soc. Meet. Abstr., 225, 336.16 [Google Scholar]
- Hillman, Y., & Kashi, A. 2021, MNRAS, 501, 201 [Google Scholar]
- Honeycutt, R. K. 1992, PASP, 104, 435 [NASA ADS] [CrossRef] [Google Scholar]
- Iłkiewicz, K., Mikołajewska, J., Scaringi, S., et al. 2022, MNRAS, 510, 2707 [CrossRef] [Google Scholar]
- Kesseli, A. Y., West, A. A., Veyette, M., et al. 2017, ApJS, 230, 16 [NASA ADS] [CrossRef] [Google Scholar]
- Kraft, R. P. 1958, ApJ, 127, 625 [NASA ADS] [CrossRef] [Google Scholar]
- Krimm, H. A., Holland, S. T., Corbet, R. H. D., et al. 2013, ApJS, 209, 14 [NASA ADS] [CrossRef] [Google Scholar]
- Kuin, P. 2014, Astrophysics Source Code Library [record ascl:1410.004] [Google Scholar]
- Kuin, N. P. M., Landsman, W., Breeveld, A. A., et al. 2015, MNRAS, 449, 2514 [NASA ADS] [CrossRef] [Google Scholar]
- Lopes de Oliveira, R., Sokoloski, J. L., Luna, G. J. M., Mukai, K., & Nelson, T. 2018, ApJ, 864, 46 [NASA ADS] [CrossRef] [Google Scholar]
- Luna, G. J. M., & Sokoloski, J. L. 2007, ApJ, 671, 741 [NASA ADS] [CrossRef] [Google Scholar]
- Luna, G. J. M., Sokoloski, J. L., Mukai, K., & Nelson, T. 2013, A&A, 559, A6 [NASA ADS] [CrossRef] [EDP Sciences] [Google Scholar]
- Luna, G. J. M., Mukai, K., Sokoloski, J. L., et al. 2018a, A&A, 616, A53 [NASA ADS] [CrossRef] [EDP Sciences] [Google Scholar]
- Luna, G. J. M., Mukai, K., Sokoloski, J. L., et al. 2018b, A&A, 619, A61 [NASA ADS] [CrossRef] [EDP Sciences] [Google Scholar]
- Luna, G. J. M., Sokoloski, J. L., Mukai, K., et al. 2020, ApJ, 902, L14 [NASA ADS] [CrossRef] [Google Scholar]
- Milone, E. F., & Pel, J. W. 2011, in Astronomical Photometry: Past, Present, and Future, eds. E. F. F. Milone, & C. Sterken, Astrophys. Space Sci. Lib., 373, 33 [NASA ADS] [CrossRef] [Google Scholar]
- Muerset, U., Wolff, B., & Jordan, S. 1997, A&A, 319, 201 [Google Scholar]
- Mukai, K., Luna, G. J. M., Cusumano, G., et al. 2016, MNRAS, 461, L1 [NASA ADS] [CrossRef] [Google Scholar]
- Pojmanski, G. 2002, Acta Astron., 52, 397 [NASA ADS] [Google Scholar]
- Poole, T. S., Breeveld, A. A., Page, M. J., et al. 2008, MNRAS, 383, 627 [Google Scholar]
- Ricker, G. R., Winn, J. N., Vanderspek, R., et al. 2014, in Space Telescopes and Instrumentation 2014: Optical, Infrared, and Millimeter Wave, eds. J. Oschmann, M. Jacobus, M. Clampin, G. G. Fazio, & H. A. MacEwen, SPIE Conf. Ser., 9143, 914320 [Google Scholar]
- Savitzky, A., & Golay, M. J. E. 1964, Anal. Chem., 36, 1627 [Google Scholar]
- Schirmer, M. 2013, ApJS, 209, 21 [NASA ADS] [CrossRef] [Google Scholar]
- Schmid, H. M. 1994, A&A, 284, 156 [NASA ADS] [Google Scholar]
- Schulz, M., & Mudelsee, M. 2002, Comput. Geosci., 28, 421 [NASA ADS] [CrossRef] [Google Scholar]
- Sguera, V., Drave, S. P., Sidoli, L., et al. 2012, ATel, 3887, 1 [NASA ADS] [Google Scholar]
- Sguera, V., Bird, A. J., & Sidoli, L. 2015, ATel, 8448, 1 [NASA ADS] [Google Scholar]
- Sokoloski, J. L., & Kenyon, S. J. 2003a, ApJ, 584, 1027 [NASA ADS] [CrossRef] [Google Scholar]
- Sokoloski, J. L., & Kenyon, S. J. 2003b, ApJ, 584, 1021 [NASA ADS] [CrossRef] [Google Scholar]
- Sokoloski, J. L., Bildsten, L., & Ho, W. C. G. 2001, MNRAS, 326, 553 [NASA ADS] [CrossRef] [Google Scholar]
- Straizys, V., & Kuriliene, G. 1981, Ap&SS, 80, 353 [CrossRef] [Google Scholar]
- Tokovinin, A., Fischer, D. A., Bonati, M., et al. 2013, PASP, 125, 1336 [NASA ADS] [CrossRef] [Google Scholar]
- van Dokkum, P. G. 2001, PASP, 113, 1420 [Google Scholar]
- Yaron, O., Prialnik, D., Shara, M. M., & Kovetz, A. 2005, ApJ, 623, 398 [Google Scholar]
- Zamanov, R., Boeva, S., Latev, G., et al. 2011, Inf. Bull. Var. Stars, 5995, 1 [NASA ADS] [Google Scholar]
- Zhong, J., Lépine, S., Li, J., et al. 2015, RAA, 15, 1154 [NASA ADS] [Google Scholar]
Appendix A: Optical spectroscopic and photometric series observing log
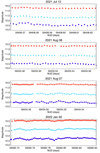 |
Fig. A.1. Light curves of our short-term optical monitoring of RT Cru, obtained with the HSH telescope. R (red stars), V (light blue triangles), and B (blue circles) magnitudes are displayed, and error bars are smaller than the symbols. Cadence and observing lengths are listed in Table A.2. |
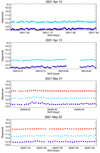 |
Fig. A.1. continued. |
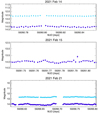 |
Fig. A.1. continued. |
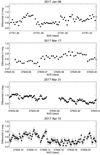 |
Fig. A.2. Light curves of our short-term optical monitoring of RT Cru, obtained with the Gemini-South telescope (see Table A.2). |
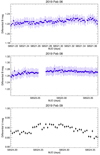 |
Fig. A.3. Light curves of our short-term optical monitoring of RT Cru, obtained with the du Pont telescope. Blue circles show B-band differential magnitudes and black circles U-band magnitudes (see Table A.2). |
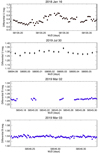 |
Fig. A.4. Light curves of our short-term optical monitoring of RT Cru, obtained with the Swope telescope. Blue circles show B-band differential magnitudes and black circles U-band magnitudes (see Table A.2). |
Log of optical SMARTS/Chiron spectra.
Flickering measurements in the V, B, and U band. We show the date when the light curve was taken in MJD and calendar date; the amplitude calculated as max-min (see Sect. 3.2); the mean magnitude, band and the source of data. TESS magnitudes were calibrated against contemporaneous I AAVSO observations. The rows are sorted by filter. Data taken during the low-accretion-rate period are highlighted in bold-face. In comparison with other dates, the flickering amplitude during 2019 significantly decreased.
All Tables
Flickering measurements in the V, B, and U band. We show the date when the light curve was taken in MJD and calendar date; the amplitude calculated as max-min (see Sect. 3.2); the mean magnitude, band and the source of data. TESS magnitudes were calibrated against contemporaneous I AAVSO observations. The rows are sorted by filter. Data taken during the low-accretion-rate period are highlighted in bold-face. In comparison with other dates, the flickering amplitude during 2019 significantly decreased.
All Figures
|
Fig. 1. Schematic view of the data sets used in this study. Filled black squares highlight the years of the observation obtained from a given instrument, database, or literature. Blue squares mark the year of the optical spectroscopic data. |
| In the text | |
|
Fig. 2. Long-term optical to hard-X-ray variability of RT Cru. Panel a: RT Cru optical B- and V-band light curves with measurements from Cieslinski et al. (1994, black plus signs), ASAS (gray dots), AAVSO (black crosses for the V band, red circles for the B band), and ASAS-SN (open circles). Panel b: B − V curve from AAVSO data. Panel c: Swift/UVOT UVM2 (open circles) and UVW2 (blue dots) light curves. Panel d: Swift/BAT 14−50 keV measurements (light blue dots) with 100-day bins (with 1σ error bars). The maximum in the BAT light curve around 2011−2013 is due to an increase in the accretion rate, which did not increase enough to reach the level where the boundary layer becomes optically thick and a super-soft X-ray component arises (see Luna et al. 2018b). Between late 2019 and late 2020, RT Cru was not detected by Swift/BAT in 100-days bins. Panel e: Swift/XRT 0.3−10 keV count rate in log scale to highlight the fade in flux in 2019. Panel f: Swift/XRT softness ratio. Panel g: Hα (blue dots) and adjacent continuum (yellow dots) flux evolution. Panel h: He I 6678 Å (red dots) and adjacent continuum (black dots) flux evolution. Starting around mid-2017, the B − V color became redder for a few years (panel b), during which time the hard X-ray flux dipped (panel d). The UV and soft X-ray emission (panels c and e) also dipped at around that same time. |
| In the text | |
|
Fig. 3. Swift/XRT count rate light curve in the 0.3−10 keV energy range. The colored boxes show the observations that were combined to obtain the spectra analyzed in Sect. 2.2.2. |
| In the text | |
|
Fig. 4. TESS light curves of the observations obtained during Sector 11 in 2019 with a 30 m cadence (top row), and the light curves from observations obtained during Sectors 37 and 38 in 2021 with a 10 m cadence (bottom row). The vertical dashed line in the lower left-hand plot marks the separation between Sectors 37 and 38. In the right-hand panel, each portion of the light curve of each sector has a SG filter (red line in the left panels) subtracted from it to enable the study of short-term, flickering-type variability. Variability on timescales shorter than 10 min (in Sectors 37 and 38) or 30 min (in Sector 11) cannot be detected. In addition, the measurement errors (0.001 mag) are larger than the observed dispersion; no short-term variability can be detected. |
| In the text | |
|
Fig. 5. SMARTS optical spectrum of RT Cru obtained on 2019 March 17 (black line) and the UVOT spectra obtained on 2019 January 15 (green line) and 2020 August 12 (gray line), corrected for the interstellar extinction using E(B − V) = 0.53. The blue line is a template spectrum of an M6III giant from Zhong et al. (2015). |
| In the text | |
|
Fig. 6. Selected optical spectra taken with the SMARTS/Chiron telescope from 2019 March through 2022 March (see the complete list of spectra in Table A.1). Since 2019 March, Hα has been detected in emission and its flux has increased monotonically (see panel g in Fig. 2). Other lines, such as N[II] 6584 Å, were also missing in 2019 and reappeared in emission afterward. |
| In the text | |
|
Fig. 7. Search for periodicities in the TESS light curves. Top: TESS light curve of the second half of Sector 38. Bottom: Lomb-Scargle power spectrum (green line) with red noise model (black line) and detection levels at 3σ (orange). |
| In the text | |
|
Fig. 8. UVW2 Swift/UVOT and XMM-Newton/OM light curves with 120 s bins. The UVOT light curves from dates outside the low-flux optical state (years 2016 and 2021; top and bottom panels) show strong variability, whereas the light curve from the 2019 XMM-Newton/OM observation (middle panel) shows a much fainter source with no significant variability. |
| In the text | |
|
Fig. 9. X-ray spectral evolution between 2005 and 2022, as revealed by XMM-Newton and Swift. The solid curves in the top portion of each panel are the best-fit models, while dotted lines show the contribution of each spectral component in the cases where more than one spectral component was needed to model the spectrum (see Sect. 3.3). Each panel lists the accretion rate through the optically thin boundary layer (Ṁ, in units of 10−9 M⊙ yr−1). The resulting fit parameters are listed in Table 1. The spectra taken in 2019 with Swift and XMM-Newton clearly show a decrease both in absorption and accretion rate. |
| In the text | |
|
Fig. A.1. Light curves of our short-term optical monitoring of RT Cru, obtained with the HSH telescope. R (red stars), V (light blue triangles), and B (blue circles) magnitudes are displayed, and error bars are smaller than the symbols. Cadence and observing lengths are listed in Table A.2. |
| In the text | |
|
Fig. A.1. continued. |
| In the text | |
|
Fig. A.1. continued. |
| In the text | |
|
Fig. A.2. Light curves of our short-term optical monitoring of RT Cru, obtained with the Gemini-South telescope (see Table A.2). |
| In the text | |
|
Fig. A.3. Light curves of our short-term optical monitoring of RT Cru, obtained with the du Pont telescope. Blue circles show B-band differential magnitudes and black circles U-band magnitudes (see Table A.2). |
| In the text | |
|
Fig. A.4. Light curves of our short-term optical monitoring of RT Cru, obtained with the Swope telescope. Blue circles show B-band differential magnitudes and black circles U-band magnitudes (see Table A.2). |
| In the text | |
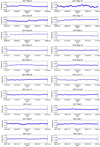 |
Fig. A.5. V-band light curves of RT Cru, obtained from the AAVSO database (see Table A.2). |
| In the text | |
Current usage metrics show cumulative count of Article Views (full-text article views including HTML views, PDF and ePub downloads, according to the available data) and Abstracts Views on Vision4Press platform.
Data correspond to usage on the plateform after 2015. The current usage metrics is available 48-96 hours after online publication and is updated daily on week days.
Initial download of the metrics may take a while.