Fig. 2.
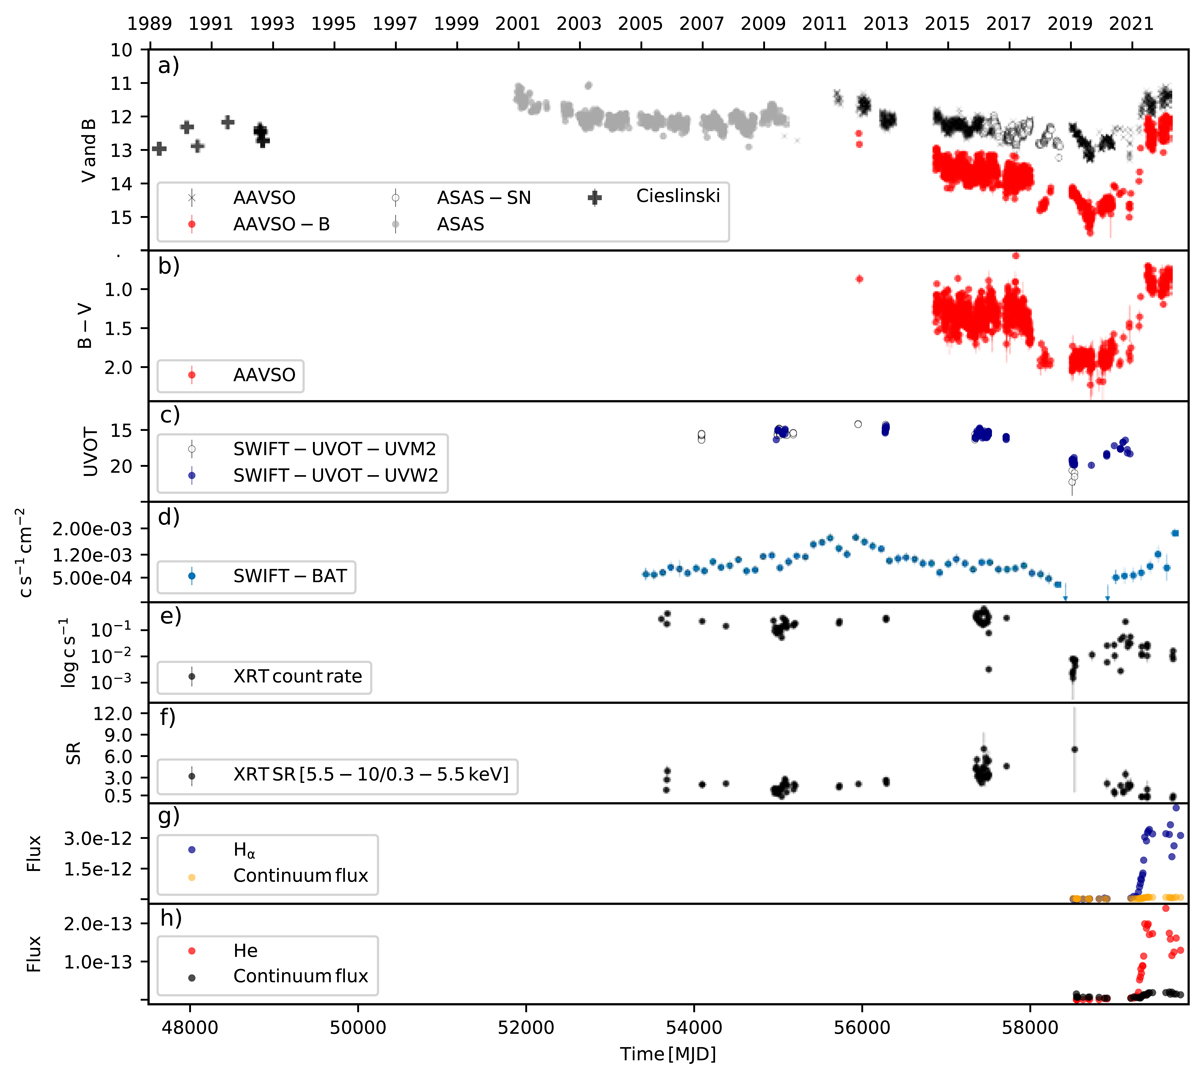
Download original image
Long-term optical to hard-X-ray variability of RT Cru. Panel a: RT Cru optical B- and V-band light curves with measurements from Cieslinski et al. (1994, black plus signs), ASAS (gray dots), AAVSO (black crosses for the V band, red circles for the B band), and ASAS-SN (open circles). Panel b: B − V curve from AAVSO data. Panel c: Swift/UVOT UVM2 (open circles) and UVW2 (blue dots) light curves. Panel d: Swift/BAT 14−50 keV measurements (light blue dots) with 100-day bins (with 1σ error bars). The maximum in the BAT light curve around 2011−2013 is due to an increase in the accretion rate, which did not increase enough to reach the level where the boundary layer becomes optically thick and a super-soft X-ray component arises (see Luna et al. 2018b). Between late 2019 and late 2020, RT Cru was not detected by Swift/BAT in 100-days bins. Panel e: Swift/XRT 0.3−10 keV count rate in log scale to highlight the fade in flux in 2019. Panel f: Swift/XRT softness ratio. Panel g: Hα (blue dots) and adjacent continuum (yellow dots) flux evolution. Panel h: He I 6678 Å (red dots) and adjacent continuum (black dots) flux evolution. Starting around mid-2017, the B − V color became redder for a few years (panel b), during which time the hard X-ray flux dipped (panel d). The UV and soft X-ray emission (panels c and e) also dipped at around that same time.
Current usage metrics show cumulative count of Article Views (full-text article views including HTML views, PDF and ePub downloads, according to the available data) and Abstracts Views on Vision4Press platform.
Data correspond to usage on the plateform after 2015. The current usage metrics is available 48-96 hours after online publication and is updated daily on week days.
Initial download of the metrics may take a while.