| Issue |
A&A
Volume 689, September 2024
|
|
|---|---|---|
| Article Number | A86 | |
| Number of page(s) | 18 | |
| Section | Stellar structure and evolution | |
| DOI | https://doi.org/10.1051/0004-6361/202449913 | |
| Published online | 03 September 2024 | |
Symbiotic stars in X-rays
IV. XMM-Newton, Swift, and TESS observations
1
CONICET-Universidad de Buenos Aires, Instituto de Astronomía y Física del Espacio (IAFE), Av. Inte. Güiraldes 2620, C1428ZAA Buenos Aires, Argentina
2
Universidad Nacional de San Juan, Facultad de Ciencias Exactas, Físicas y Naturales, Av. Ignacio de la Roza 590 (O), Complejo Universitario “Islas Malvinas”, Rivadavia, J5402DCS San Juan, Argentina
3
Universidade Estadual Paulista “Júlio de Mesquita Filho”, UNESP, Campus of Guaratinguetá, Av. Dr. Ariberto Pereira da Cunha, 333 – Pedregulho, Guaratinguetá, SP 12516-410, Brazil
4
CONICET-Universidad Nacional de Hurlingham, Av. Gdor. Vergara 2222, Villa Tesei, Buenos Aires, Argentina
5
CRESST and X-ray Astrophysics Laboratory, NASA Goddard Space Flight Center, Greenbelt, MD 20771, USA
6
Department of Physics, University of Maryland Baltimore County, 1000 Hilltop Circle, Baltimore, MD 21250, USA
7
IP&D, Universidade do Vale do Paraíba, 12244-000 São José dos Campos, SP, Brazil
8
Columbia Astrophysics Lab., 550 W120th St., 1027 Pupin Hall, MC 5247 Columbia University, New York, NC 10027, USA
9
Department of Physics & Astronomy, Stony Brook University, Stony Brook, NY 11794-3800, USA
Received:
8
March
2024
Accepted:
29
April
2024
Abstract
White dwarf symbiotic binaries are detected in X-rays with luminosities in the range of 1030–1034 ergs s−1. Their X-ray emission arises either from the accretion disk boundary layer, from a region where the winds from both components collide, or from nuclear burning on the surface of the white dwarf (WD). In our continuous effort to identify X-ray-emitting symbiotic stars, we studied four systems using observations from the Neil Gehrels Swift Observatory and XMM-Newton satellites in X-rays and from Transiting Exoplanet Survey Satellite (TESS) in the optical. The X-ray spectra were fit with absorbed optically thin thermal plasma models that are either single- or multitemperature with kT < 8 keV for all targets. Based on the characteristics of their X-ray spectra, we classified BD Cam as possible β-type, V1261 Ori and CD −27 8661 as δ-type, and confirmed NQ Gem as β/δ-type. The δ-type X-ray emission most likely arises from the boundary layer of the accretion disk, while in the case of BD Cam, its mostly soft emission originates from shocks, possibly between the red giant and WD and disk winds. In general, we find that the observed X-ray emission is powered by accretion at a low accretion rate of about 10−11 M⊙ yr−1. The low ratio of X-ray to optical luminosities, however indicates that the accretion-disk boundary layer is mostly optically thick and tends to emit in the far or extreme UV. The detection of flickering in optical data provides evidence of the existence of an accretion disk.
Key words: binaries: symbiotic / stars: individual: BD Cam / stars: individual: V1261 Ori / stars: individual: NQ Gem / stars: individual: CD −27 8661 / white dwarfs
Corresponding author; This email address is being protected from spambots. You need JavaScript enabled to view it. .
© The Authors 2024
 Open Access article, published by EDP Sciences, under the terms of the Creative Commons Attribution License (https://creativecommons.org/licenses/by/4.0), which permits unrestricted use, distribution, and reproduction in any medium, provided the original work is properly cited.
This article is published in open access under the Subscribe to Open model. This email address is being protected from spambots. You need JavaScript enabled to view it. to support open access publication.
1. Introduction
Symbiotic stars are interacting binaries consisting of a late-type giant and a compact object, generally a white dwarf (WD; e.g., Kenyon 2009). These systems exhibit blended characteristics of both stellar components and, in some cases, an accretion disk and an ionized nebula. Typically, their optical spectra show emission lines originating from the nebula (e.g., H I, He II, and [OIII] lines), TiO absorption features from the cool giant photosphere, and UV and blue continuum radiated by the hot component (e.g., Kenyon et al. 1986).
Some symbiotic systems present an abundance anomaly due to s-process element enhancement, known as the barium-star syndrome (e.g., BD-21 3873, AG Dra, UKS-Ce1, BD Cam, and V1261 Ori; see Smith et al. 1996, 1997). During evolution on the asymptotic giant branch (AGB), the progenitor of the WD loses its carbon and heavy element-rich envelope through a strong stellar wind, and part of the material is accreted by the less evolved companion, leading to future red giants, which in some cases contain technetium (Tc; Jorissen et al. 1996).
The X-ray emission in symbiotic stars originates from nuclear burning, colliding winds, accretion, or a combination of those (see Table 2 in Mukai 2017). In α-type X-ray emission systems, the quasi-steady thermonuclear burning on the surface of the accreting WD is responsible for the supersoft emission (kT < 0.4 keV); the X-ray emission in β-type (kT ≤ 2.4 keV) could be produced by colliding winds from the two stars; γ-type systems are symbiotics containing neutron stars emitting hard X-rays with energies of kT > 2.4 keV; and in δ-type systems the X-ray emission arises from the accretion disk boundary layer, a region between the accretion disk and the WD, with kT of 5 to 50 keV, depending on the WD mass. Finally, in β/δ-type, the soft component originates from a colliding-wind region, while the hard flux is produced in the boundary layer (e.g., Muerset et al. 1997; Luna et al. 2013). In these WD symbiotic systems, the thermal X-ray emission is optically thin or blackbody-type; in the symbiotic systems where the compact object is thought to be a neutron star, the X-ray emission is due to Comptonization of X-ray photons. There are 56 confirmed and classified symbiotic stars with X-ray emission, including extragalactic sources (see list in Table A.1). More specifically, there are 8 α-type, 21 β-type, 7 γ-type, 11 δ-type, and 9 β/δ-type (e.g., Luna et al. 2013; Nuñez et al. 2014, 2016; Merc et al. 2019a). A concatenated list of symbiotic binaries is given in “The New Online Database of Symbiotic Variables” catalog1 (see Merc et al. 2019b; Akras et al. 2019).
The symbiotic systems with the longest orbital periods contain WDs with periods ranging from hundreds of days to a few years, and semi-major axes of a few to tens of astronomical units (AU), and accretion rates of 10−11–10−7 M⊙ yr−1, with the average rate being greater than that of the cataclysmic variables (CVs). The accretion can occur via Roche-lobe overflow or via Bondi–Hoyle capture of the red giant’s wind (e.g., Bondi & Hoyle 1944; Iben & Tutukov 1996). Some symbiotic systems with Mira secondary stars show evidence of wind Roche-lobe overflow mass transfer, which is a combination of standard Roche-lobe overflow and Bondi–Hoyle accretion (e.g., Mohamed & Podsiadlowski 2007; Sokoloski & Bildsten 2010).
In CVs, stochastic broad-band variability on timescales of minutes to hours (also referred to as flickering) is commonly observed in the optical band and with increasing amplitude toward the ultraviolet (UV). The origin of flickering is not well understood, but several scenarios have been proposed in order to explain it, including unstable mass accretion onto the WD leading to flickering on a disk hotspot, a turbulent accretion disk, magnetic discharges in an accretion disk, and boundary layer instabilities leading to unsteady accretion (Bruch 1992). Optical flickering has been detected in symbiotic systems with hard X-ray emission and highly absorbed components, whereas in other symbiotic stars, where the radiation from the red giant and the surrounding wind nebula overwhelms radiation from the disk (e.g., Sokoloski et al. 2001; Luna & Sokoloski 2007; Luna et al. 2013), the detection of flickering has so far been elusive. The symbiotic systems where flickering with amplitudes of greater than 0.1 mag has been detected are: V694 Mon, Z And, V2116 Oph, CH Cyg, RT Cru, o Cet, V407 Cyg, V648 Car, EF Aql, ZZ CMi, and SU Lyn (e.g., Zamanov et al. 2021, 2023). V1044 Cen, ASAS J190559−2109.4, ASAS J152058−4519.7, Gaia DR2 5917238398632196736, and Gaia DR2 6043925532812301184 were detected by Lucy (2021) using B band time series from the SkyMapper Southern Sky Survey. Recently, Merc et al. (2024) reported a further 20 systems that display flickering using Transiting Exoplanet Survey Satellite (TESS) data; in 13 of them, flickering was detected for first time. The presence of flickering and its amplitude can be seen as an indicator of the presence of an accretion disk.
The study of symbiotic stars is of special significance as they might be candidates for SN Ia progenitors within the single degenerate scenario (Kenyon et al. 1993). Also, those systems allow the study of stellar evolution, the mass-transfer accretion processes, stellar wind jets, dust formation, and thermonuclear outbursts (e.g., Sokoloski 2003). In the present paper, we analyze the X-ray emission and fast optical photometry of a sample of four symbiotic stars; two of them, BD Cam and V1261 Ori, display the barium-syndrome. The paper is organized as follows: Section 2 presents the X-ray and optical observations and their data-reduction description. In Section 3 we discuss our X-ray analysis. Section 4 summarizes our search for flickering in optical data. The results that we derive from optical and X-ray data for each target are described in Section 5. Finally, we present a discussion and conclusions in Sections 6 and 7, respectively.
2. Observations and data reductions
We present observations of our symbiotic stars BD Cam, V1261 Ori, NQ Gem, and CD −27 8661 obtained with XMM-Newton, Swift, and TESS. Details of each observation analyzed here are presented in Table 1, where objects are sorted by their right ascension. In Figure 1, we show the times of the XMM-Newton, Swift, and TESS observations within the historical optical light curves from the American Association of Variable Star Observers (AAVSO2), the All-Sky Automated Survey for Supernovae (ASAS-SN; Shappee et al. 2014; Kochanek et al. 2017), and the Harvard Digital Access to a Sky-Century at Harvard project (DASCH3; Grindlay et al. 2009). The observations with XMM-Newton, Swift, and TESS were obtained during normal flux states for all targets.
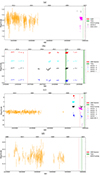 |
Fig. 1. Historical optical photometric observations from AAVSO, ASAS-SN, and DASCH of symbiotic systems: (a) BD Cam, (b) V1261 Ori, (c) NQ Gem, and (d) CD −27 8661. The AAVSO-UBVRI data are on the Vega system and ASAS-SN-V and DASCH-gmag data are on the AB system. The red and green lines indicate when the X-ray and TESS observations, respectively, were made. Our search does not provide optical measurements during the times that BD Cam and CD −27 8661 were observed in X-rays and with TESS; we therefore assume that all observations analyzed here were taken during normal brightness states of the sources. |
Log of observations.
We used PyXspec –a Python interface to the XSPEC version 12.12.0 spectral-fitting software (Arnaud 2016; Gordon & Arnaud 2021)– for all X-ray spectral analyses. We also used Bayesian statistical methods in order to improve the parameters estimation of our best-fit models (see Section 3).
2.1. XMM-Newton
XMM-Newton observed three symbiotic stars of our sample –namely V1261 Ori, NQ Gem, and CD −27 8661– with the European Photon Imaging Camera (EPIC) pn and MOS instruments as well as with the Reflection Grating Spectrograph (RGS) and Optical Monitor (OM; Strüder et al. 2001; Turner et al. 2001; den Herder et al. 2001; Mason et al. 2001); see Table 1. The EPIC cameras were operated in full frame mode with the thick filter; except for CD −27 8661 which was observed with the medium filter.
All XMM-Newton data were reduced using SAS (v20.0.0); the event files were obtained with emproc and epproc tools. The event files were filtered for flaring particle background by retaining intervals when the count rates were ≤0.35 c s−1 for EPIC-MOS and ≤0.4 c s−1 for EPIC-pn4. The spectra and light curves were extracted from circular regions centered on the SIMBAD coordinates of our targets with radii of 20″ (400 pixels). The background spectra were extracted from a source-free region on the CCD where our targets were detected. The response matrices were created using the arfgen and rmfgen tools.
The number of counts detected with the RGS were insufficient to allow us to include them in the spectral or timing analysis. We also obtained simultaneous optical fast photometry from OM using the UVW1 (λmax = 2675 Å) and the UVM2 (λmax = 2205 Å) filters for all objects observed by XMM-Newton. These observations with the XMM-Newton OM were not affected by the Jupiter Patch as they were taken earlier. We extracted the light curves with 120 s bin size using the SAS tool omfchain.
2.2. Swift
The Swift X-ray Telescope (XRT) observes a sample of symbiotic stars as part of a survey to search for X-ray emission under multicycle-approved fill-in programs started in Luna et al. (2013). The observations were usually performed for approximately ≤10 ks (not continuously observed) in XRT using photon counting (PC) mode. An additional observation of BD Cam was recently obtained as a target of opportunity (ToO) in windowed timing (WT) mode in order to minimize the effects of optical loading (Lima et al. 2022). Optical loading distorts the spatial and spectral distributions of the photons, producing spurious events in the CCD due to optical photons on board originating from a bright source. This effect does not depend on the exposure time of objects, but on the readout time of the detector. Swift/XRT-WT mode, with a readout time that is approximately 1500 times shorter than that of Swift/XRT-PC mode, has a lower probability of optical loading. The strength of optical loading also depends on the spectral type, being more intense for red sources5.
Some simple tests can be performed in order to identify optical loading in X-ray data. First, the image extracted from the event file can present a hole in the center of the source due to rejection in the center of the PSF; in other words, the count rates are underestimated. Second, X-ray photons are scattered to other grades around the source and spurious photons are recorded on the spectra. Third, we also can assume that the source exhibits the same spectral model for both the Swift observations and those from XMM-Newton, with only the difference being in the normalization levels; therefore, we can use the cross-calibration of both observatories –provided by the International Astronomical Consortium for High-Energy Calibration (IACHEC)6– to measure the count rate.
BD Cam and V1261 Ori were observed with Swift-XRT in PC mode during 3 pointings in 2012 April 13, 16, and 17 and 14 pointings distributed between 2001 April 1 and 2018 May 3. These objects are very bright in optical wavelengths (V = 5.11 mag and J = 1.31 mag for BD Cam and V = 8.57 mag and J = 3.09 mag for V1261 Ori), and therefore those spectral data are significantly distorted by optical loading and should not be considered for scientific analysis, which casts doubt on the results presented by Merc et al. (2019a).
The impact of optical loading in BD Cam and V1261 Ori spectra is evident in Figure 2, with sharp features in the region where thermal plasma emits lines of Fe XVI, Fe XX, O VII, O VIII, and so on. Typically, optical loading photons will dominate below ∼0.4 keV and will be dramatically reduced above 2 keV (Hare et al. 2021). However, the X-ray photons at higher energies are unlikely to be real, because they still suffer from grade migration, which induces an overall gain shift and loss of flux, implying that optical loading can affect the entire spectrum.
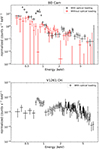 |
Fig. 2. Effects of optical loading in X-ray spectra. Top panel: Swift spectra of BD Cam strongly affected by optical loading in XRT-PC mode (black) and without the effect of (or with negligible) optical loading in XRT-WT mode (red). Bottom panel: Spectrum of V1261 0ri showing optical loading from Swift in XRT-PC mode. All data are prepared by the online Swift-XRT data products generator. |
For those Swift observations that were not affected by optical loading, we obtained the X-ray spectra from Swift using the online Swift-XRT data products generator7 provided by the UK Swift Science Data Centre at the University of Leicester (Evans et al. 2009). We extracted the X-ray spectra from the event files in 0−12 grades using the xselect and identified the centroid of the source by xrtcentroid from a circular radius of 20 pixels (≈47″). We used the Swift CALDB version 20211108. The background was extracted from an annular region with inner and outer radius of 50 and 60 pixels, respectively. For spectra, we extracted the response ancillary matrix with the xrtmkarf tool and the response matrix was provided by the Swift calibration team. In addition, the images from UVOT mode were also obtained in UVW1 (2600 Å), UVM2 (2246 Å), and UVW2 (1928 Å) filters.
2.3. TESS
The TESS covers a broad bandpass (600−1000 nm; Ricker et al. 2015). TESS observations are divided into sectors, each covering a strip in the sky of 24 × 90° and observed over 27 d and two spacecraft orbits with short gaps for data transmission to Earth. One of our targets, NQ Gem, does not have a pipeline-processed light curve in the archive; we thus extracted its light curve, as well as that of the other targets, by first downloading the TESS Full Frame Images (FFIs), and then extracted the light curves using the Python package lightkurve (Lightkurve Collaboration 2018). For each FFI, we generated 30 × 30 pixel Target Pixel File (TPF) cutouts centered on the designated target. Subsequently, the light curves were derived from these cutouts through the quantification of the flux within aperture masks encompassing the target, followed by the subtraction of the average sky flux acquired from a background mask. The identification of our target and other adjacent sources was performed using the Gaia catalog. BD Cam was saturated in the FFIs, and therefore its TESS data were not analyzed in this work (see Figure 2 in Lima et al. 2023).
3. X-ray analysis
We used the maximum likelihood C-statistic (cstat, Cash 1979) when modeling the spectra, which were grouped at one count per bin. The C-statistic is based on the Poisson likelihood, which is in agreement with the Poisson nature of X-ray data. The χ2 statistic is not appropriate for our sources given their low numbers of counts. In addition, the Bayesian statistic is a powerful approach for comparing between models and estimating the uncertainties of the model parameters (van Dyk et al. 2001). We therefore used the resulting parameters from the spectral modeling using the C-statistics as priors for the Bayesian analysis.
We used the Bayesian X-ray analysis (BXA) algorithm, which uses the UltraNest and fitting environment XSPEC (Buchner et al. 2014). The UltraNest8 package derives the posterior probability distributions and the Bayesian evidence with Monte Carlo algorithm MLFriends (Buchner 2021). We used the log-uniform prior distribution for scale variables such as normalization and NH, and uniform prior distribution over other free parameters. Table 2 lists the priors for each one of the free parameters used to fit the X-ray data using the Bayes approach. An alternative method of analyzing the quality of a model is the quantile–quantile (Q − Q) plots, which integrate observed counts against expected counts from the model (see Appendix A in Buchner 2021). The good fit should be a straight line (slope = 1). The goodness-of-fit was calculated with the Kolmogorov–Smirnov (K − S) statistic test, K − S = supE|observed(< E)−predicted(< E)|, which quantifies the difference between the cumulative distribution function and the empirical function of observed counts for each energy (E), with values closer to 0 providing better fits.
Priors minimum and maximum and the values found from BXA.
4. Variability
Flickering-like variability on timescales of minutes to hours was recently reported for 20 symbiotic stars by Merc et al. (2024) based on TESS data. For 13 of those sources, flickering was found for the first time, including NQ Gem and CD −27 8661 (see their Table 2). The flickering has an erratic pattern –similar to that seen in the symbiotic star RT Cru– in 3 of the 19 sources. These authors also report a lack of flickering in 59 systems, based on TESS and previous literature (see Table A.1 of Merc et al. 2024).
We also searched for short-term variability in the exquisite TESS and XMM-Newton-OM light curves of our targets. We first removed the long-term (days) variability from each portion (before and after downlink intervals) of each TESS sector and XMM-Newton-OM data by subtracting a Savitzky–Golay (SG; Savitzky & Golay 1964) filter. We quantify its flickering strength by the ratio between the observed rms amplitude and that expected from Poisson statistics (see e.g., Sokoloski et al. 2001; Luna et al. 2013). The percentage of fractional rms variability amplitude (sfrac) is given by Equation (1):
 (1)
(1)
where s is the measured standard deviation (in the case of s/sexp ≈ 1, we used sexp and thus sfrac is considered an upper limit), ⟨flux⟩ is the mean flux after subtracting the long-term trend, and sexp is the expected standard deviation from Poisson statistics.
The higher ratio of s to sexp indicates that the variation is intrinsic to the source. We also used a field star from TESS data in order to give us some confidence that flickering is not an artifact.
5. Results
In this section, we discuss the results of our analysis of the observations from XMM-Newton, Swift, and TESS.
5.1. BD Cam
BD Cam is a symbiotic binary with a Tc-deficient component and a red giant component with Teff = 3500 K (e.g., Ake et al. 1988). It was discovered by Keenan (1954) as a star of S5.3 spectral type with a magnitude of V = 5.1 mag and ∼1 mag amplitude variations between high and low states (see Figure 1). In their analysis of the IUE spectra, Ake et al. (1988) showed that strong UV emission lines and the observed flux variability were related to a WD companion, establishing the symbiotic nature of the system. The system has an orbital period of 596 d (Griffin 1984) and a pulsation of 24.76 d is associated with the giant (Adelman 1998). The mass-loss rate from the cool component was estimated to be 1.7 × 10⁻⁸ M⊙ yr−1, as derived from measurements of the dust-loss rate using Two Micron Sky Survey data (Jura 1988).
Ortiz et al. (2019) found emission lines of OIV]/Si IVλ1400, C IVλλ1548,1551, and OIII]λ1666 in GALEX and IUE far-UV spectra. Longer wavelength IUE spectra revealed absorption lines from the red giant at λ > 2800 Å. In an optical spectrum obtained with the Isaac Newton Telescope (INT), these latter authors found an emission core in the Ca II absorption line, commonly associated with chromospheric activity. Occasionally, the He I λ10830 line appears in absorption, suggesting that this line is formed in a layer above the photosphere of the primary, which is not expected under the hypothesis of an accretion disk around the secondary.
The X-ray observations of BD Cam with Swift are described in Section 2.2. The X-ray spectrum was modeled in the range 0.6−9 keV because of the high background counts at lower energies. We fitted the spectrum with a simple model composed of an absorbed optically thin thermal plasma (tbabs × apec), with kT = 2.3 keV (see Figure 3). The absorption column was NH < 0.5 × 1022 cm−2 (see Table 3). The unabsorbed flux was FX = 18
 × 10−13 erg s−1 cm−2 and the luminosity was LX = 1.2
 × 1031 erg s−1 at a distance of 235 ± 15 pc, as given in the Gaia Early Data Release 3 (EDR3, Bailer-Jones et al. 2021).
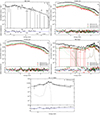 |
Fig. 3. X-ray spectra of the symbiotic stars: (a) BD Cam using Swift data, (b) V1261 Ori using the tbabs × mkcflow model, and (c) V1261 Ori using the tbabs × compTT model, (d) NQ Gem, and (e) CD −27 8661. These data were obtained with XMM-Newton where the black color is EPIC-pn, the red is EPIC-MOS 1, and the green is EPIC-MOS 2. The solid lines show the best-fit models given in Table 3. The dotted lines show the contribution of the individual spectral components in the case of multicomponent models. |
Spectral models.
BD Cam was previously classified as β/δ-type by Merc et al. (2021) based on the X-ray spectrum from the Swift-XRT point source catalog by Evans et al. (2013). However, as mentioned in Section 2.2, the XRT data are heavily affected by optical loading, with the appearance of artificial soft and hard components in the spectrum (see Figure 2). The free-from-optical-loading spectrum taken in WT mode shows that the majority of the photons have energies of lower than 2.4 keV, while the plasma temperature reaches values of 2.3 keV (see Table 3). If this temperature arises from shocks in a colliding wind region, the strong shock conditions imply that the shock speed is about 1500 km s−1 (e.g., Nuñez et al. 2016). Given that such speeds are not reported for BD Cam, we favor a scenario where those speeds are present in the shock within the accretion disk boundary layer, and thus BD Cam should be classified as a β- or δ-type symbiotic star.
The Bayesian analysis of X-ray data from BD Cam using the same model described above, yields a temperature of kT = 2.80 keV considering an absorption column density of 0.03 × 1022 cm−2 (see Table 2). These results agree with the non-Bayesian approach. Figure B.1 shows the covariances of the posterior distributions of the free parameters NH and kT, and the normalization and its values. These results indicate that the model globally reproduces the data.
5.2. V1261 Ori
V1261 Ori is the first eclipsing binary star discovered with a cool barium component, of spectral type S4.1 (Teff = 3470 K). A strong Ce II absorption line was identified in the spectra from the APOGEE survey indicating the presence of s-process elements due to AGB stellar evolution (Cunha et al. 2017). The symbiotic star classification of V1261 Ori is based on the presence of high-excitation emission lines (e.g., C IV λ1550 Å) and a variable continuum in the UV, both being typical of interacting binaries (Ake et al. 1991; Belczyński et al. 2000). Based on V-band ASAS-SN data, Gromadzki et al. (2013) reported a modulation of 640.5 d in the form of a double sine-wave, which they interpreted as due to ellipsoidal variations. Later, Boffin et al. (2014) reported a period of 638.24 ± 0.28 d interpreted as due to the orbital modulation. Boffin et al. (2014) argued against the presence of ellipsoidal variations based on the red giant’s small filling factor of 0.32 ± 0.16, and on the absence of synchronization between the spin of the red giant and the orbital period.
V1261 Ori presents characteristics from red- and yellow-type symbiotic stars: the low metal abundance of post-iron-peak elements is typical of yellow symbiotic stars, while its luminosity and temperature are commonly observed in red symbiotic stars. However, the mass-loss rate of 10−8 M⊙ yr−1 determined by Jorissen et al. (1996) does not agree with the mass-loss rates of either red or yellow systems, which are typically around 10−7 M⊙ yr−1. There is no clear explanation for this reduced mass-loss rate, but it should lead to a lower density of circumstellar material around the system and may account for the absence of optical emission lines (Vanture et al. 2003).
The Swift data of V1261 Ori suffered from optical loading as described in Section 2.2, and therefore we analyzed only the XMM-Newton data, which were obtained using the thick filter in the EPIC camera and thus avoided contamination by optical loading. We considered two spectral models for V1261 Ori, an absorbed multitemperature cooling-flow plasma (tbabs × mkcflow), and an absorbed comptonized spectrum (tbabs × compTT). The choice of this latter model, usually used to describe the X-ray emission of γ-type symbiotic stars harboring a neutron star, was motivated by the apparent absence of emission lines, which should be present in an optically thin thermal plasma. For the first model, we find an absorbing column of NH = 0.07 ± 0.01 × 1022 cm−2, a low temperature of kT = 0.1 ± 0.05 keV, and a high temperature of kT = 7.7 ± 0.3 keV (see Table 3). The accretion rate derived from the model normalization is 2.82 × 10⁻¹¹ M⊙ yr−1 (Mushotzky & Szymkowiak 1988). The spectrum does not exhibit significant emission lines and the abundance is 0.17 ± 0.04 when using the abundance table of wilm (Wilms et al. 2000). We note that the [Fe/H] abundance derived from optical data is low, at a value of −0.8 ± 0.04 (Vanture et al. 2003), which is in agreement with the low abundance obtained from the mkcflow fit. In the case of the second model, we find an absorber with a column density of NH ≤ 0.03 × 1022 cm−2, a soft photon (Wien) temperature of 0.18 ± 0.01 keV, a plasma temperature of ≤2.5 keV, and an optical depth of the plasma cloud of 6.4
 . The unabsorbed fluxes are relatively similar for both models: 23.71 ± 0.02 and 21.16 ± 0.02 × 10⁻¹³ erg s−1 cm−2. The luminosities are 3.9 ± 0.3 and 3.6 ± 0.3 × 1031 erg s−1 using Gaia’s distance of 375 ± 17 pc.
We only applied the Bayes X-ray spectral analysis to the pn data of V1261 Ori. We also fixed the abundance to that of the mkcflow model and the plasma optical depth to that of the compTT model. The posterior distributions for the tbabs × mkcflow model show uniformly flat values over all parameter space, and its results mostly follow the priors (see Figure B.1). This model is not able to recover realistic values for the multitemperatures (lowT, highT) or absorption (NH). On the other hand, the tbabs × compTT model suggests that the plasma has temperatures of 0.18 ± 0.01 keV (Wien) and 2.15 ± 0.03 keV with absorption of ≤0.02 × 1022 cm−2. Table 2 shows these values. These results are similar to the values found using the non-Bayes analysis.
V1261 Ori was observed with TESS in two sectors, 5 and 32, separated by about two years. The earliest observation was performed when the source was at an average brightness level of about 6.8 mag, as shown in AAVSO V band data (see Figure 1). From TESS data, neither sector 5 and nor 32 shows evidence of modulations (see Figure 4). We find flickering amplitudes of 0.02% for each of the four parts of the TESS light curve (see Table 4). At shorter wavelengths, the UVW1 and UVW2 data from XMM-Newton-OM exhibit variability of about one-tenth of a magnitude (see Figure 5) with an average flickering amplitude of 3.6%.
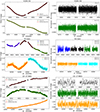 |
Fig. 4. TESS light curves of V1261 Ori, NQ Gem, and CD −27 8661. Left column: TESS light curves for each sector with the Savitsky-Golay over-plotted in red. Right column: Amplitude of normalized TESS T magnitude after subtracting the SG filter. The gaps are the data transmission to Earth. |
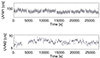 |
Fig. 5. XMM-Newton-OM light curves of V1216 Ori in the UVW1 and UVM2 filters in 120 s bins. |
Timing analysis from optical light curves given by each TESS section (before and after downlink intervals) and the XMM-Newton filter.
5.3. NQ Gem
The red giant component in NQ Gem is a carbon star of spectral type C6.2 (Yamashita 1972). It was first classified as a symbiotic star by Greene & Wing (1971) because of its highly variable UV continuum and the similarity of its optical spectra with the symbiotic recurrent nova T CrB. Observations with the IUE satellite showed a strong C IV λ1550 emission line, and a Si III]/C III] λ1900 line ratio similar to those of symbiotic stars (Johnson et al. 1988). The orbital period of 1305 ± 4 d was found by Carquillat & Prieur (2008) and a pulsation period of 58 ± 1 d was reported by Gromadzki et al. (2013).
NQ Gem has been classified as a β/δ X-ray-type symbiotic star. Luna et al. (2013) reported the X-ray spectrum obtained with Swift, which exhibited two distinct components at energies above and below ∼1.5 keV; a similar X-ray spectrum has been observed in a few WD symbiotic stars (e.g., CH Cyg, ZZ CMi, V347 Nor, and UV Aur). The X-rays with energies above 2 keV presumably arise from the optically thin portion of the accretion disk boundary layer, while those X-rays with lower energies could be generated in a region where the winds from the red giant and that from the white dwarf or accretion disk. Luna et al. (2013) modeled both optically thin thermal components with temperatures of kT = 0.23 ± 0.03 keV and kT ≳ 16 keV for soft and hard energies, respectively. The unabsorbed flux in 0.3−10 keV was 6.7 × 10¹² erg s−1 cm−2 and a luminosity of 80
 × 1031 erg s−1 was estimated at distance of 1 kpc.
The XMM-Newton data were obtained during a typical brightness state with magnitude of about 8 mag in V band (see Figure 1). We applied a spectral model similar to the one used by Luna et al. (2013), which is composed of one partially covering absorber, two thermal components, and a Gaussian line profile (see Table 3). This yields a good fit to the soft and hard X-ray emission. Our analysis of the XMM-Newton spectra yields NH(partial) = 50 × 1022 cm−2 with a partially covering fraction of 0.990 ± 0.002, and thermal components of kT1 = 0.2 ± 0.1 keV and kT2 = 7.0
 keV.
keV.
Toalá et al. (2023) modeled the same XMM-Newton data with two absorbed temperature components at energies below 4 keV, a power law, and a heavily absorbed thermal component with a Gaussian line profile, at energies above 4.0 keV. However, we do not find a significant improvement by including a second apec component or a power law to fit the 2.0−4.0 keV energy range. Moreover, the presence of nonthermal emission in the X-ray spectra of symbiotic stars is yet to be conclusively established and thus the physical motivation to include it in the spectral models is still marginal.
We find unabsorbed fluxes of 2.3 × 10⁻¹³ erg s−1 cm−2 and 15.3
 × 10−13 erg s−1 cm−2 for the soft and hard components, respectively. The most up-to-date distance of NQ Gem is 1012
 pc from Gaia (EDR3), which implies luminosities of 2.9
 × 1031 erg s−1 and 19
 × 1031 erg s−1. Our results are in agreement with those presented in Luna et al. (2013) based on Swift data and those of Toalá et al. (2023), which are based on XMM-Newton data.
The Bayesian X-ray analysis was applied only to pn data, because the EPIC-MOS data present a low number of counts. We also fixed the normalization of the two thermal models with values found from the C-statistic. Therefore, the free parameters were the covering fraction, absorption, temperatures for soft and hard components, and the normalization of the Gaussian. We find NH = 50.1 ± 1.1 × 1022 cm−2 with a covering fraction of 0.99, kT = 0.13 keV and 7.16
 keV for soft and hard components, respectively (see Table 2). These values are consistent with our previous model using the C-statistic approach.
NQ Gem was observed with TESS in three consecutive sectors, covering a period of almost three months in 2021, and recently in October and November 2023. AAVSO-V band photometry during those months in 2021 shows that NQ Gem was about 8.3 mag (see historical data in Figure 1).
Luna et al. (2013) reported flickering with a fractional rms amplitude of 15% from Swift UVOT photometry. Indeed, we find a flickering amplitude of about 7% for XMM-Newton-OM light curves in the UVW1 and UVM2 filters (see Figure 6). During TESS observations, the average amplitude of variability was 0.1% for sectors 44, 45, and 46, while during sectors 71 and 71 this value was 0.01%; although these later light curves are noisier than early data. Figure 4 shows the TESS time series of sectors 44, 45, 46, 71, and 72 with typical gaps used for data transfer to Earth (left column) and the amplitude of flickering after removal of the SG fit (right column).
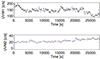 |
Fig. 6. XMM-Newton OM light curves of NQ Gem in the UVW1 and UVM2 filters in 120 s bins. |
5.4. CD –27 8661
CD −27 8661 (V420 Hya) is another eclipsing extrinsic S symbiotic star with no presence of the Tc element in the red giant spectrum (Van Eck & Jorissen 2002). Its symbiotic nature was suggested based on a strong blue-violet continuum and broad Hα emission with FWHM > 300 km s−1 (Van Eck & Jorissen 2000). These latter authors also pointed out that Hα originates from the gas moving with the companion star, because the radial velocity from the center of the emission line seems to be similar to that of the companion star. Van Eck et al. (2000) found that the spectral features, such as the flux of the UV continuum and the Hα emission line, are related to the orbital period of 763.63 ± 5.88 days. This orbital period is roughly in agreement with the value of 751.4 ± 0.2 d previously proposed by Jorissen et al. (2019). The secondary is close to filling its Roche lobe, as the calculated secondary radius is 153 R⊙, while its Roche lobe radius is 180 R⊙ (Van Eck & Jorissen 2002). The authors also estimated an orbital eccentricity of 0.099 ± 0.004.
CD −27 8661 was observed on 2010 August 24 and 26 by Swift. The Swift UVOT light curves were presented by Luna et al. (2013) with a mean count rate of 17.7 ± 0.5 c s−1. Here, we analyze the XMM-Newton observations performed on 2016 January 27, which was during orbital phase 0.92 (using the ephemeris from Jorissen et al. 2019) and therefore out of the eclipse. The X-ray spectrum was modeled in the 4 to 10 keV energy range using an absorbed, optically thin thermal plasma plus a Gaussian emission line, which gives a statistically acceptable description of the observed spectrum. We find an absorbing column of NH ≤ 85 × 10−22 cm−2, a temperature of 7 keV, and a metal abundance of 2.2 ± 0.1. The center of the Gaussian emission line was fixed at 6.4 ± 0.005 keV. The unabsorbed flux was 2.5 ± 0.7 × 10⁻¹³ erg s−1 cm−2, corresponding to a luminosity of 9
 × 1031 erg s−1 at a distance of 1679
 pc obtained from Gaia (EDR3). Based on its hard X-ray emission, with most of the emission with energies above 4 keV, CD −27 8661 can be classified as a δ-type symbiotic star.
We also obtained the previous model parameters using the Bayesian methodology. In the energy range of 4 to 10 keV, we find the posteriors NH = 87.1 × 10⁻²² cm−2 and kT = 11.4
 keV (see Table 2). The abundance was fixed at 2.2 and the Gaussian emission line center and width were also fixed as the model was insensitive to their precise values. In turn, the normalization of the Gaussian and APEC models were considered free parameters. These resulting values for the free parameters are in agreement with those found using only the C-statistic.
The TESS observations of CD −27 8661 were carried out in three sectors, 10, 37, and 64 separated by two years between them. The light curves are shown in Figure 4 (left panel). After subtracting the light curves from SG fitting (see the right panel of Figure 4), flickering activity was detected with an amplitude of 0.2% in sector 10, and 0.1% in sectors 37 and 64. Figure 7 shows the XMM-Newton-OM light curves from the UVW1 and UVM2 filters with a slightly higher flickering amplitude of around 8%.
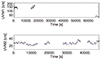 |
Fig. 7. XMM-Newton OM light curves of CD −27 8661 in the UVW1 and UVM2 filters with 120 s bins. |
6. Discussion
The symbiotic stars are historically known as soft X-ray emitters, but the hard X-ray observatories such as INTEGRAL and Swift revealed that these systems can also be hard X-ray sources. The detection of hard X-rays from symbiotic stars not only provided a growing number of members of the class but also required a new type within the classification scheme proposed by Muerset et al. (1997). In the present paper, we find that, in terms of X-ray classification, BD Cam can be a β- or a δ-type system, V1261 Ori and CD −27 78661 can be δ-type, and we confirmed the previous classification of NQ Gem as β/δ-type (Luna et al. 2013; Toalá et al. 2023). We note that V1261 Ori was already classified as δ-type by Merc et al. (2021) during the analysis of the Swift/XRT-PC mode data, which were affected by optical loading as described in Section 2.2.
6.1. X-ray spectral analysis
Our best-fit models to the X-ray spectra consist of optically thin thermal emission seeing through an intrinsic absorber. Initially, we found the best-fit model parameters using a C-statistic maximum-likelihood function. We then applied the Bayesian approach from the BXA package (Buchner et al. 2014). The main goal was to distort the parameter space by priors in order to identify the posterior distribution of each parameter in multidimensional space, compiling the results in a Gaussian approximation. Table 2 shows the intervals and the values of the parameters found using the Bayes statistic. The results are relatively similar to those obtained using the C-statistic. For example, for NQ Gem we find an absorber column density of NH = 50 × 1022 cm−2 using a non-Bayes method and NH = 51 ± 1 × 1022 cm−2 using the Bayes method, which are congruent within the uncertainties. Similarly, the Bayesian analysis of the symbiotic system RT Cru performed by Danehkar et al. (2021) showed the same temperature and absorbing column density as those found by Luna & Sokoloski (2007), in which the Bayesian approach was not applied.
Despite the fact that we did not use the parameter values obtained from the C-statistic approach as priors, but a range of values instead, we still found that the agreement with the results from the Bayes approach is independent of our procedure. As a test, we provided a range of priors instead of a fixed value, and the results found with the Bayes statistic are consistent within the uncertainties with those determined using the xspec error command. The Kullback–Leibler (KL) divergence characterizes how strongly the posterior is influenced by the prior (Kullback & Leibler 1951). The difference between the prior and posterior measure reveals a mean value of KL = 0.46 ± 0.06 bans, which shows that the posteriors are not dominated by the priors (see Figure B.1).
In V1261 Ori, the mkcflow model does not converge, which is because of the higher level of degeneracy between the multitemperatures and the other parameters; in this case, the comppTT model better describes its X-ray spectrum. In general cases, the NH posterior does not introduce a strong bias, as mentioned by Buchner et al. (2014); although the majority of the subvolume probabilities are slighter blurred, the classification of the sources among the absorbed and unabsorbed categories can be considered accurate.
In general, there is degeneracy between NH and the temperature parameters, which is evidenced by the flat distribution of the parameter space (see the corner module in the left panel of Figure B.1). Hence, a prior value of NH plays an important role in constraining kT. As mentioned before, a good fit would produce a straight line in Q − Q plots (right panel in Figure B.1). For V1261 Ori, the compTT model gives a K − S value of 0.006. This value is close to zero, indicating a good fit. In the case of BD Cam and NQ Gem, the red line is close to the gray line, indicating a statistically acceptable model with K − S values of 0.097 and 0.040, respectively. The X-ray spectrum of CD −27 8661 has a low number of counts, consequently the model is not good with K − S = 0.071. This same behavior is also observed using the C-statistic.
6.2. Mass-accretion rate of the optically thin boundary layer
The mass-accretion rate (Ṁthin, BL) can be estimated by measuring the unabsorbed hard X-ray luminosity (LX) between 0.3 and 10 keV –which is related to the optically thin portion of the boundary layer– and by following its relationship with the white dwarf mass as (e.g., Luna & Sokoloski 2007):
 (2)
(2)
where LX is the unabsorbed X-ray luminosity, RWD and MWD are the radius and the mass of the white dwarf, and G is the gravitational constant.
Symbiotic systems have WD masses of around 0.8 M⊙ (Mikolajewska 2008), although some symbiotic recurrent novae have WD masses close to the Chandrasekhar limit; for example T CrB has a WD mass of 1.2−1.37 M⊙ (e.g., Luna et al. 2018).
Assuming optically thin X-ray emission, and using the typical value of WD mass and a WD radius of 7 × 108 cm, as well as the luminosities found from each spectral model (using the Gaia-DR3 distances), the mass-accretion rates of our targets are given in Table 5. In NQ Gem, the mass-accretion rates were calculated using the luminosities obtained for hard components, which are related to the accretion disk boundary layer.
Mass-accretion rate of the thin optical boundary layer calculated for V1261 Ori, NQ Gem, and CD −27 8661.
As mentioned above, the normalization of the cooling flow model yielded the mass-accretion rate. In V1261 Ori, we find the value of ∼3 × 10⁻¹¹ M⊙ yr−1 (see Section 5.2). This last result is consistent with 0.8 × 10⁻¹¹ M⊙ yr−1 obtained using average values for the WD mass and radius (Equation 2). At the same time, those values are significantly smaller than the values for the mass-loss rate of Barium-syndrome stars, such as BD Cam and V1261 Ori, which (Jorissen et al. 1996) find to be in the range of 10−7 to 10−8 M⊙ yr−1. If the X-ray emission arises from the innermost region of the accretion disk, the low mass-accretion rate inferred implies that this region is optically thin to its own radiation (Patterson & Raymond 1985). On the other hand, the ratios of unabsorbed X-ray luminosity and the optical luminosity at filters UVW1 and UVM2 obtained from the OM data –which we assume to have come from the Keplerian portion of the accretion disk– are extremely low (see Table 6), indicating that the boundary layer is almost entirely optically thick in the X-rays, with an optically thin layer that radiates the thermal bremsstrahlung component with temperatures of lower than about 8 keV (Patterson & Raymond 1985; Pandel et al. 2005). This suggests that the mass-transfer mechanism in these systems is extremely inefficient when compared to what might be expected based on Roche-lobe filling or Bondi-Hoyle accretions.
Luminosity relation of V1261 Ori, NQ Gem, and CD −27 8661.
The historical optical light curves of our targets do not show significant brightness changes, which might otherwise indicate a sudden increase in the mass-accretion rate (see Figure 1), such as that seen in novae or dwarf nova outbursts, which are more frequent in sources with high Ṁ. This is in agreement with the low mass-accretion rates that we find in our analysis of the X-ray emission.
6.3. Flickering variations
Table 4 lists the amplitude of the flickering for optical light curves from TESS and XMM-Newton-OM. We observe small-amplitude flickering based on TESS data, ranging from 0.01 to 0.1%. Merc et al. (2024) found an average flickering amplitude of about 0.1% for CD −27 8661 and 0.03% for NQ Gem using the rms method (see their Figure 18). Our average amplitudes are similar for those targets, although NQ Gem exhibits slight variation between sectors 44, 45, 46, 71, and 72. The lower flickering amplitude observed in TESS data when compared to that from bluer bands, such as the XMM-Newton-OM and Swift-UVOT, is related to the prevalence of the red giant emission in optical/near-IR wavelengths (see discussion in Merc et al. 2024). Similarly, Zamanov et al. (2021) searched for rapid variability in SU Lyn, detecting flickering with a significant amplitude in the U band but no variability in the B and V bands.
In agreement with Luna et al. (2013), we find that symbiotic stars with harder X-ray emission –which are accretion-powered– tend to exhibit flickering of greater amplitude in blue bands. Figure 8 shows an updated version of Fig. 6 from Luna et al. (2013), where we include our measurements of the amplitude of flickering from UV and TESS data. Also, there is a clear lack of systems of intermediate and hard X-ray energies between 0.2 and 0.7 keV, and so additional X-ray observations are needed for symbiotic stars to fill these gaps.
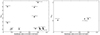 |
Fig. 8. Fractional amplitude of optical variability (Sfrac) vs. ratio of hard (2.4−10.0 keV) to total (0.3−10.0 keV) X-ray count rates from Luna et al. (2013) and this paper. |
7. Conclusions
We present a study of four symbiotic stars: BD Cam, V1261 Ori, NQ Gem, and CD −27 8661 based on observations from the Swift-XRT and XMM-Newton in X-rays and UV, and TESS in optical. These symbiotic stars are of the accretion-powered type, a finding supported by their hard X-ray emission as well as the presence of flickering in their light curves from TESS data. Indeed, the δ-type X-ray emission is present in those symbiotic stars that are powered by accretion, arising in the boundary layer. On the other hand, the soft component, which is of the β-type, originates from shocks, possibly between the red giant and WD/disk winds. Furthermore, the β/δ-type stars are composed of soft and hard components, indicating that some β-type emission can also be produced by accretion-powered symbiotic stars. TESS data can be a useful diagnostic tool to search for flickering, which we find to be a proxy for the hardness of the X-ray emission and a characteristic that can be used to identify accretion-powered symbiotic stars.
Jaroslav Merc’s catalog of symbiotic stars at https://sirrah.troja.mff.cuni.cz/~merc/nodsv/
See AAVSOs Light Curve Generator in https://www.aavso.org/LCGv2/
See DASCH in http://dasch.rc.fas.harvard.edu/lightcurve.php
See SAS threads website in https://www.cosmos.esa.int/web/xmm-newton/sas-threads
See more information about optical loading in https://www.swift.ac.uk/analysis/xrt/optical_loading.php#holes
See build Swift-XRT products in https://www.swift.ac.uk/user_objects/
Acknowledgments
The authors thank the referee for corrections and suggestions to the manuscript. IJL and GJML acknowledge support from grant ANPCYT-PICT 0901/2017. GJML and NEN are members of the CIC-CONICET (Argentina). ASO acknowledges São Paulo Research Foundation (FAPESP) for financial support under grant #2017/20309-7. JLS acknowledges support from NASA award 80NSSC21K0715. NP thanks the Coordenação de Aperfeiçoamento de Pessoal de Nível Superior – Brazil (CAPES) for the financial support under grant 88887.823264/2023-00. We thank Dr. Kim L. Page for help with the optical loading. We acknowledge the use of public data from the SwiftXMM-Newton and TESS data archive. We use of the python packages matplotlib, scipy, numpy, pyXSPEC, and Bayesian X-ray Analysis (BXA). We also acknowledge the variable star observations from the AAVSO International Database contributed by observers worldwide and used in this research, the ASAS-SN Sky Patrol, the DASCH project at Harvard, which is partially supported by NSF grants AST-0407380, AST-0909073, and AST-1313370.
References
- Adelman, S. J. 1998, A&A, 333, 952 [NASA ADS] [Google Scholar]
- Ake, T. B., Johnson, H. R., & Perry, B. F. 1988, ESA Spec. Publ., 1, 245 [NASA ADS] [Google Scholar]
- Ake, T. B., Johnson, H. R., & Ameen, M. M. 1991, ApJ, 383, 842 [NASA ADS] [CrossRef] [Google Scholar]
- Akras, S., Guzman-Ramirez, L., Leal-Ferreira, M. L., & Ramos-Larios, G. 2019, ApJS, 240, 21 [NASA ADS] [CrossRef] [Google Scholar]
- Allen, D. A. 1981, MNRAS, 197, 739 [NASA ADS] [CrossRef] [Google Scholar]
- Arnaud, K. A. 2016, AAS/High Energy Astrophysics Division, 15, 115.02 [NASA ADS] [Google Scholar]
- Bahramian, A., Gladstone, J. C., Heinke, C. O., et al. 2014, MNRAS, 441, 640 [CrossRef] [Google Scholar]
- Bailer-Jones, C. A. L., Rybizki, J., Fouesneau, M., Demleitner, M., & Andrae, R. 2021, AJ, 161, 147 [Google Scholar]
- Belczyński, K., Mikołajewska, J., Munari, U., Ivison, R. J., & Friedjung, M. 2000, A&AS, 146, 407 [NASA ADS] [CrossRef] [EDP Sciences] [Google Scholar]
- Bickert, K. F., Stencel, R. E., & Luthardt, R. 1993, in Planetary Nebulae, eds. R. Weinberger, & A. Acker, 155, 405 [NASA ADS] [CrossRef] [Google Scholar]
- Bickert, K. F., Greiner, J., & Stencel, R. E. 1996, in Supersoft X-Ray Sources, ed. J. Greiner (Berlin, Heidelberg: Springer), 472, 225 [NASA ADS] [CrossRef] [Google Scholar]
- Boffin, H. M. J., Hillen, M., Berger, J. P., et al. 2014, A&A, 564, A1 [NASA ADS] [CrossRef] [EDP Sciences] [Google Scholar]
- Bondi, H., & Hoyle, F. 1944, MNRAS, 104, 273 [Google Scholar]
- Bozzo, E., Bahramian, A., Ferrigno, C., et al. 2018, A&A, 613, A22 [NASA ADS] [CrossRef] [EDP Sciences] [Google Scholar]
- Bruch, A. 1992, A&A, 266, 237 [NASA ADS] [Google Scholar]
- Buchner, J. 2021, J. Open Source Softw., 6, 3001 [CrossRef] [Google Scholar]
- Buchner, J., Georgakakis, A., Nandra, K., et al. 2014, A&A, 564, A125 [NASA ADS] [CrossRef] [EDP Sciences] [Google Scholar]
- Carquillat, J. M., & Prieur, J. L. 2008, Astron. Nachr., 329, 44 [NASA ADS] [CrossRef] [Google Scholar]
- Cash, W. 1979, ApJ, 228, 939 [Google Scholar]
- Cunha, K., Smith, V. V., Hasselquist, S., et al. 2017, ApJ, 844, 145 [Google Scholar]
- Danehkar, A., Karovska, M., Drake, J. J., & Kashyap, V. L. 2021, MNRAS, 500, 4801 [Google Scholar]
- De, K., Mereminskiy, I., Soria, R., et al. 2022, ApJ, 935, 36 [NASA ADS] [CrossRef] [Google Scholar]
- den Herder, J. W., Brinkman, A. C., Kahn, S. M., et al. 2001, A&A, 365, L7 [NASA ADS] [CrossRef] [EDP Sciences] [Google Scholar]
- Evans, P. A., Beardmore, A. P., Page, K. L., et al. 2009, MNRAS, 397, 1177 [Google Scholar]
- Evans, P. A., Osborne, J. P., Beardmore, A. P., et al. 2013, VizieR Online Data Catalog: IX/43 [Google Scholar]
- Eze, R. N. C., Luna, G. J. M., & Smith, R. K. 2010, ApJ, 709, 816 [NASA ADS] [CrossRef] [Google Scholar]
- Gordon, C., & Arnaud, K. 2021, Astrophysics Source Code Library [record ascl:2101.014] [Google Scholar]
- Greene, A. E., & Wing, R. F. 1971, ApJ, 163, 309 [NASA ADS] [CrossRef] [Google Scholar]
- Griffin, R. F. 1984, The Observatory, 104, 224 [NASA ADS] [Google Scholar]
- Grindlay, J., Tang, S., Simcoe, R., et al. 2009, ASP Conf. Ser., 410, 101 [Google Scholar]
- Gromadzki, M., Mikołajewska, J., & Soszyński, I. 2013, Acta Astron., 63, 405 [NASA ADS] [Google Scholar]
- Hare, J., Kargaltsev, O., Cenko, S. B., & Klingler, N. J. 2021, Res. Notes Am. Astron. Soc., 5, 259 [Google Scholar]
- Iben, I., & Tutukov, A. V. 1996, ApJS, 105, 145 [NASA ADS] [CrossRef] [Google Scholar]
- Johnson, H. R., Eaton, J. A., Querci, F. R., Querci, M., & Baumert, J. H. 1988, A&A, 204, 149 [NASA ADS] [Google Scholar]
- Jorissen, A., Schmitt, J. H. M. M., Carquillat, J. M., Ginestet, N., & Bickert, K. F. 1996, A&A, 306, 467 [NASA ADS] [Google Scholar]
- Jorissen, A., Boffin, H. M. J., Karinkuzhi, D., et al. 2019, A&A, 626, A127 [NASA ADS] [CrossRef] [EDP Sciences] [Google Scholar]
- Jura, M. 1988, ApJS, 66, 33 [NASA ADS] [CrossRef] [Google Scholar]
- Kaplan, D. L., Levine, A. M., Chakrabarty, D., et al. 2007, ApJ, 661, 437 [NASA ADS] [CrossRef] [Google Scholar]
- Keenan, P. C. 1954, ApJ, 120, 484 [NASA ADS] [CrossRef] [Google Scholar]
- Kennea, J. A., Mukai, K., Sokoloski, J. L., et al. 2009, ApJ, 701, 1992 [NASA ADS] [CrossRef] [Google Scholar]
- Kenyon, S. J. 2009, The Symbiotic Stars (Cambridge: Cambridge University Press) [Google Scholar]
- Kenyon, S. J., Fernandez-Castro, T., & Stencel, R. E. 1986, AJ, 92, 1118 [NASA ADS] [CrossRef] [Google Scholar]
- Kenyon, S. J., Livio, M., Mikolajewska, J., & Tout, C. A. 1993, ApJ, 407, L81 [CrossRef] [Google Scholar]
- Kochanek, C. S., Shappee, B. J., Stanek, K. Z., et al. 2017, PASP, 129, 104502 [Google Scholar]
- Kullback, S., & Leibler, R. A. 1951, Ann. Math. Stat., 22, 79 [CrossRef] [Google Scholar]
- Kuulkers, E., Page, K. L., Saxton, R. D., et al. 2014, ATel, 6015 [Google Scholar]
- Lightkurve Collaboration (Cardoso, J. V. D. M., et al.) 2018, Astrophysics Source Code Library [record ascl:1812.013] [Google Scholar]
- Lima, I. J., Luna, G. J. M., & Nuñez, N. E. 2022, ATel, 15332 [Google Scholar]
- Lima, I. J., Luna, G. J. M., Walter, F. M., et al. 2023, Boletin de la Asociacion Argentina de Astronomia La Plata Argentina, 64, 59 [NASA ADS] [Google Scholar]
- Lucy, A. B. 2021, Ph.D. Thesis, Columbia University, New York, USA [Google Scholar]
- Luna, G. J. M., & Sokoloski, J. L. 2007, ApJ, 671, 741 [NASA ADS] [CrossRef] [Google Scholar]
- Luna, G. J. M., Sokoloski, J. L., & Costa, R. D. D. 2006, Ap&SS, 304, 283 [CrossRef] [Google Scholar]
- Luna, G. J. M., Sokoloski, J. L., & Mukai, K. 2008, ASP Conf. Ser., 401, 342 [Google Scholar]
- Luna, G. J. M., Sokoloski, J. L., Mukai, K., & Nelson, T. 2013, A&A, 559, A6 [NASA ADS] [CrossRef] [EDP Sciences] [Google Scholar]
- Luna, G. J. M., Nunez, N., Sokoloski, J., Mukai, K., & Nelson, T. 2015, ATel, 6880 [Google Scholar]
- Luna, G. J. M., Mukai, K., Sokoloski, J. L., et al. 2018, A&A, 619, A61 [NASA ADS] [CrossRef] [EDP Sciences] [Google Scholar]
- Masetti, N., Dal Fiume, D., Cusumano, G., et al. 2002, A&A, 382, 104 [NASA ADS] [CrossRef] [EDP Sciences] [Google Scholar]
- Masetti, N., Landi, R., Pretorius, M. L., et al. 2007, A&A, 470, 331 [NASA ADS] [CrossRef] [EDP Sciences] [Google Scholar]
- Mason, K. O., Breeveld, A., Much, R., et al. 2001, A&A, 365, L36 [NASA ADS] [CrossRef] [EDP Sciences] [Google Scholar]
- Merc, J., Gális, R., & Wolf, M. 2019a, Astron. Nachr., 340, 598 [NASA ADS] [CrossRef] [Google Scholar]
- Merc, J., Gális, R., & Wolf, M. 2019b, Res. Notes Am. Astron. Soc., 3, 28 [Google Scholar]
- Merc, J., Gális, R., Wolf, M., et al. 2021, MNRAS, 506, 4151 [NASA ADS] [CrossRef] [Google Scholar]
- Merc, J., Beck, P. G., Mathur, S., & García, R. A. 2024, A&A, 683, A84 [NASA ADS] [CrossRef] [EDP Sciences] [Google Scholar]
- Mikolajewska, J. 2008, ASP Conf. Ser., 401, 42 [NASA ADS] [Google Scholar]
- Mohamed, S., & Podsiadlowski, P. 2007, ASP Conf. Ser., 372, 397 [Google Scholar]
- Montez, R., Kastner, J. H., & Sahai, R. 2006, Am. Astron. Soc. Meet. Abstr., 209, 92.06 [NASA ADS] [Google Scholar]
- Muerset, U., Wolff, B., & Jordan, S. 1997, A&A, 319, 201 [Google Scholar]
- Mukai, K. 2017, PASP, 129, 062001 [Google Scholar]
- Mukai, K., Ishida, M., Kilbourne, C., et al. 2007, PASJ, 59, 177 [NASA ADS] [Google Scholar]
- Mukai, K., Nelson, T., Chomiuk, L., Donato, D., & Sokoloski, J. 2012, Balt. Astron., 21, 54 [NASA ADS] [Google Scholar]
- Mukai, K., Luna, G. J. M., Cusumano, G., et al. 2016, MNRAS, 461, L1 [NASA ADS] [CrossRef] [Google Scholar]
- Munari, U., Valisa, P., Dallaporta, S., et al. 2020, ATel, 13660 [Google Scholar]
- Mushotzky, R. F., & Szymkowiak, A. E. 1988, NATO Adv. Study Inst. (ASI) Ser. C, 229, 53 [NASA ADS] [Google Scholar]
- Nichols, J. S., DePasquale, J., Kellogg, E., et al. 2007, ApJ, 660, 651 [NASA ADS] [CrossRef] [Google Scholar]
- Nuñez, N. E., Luna, G. J. M., Pillitteri, I., & Mukai, K. 2014, A&A, 565, A82 [NASA ADS] [CrossRef] [EDP Sciences] [Google Scholar]
- Nuñez, N. E., Nelson, T., Mukai, K., Sokoloski, J. L., & Luna, G. J. M. 2016, ApJ, 824, 23 [CrossRef] [Google Scholar]
- Orio, M., Zezas, A., Munari, U., Siviero, A., & Tepedelenlioglu, E. 2007, ApJ, 661, 1105 [NASA ADS] [CrossRef] [Google Scholar]
- Ortiz, R., Guerrero, M. A., & Costa, R. D. D. 2019, MNRAS, 482, 4697 [CrossRef] [Google Scholar]
- Page, K. L., Osborne, J. P., Kuin, N. P. M., et al. 2015, MNRAS, 454, 3108 [NASA ADS] [CrossRef] [Google Scholar]
- Pandel, D., Córdova, F. A., Mason, K. O., & Priedhorsky, W. C. 2005, ApJ, 626, 396 [NASA ADS] [CrossRef] [Google Scholar]
- Parikh, A. S., & Wijnands, R. 2018, ATel, 11997 [Google Scholar]
- Patterson, J., & Raymond, J. C. 1985, ApJ, 292, 535 [NASA ADS] [CrossRef] [Google Scholar]
- Ricker, G. R., Winn, J. N., Vanderspek, R., et al. 2015, J. Astron. Telesc. Instrum. Syst., 1, 014003 [Google Scholar]
- Saeedi, S., Sasaki, M., & Ducci, L. 2018, MNRAS, 473, 440 [NASA ADS] [CrossRef] [Google Scholar]
- Savitzky, A., & Golay, M. J. E. 1964, Anal. Chem., 36, 1627 [Google Scholar]
- Shappee, B. J., Prieto, J. L., Grupe, D., et al. 2014, ApJ, 788, 48 [Google Scholar]
- Smith, V. V., Cunha, K., Jorissen, A., & Boffin, H. M. J. 1996, A&A, 315, 179 [NASA ADS] [Google Scholar]
- Smith, V. V., Cunha, K., Jorissen, A., & Boffin, H. M. J. 1997, A&A, 324, 97 [NASA ADS] [Google Scholar]
- Smith, R. K., Mushotzky, R., Mukai, K., et al. 2008, PASJ, 60, S43 [NASA ADS] [CrossRef] [Google Scholar]
- Sokoloski, J. L. 2003, J. Am. Assoc. Var. Star Obs., 31, 89 [NASA ADS] [Google Scholar]
- Sokoloski, J. L., & Bildsten, L. 2010, ApJ, 723, 1188 [NASA ADS] [CrossRef] [Google Scholar]
- Sokoloski, J. L., Bildsten, L., & Ho, W. C. G. 2001, MNRAS, 326, 553 [NASA ADS] [CrossRef] [Google Scholar]
- Sokoloski, J. L., Kenyon, S. J., Espey, B. R., et al. 2006, ApJ, 636, 1002 [NASA ADS] [CrossRef] [Google Scholar]
- Strüder, L., Briel, U., Dennerl, K., et al. 2001, A&A, 365, L18 [Google Scholar]
- Stute, M., & Sahai, R. 2009, A&A, 498, 209 [NASA ADS] [CrossRef] [EDP Sciences] [Google Scholar]
- Stute, M., Luna, G. J. M., & Sokoloski, J. L. 2011, ApJ, 731, 12 [NASA ADS] [CrossRef] [Google Scholar]
- Stute, M., Luna, G. J. M., Pillitteri, I. F., & Sokoloski, J. L. 2013, A&A, 554, A56 [NASA ADS] [CrossRef] [EDP Sciences] [Google Scholar]
- Toalá, J. A., Botello, M. K., & Sabin, L. 2023, ApJ, 948, 14 [CrossRef] [Google Scholar]
- Turner, M. J. L., Abbey, A., Arnaud, M., et al. 2001, A&A, 365, L27 [CrossRef] [EDP Sciences] [Google Scholar]
- van Dyk, D. A., Connors, A., Kashyap, V. L., & Siemiginowska, A. 2001, ApJ, 548, 224 [NASA ADS] [CrossRef] [Google Scholar]
- Van Eck, S., & Jorissen, A. 2000, A&A, 360, 196 [NASA ADS] [Google Scholar]
- Van Eck, S., & Jorissen, A. 2002, A&A, 396, 599 [NASA ADS] [CrossRef] [EDP Sciences] [Google Scholar]
- Van Eck, S., Jorissen, A., Udry, S., et al. 2000, A&AS, 145, 51 [NASA ADS] [CrossRef] [EDP Sciences] [Google Scholar]
- Vanture, A. D., Wallerstein, G., Gallino, R., & Masera, S. 2003, ApJ, 587, 384 [NASA ADS] [CrossRef] [Google Scholar]
- Wilms, J., Allen, A., & McCray, R. 2000, ApJ, 542, 914 [Google Scholar]
- Yamashita, Y. 1972, Ann. Tokyo Astron. Obs., 13, 167 [Google Scholar]
- Zamanov, R. K., Stoyanov, K. A., Kostov, A., et al. 2021, Astron. Nachr., 342, 952 [NASA ADS] [CrossRef] [Google Scholar]
- Zamanov, R. K., Kostov, A., Moyseev, M., et al. 2023, Bulg. Astron. J., 38, 83 [NASA ADS] [Google Scholar]
Appendix A: X-ray spectral classifications of symbiotic stars
X-ray spectral classifications of symbiotic stars.
Appendix B: X-ray Bayesian analysis
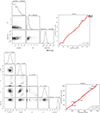 |
Fig. B.1. Corner plots of the fitted parameters obtained from the Bayesian X-ray (BXA) algorithm. The probability densities are shown with the shaded contoured region and its histogram indicating the average and error values for each parameter. QQ (quantile–quantile) plots are also shown for each convergent result. Some statistical tests are also calculated: Kolmogorov-Smirnov (K − S), Cramérvon Mises (C − vM), and the AndersonDarling (A − D). |
All Tables
Timing analysis from optical light curves given by each TESS section (before and after downlink intervals) and the XMM-Newton filter.
Mass-accretion rate of the thin optical boundary layer calculated for V1261 Ori, NQ Gem, and CD −27 8661.
All Figures
|
Fig. 1. Historical optical photometric observations from AAVSO, ASAS-SN, and DASCH of symbiotic systems: (a) BD Cam, (b) V1261 Ori, (c) NQ Gem, and (d) CD −27 8661. The AAVSO-UBVRI data are on the Vega system and ASAS-SN-V and DASCH-gmag data are on the AB system. The red and green lines indicate when the X-ray and TESS observations, respectively, were made. Our search does not provide optical measurements during the times that BD Cam and CD −27 8661 were observed in X-rays and with TESS; we therefore assume that all observations analyzed here were taken during normal brightness states of the sources. |
| In the text | |
|
Fig. 2. Effects of optical loading in X-ray spectra. Top panel: Swift spectra of BD Cam strongly affected by optical loading in XRT-PC mode (black) and without the effect of (or with negligible) optical loading in XRT-WT mode (red). Bottom panel: Spectrum of V1261 0ri showing optical loading from Swift in XRT-PC mode. All data are prepared by the online Swift-XRT data products generator. |
| In the text | |
|
Fig. 3. X-ray spectra of the symbiotic stars: (a) BD Cam using Swift data, (b) V1261 Ori using the tbabs × mkcflow model, and (c) V1261 Ori using the tbabs × compTT model, (d) NQ Gem, and (e) CD −27 8661. These data were obtained with XMM-Newton where the black color is EPIC-pn, the red is EPIC-MOS 1, and the green is EPIC-MOS 2. The solid lines show the best-fit models given in Table 3. The dotted lines show the contribution of the individual spectral components in the case of multicomponent models. |
| In the text | |
|
Fig. 4. TESS light curves of V1261 Ori, NQ Gem, and CD −27 8661. Left column: TESS light curves for each sector with the Savitsky-Golay over-plotted in red. Right column: Amplitude of normalized TESS T magnitude after subtracting the SG filter. The gaps are the data transmission to Earth. |
| In the text | |
|
Fig. 5. XMM-Newton-OM light curves of V1216 Ori in the UVW1 and UVM2 filters in 120 s bins. |
| In the text | |
|
Fig. 6. XMM-Newton OM light curves of NQ Gem in the UVW1 and UVM2 filters in 120 s bins. |
| In the text | |
|
Fig. 7. XMM-Newton OM light curves of CD −27 8661 in the UVW1 and UVM2 filters with 120 s bins. |
| In the text | |
|
Fig. 8. Fractional amplitude of optical variability (Sfrac) vs. ratio of hard (2.4−10.0 keV) to total (0.3−10.0 keV) X-ray count rates from Luna et al. (2013) and this paper. |
| In the text | |
|
Fig. B.1. Corner plots of the fitted parameters obtained from the Bayesian X-ray (BXA) algorithm. The probability densities are shown with the shaded contoured region and its histogram indicating the average and error values for each parameter. QQ (quantile–quantile) plots are also shown for each convergent result. Some statistical tests are also calculated: Kolmogorov-Smirnov (K − S), Cramérvon Mises (C − vM), and the AndersonDarling (A − D). |
| In the text | |
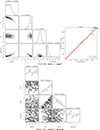 |
Fig. B.2. B.1 continued. |
| In the text | |
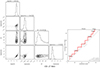 |
Fig. B.3. B.1 continued. |
| In the text | |
Current usage metrics show cumulative count of Article Views (full-text article views including HTML views, PDF and ePub downloads, according to the available data) and Abstracts Views on Vision4Press platform.
Data correspond to usage on the plateform after 2015. The current usage metrics is available 48-96 hours after online publication and is updated daily on week days.
Initial download of the metrics may take a while.