Fig. 8.
Download original image
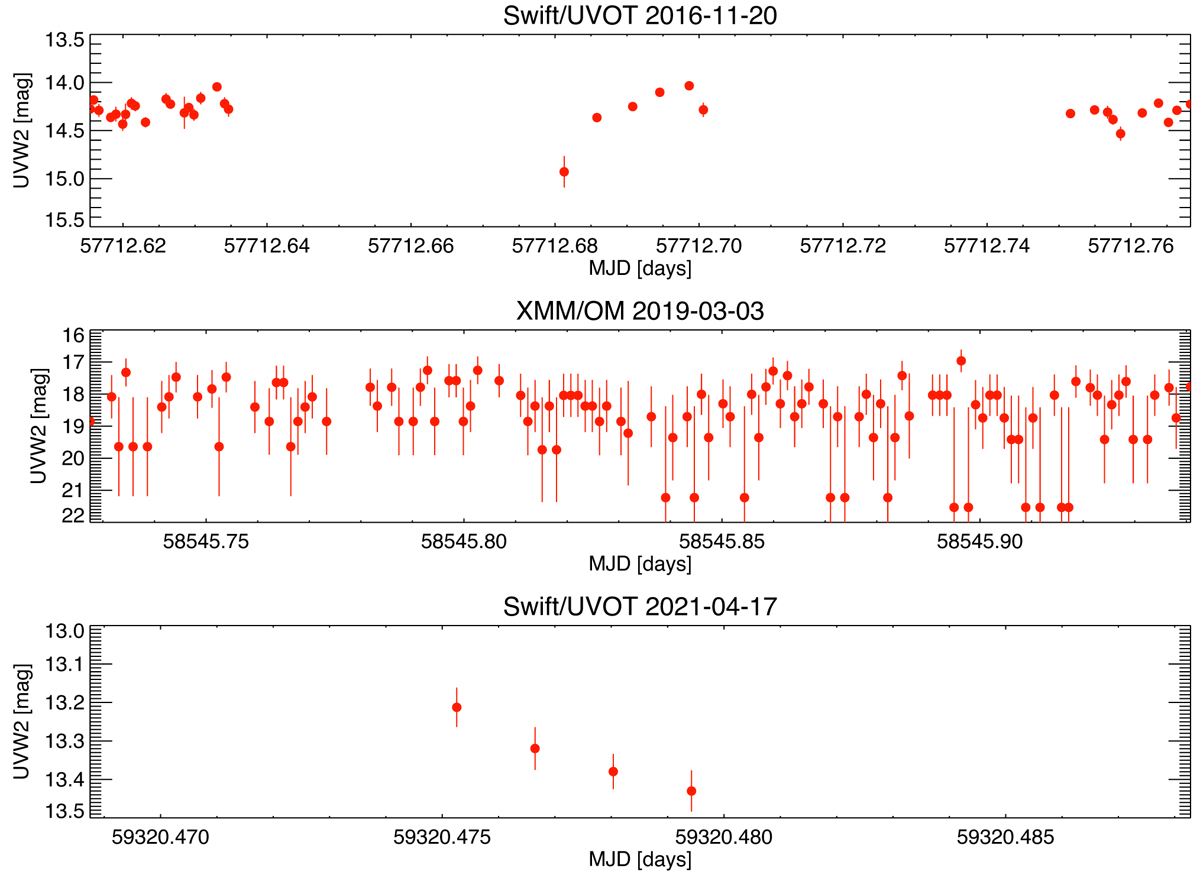
UVW2 Swift/UVOT and XMM-Newton/OM light curves with 120 s bins. The UVOT light curves from dates outside the low-flux optical state (years 2016 and 2021; top and bottom panels) show strong variability, whereas the light curve from the 2019 XMM-Newton/OM observation (middle panel) shows a much fainter source with no significant variability.
Current usage metrics show cumulative count of Article Views (full-text article views including HTML views, PDF and ePub downloads, according to the available data) and Abstracts Views on Vision4Press platform.
Data correspond to usage on the plateform after 2015. The current usage metrics is available 48-96 hours after online publication and is updated daily on week days.
Initial download of the metrics may take a while.