Fig. 4.
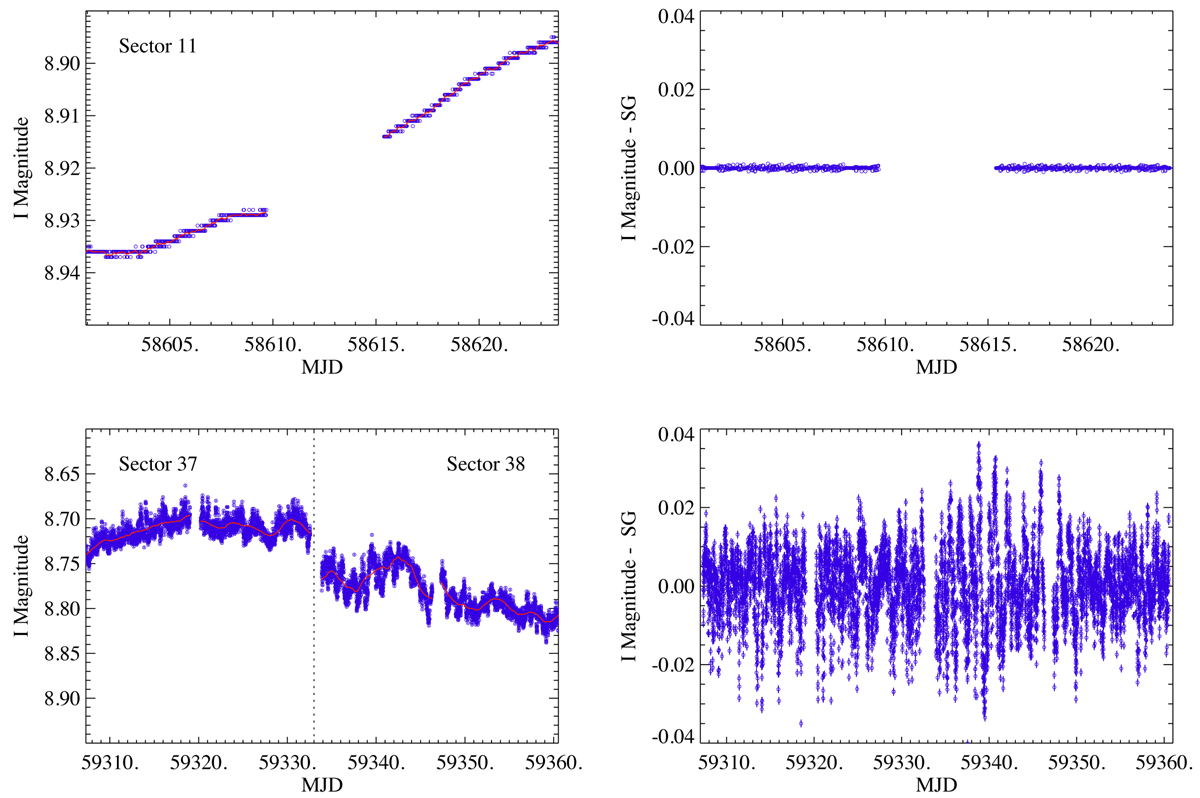
Download original image
TESS light curves of the observations obtained during Sector 11 in 2019 with a 30 m cadence (top row), and the light curves from observations obtained during Sectors 37 and 38 in 2021 with a 10 m cadence (bottom row). The vertical dashed line in the lower left-hand plot marks the separation between Sectors 37 and 38. In the right-hand panel, each portion of the light curve of each sector has a SG filter (red line in the left panels) subtracted from it to enable the study of short-term, flickering-type variability. Variability on timescales shorter than 10 min (in Sectors 37 and 38) or 30 min (in Sector 11) cannot be detected. In addition, the measurement errors (0.001 mag) are larger than the observed dispersion; no short-term variability can be detected.
Current usage metrics show cumulative count of Article Views (full-text article views including HTML views, PDF and ePub downloads, according to the available data) and Abstracts Views on Vision4Press platform.
Data correspond to usage on the plateform after 2015. The current usage metrics is available 48-96 hours after online publication and is updated daily on week days.
Initial download of the metrics may take a while.