Open Access
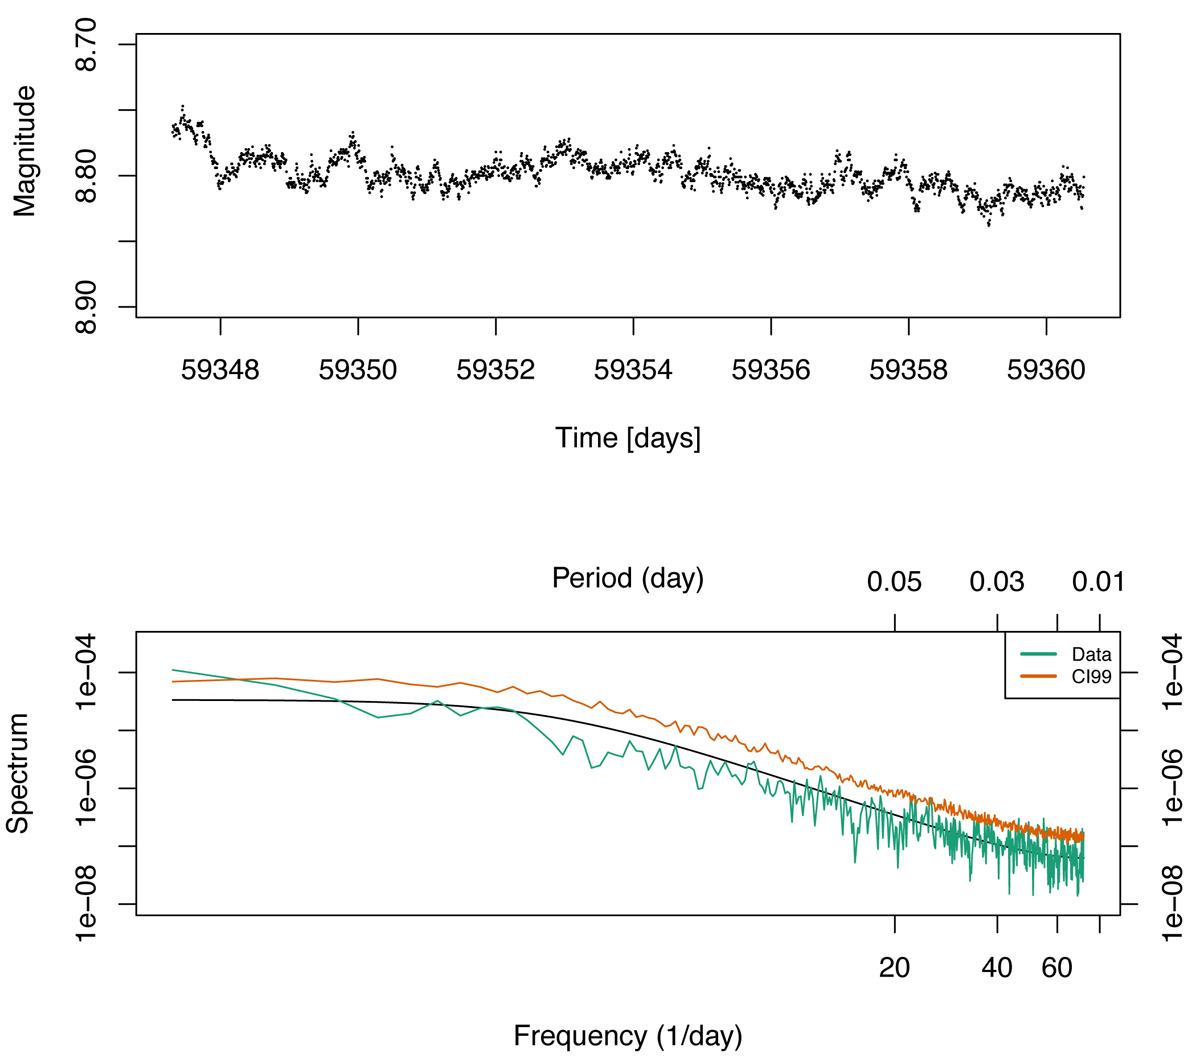
Fig. 7.
Download original image
Search for periodicities in the TESS light curves. Top: TESS light curve of the second half of Sector 38. Bottom: Lomb-Scargle power spectrum (green line) with red noise model (black line) and detection levels at 3σ (orange).
Current usage metrics show cumulative count of Article Views (full-text article views including HTML views, PDF and ePub downloads, according to the available data) and Abstracts Views on Vision4Press platform.
Data correspond to usage on the plateform after 2015. The current usage metrics is available 48-96 hours after online publication and is updated daily on week days.
Initial download of the metrics may take a while.