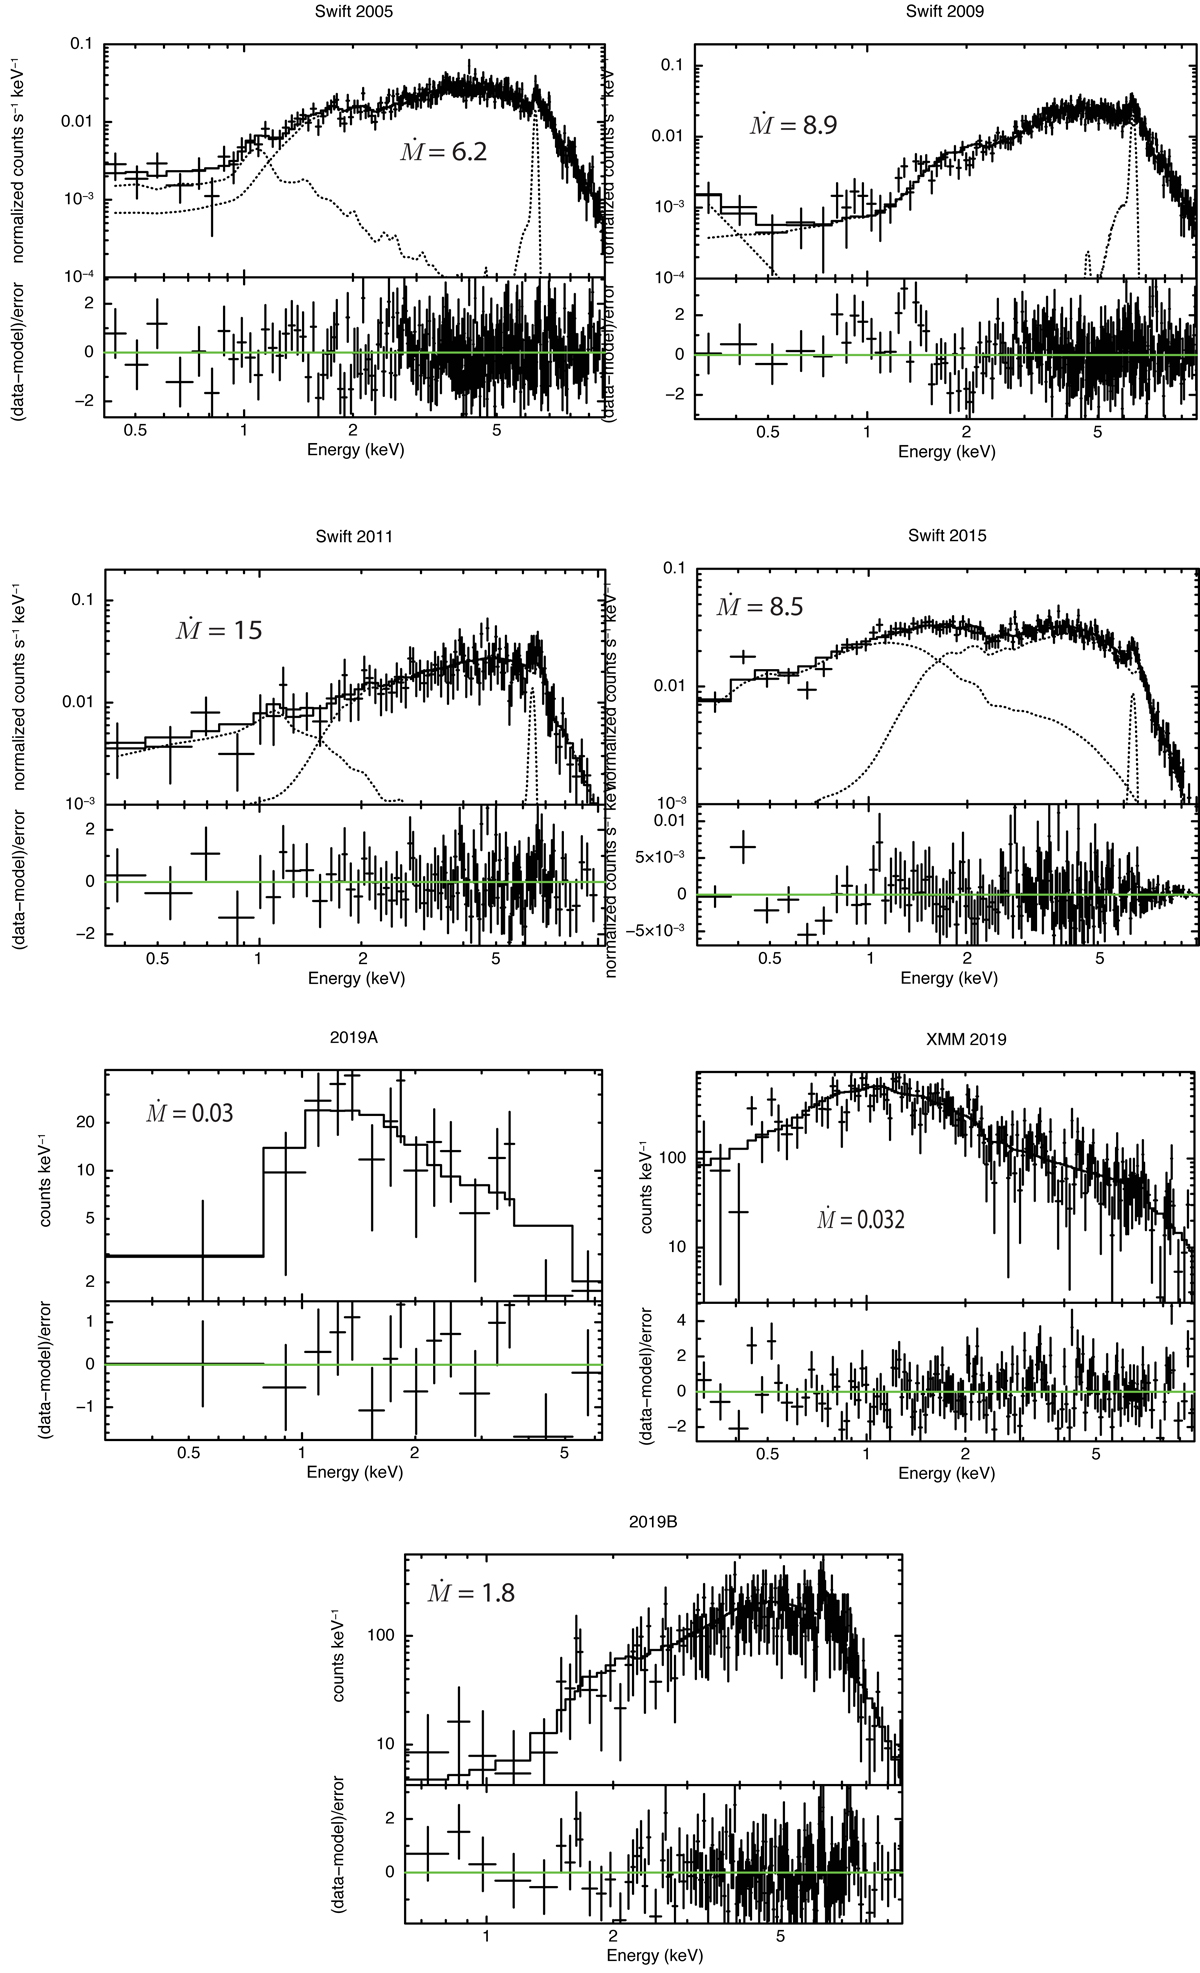
Fig. 9.
Download original image
X-ray spectral evolution between 2005 and 2022, as revealed by XMM-Newton and Swift. The solid curves in the top portion of each panel are the best-fit models, while dotted lines show the contribution of each spectral component in the cases where more than one spectral component was needed to model the spectrum (see Sect. 3.3). Each panel lists the accretion rate through the optically thin boundary layer (Ṁ, in units of 10−9 M⊙ yr−1). The resulting fit parameters are listed in Table 1. The spectra taken in 2019 with Swift and XMM-Newton clearly show a decrease both in absorption and accretion rate.
Current usage metrics show cumulative count of Article Views (full-text article views including HTML views, PDF and ePub downloads, according to the available data) and Abstracts Views on Vision4Press platform.
Data correspond to usage on the plateform after 2015. The current usage metrics is available 48-96 hours after online publication and is updated daily on week days.
Initial download of the metrics may take a while.