| Issue |
A&A
Volume 670, February 2023
|
|
|---|---|---|
| Article Number | A94 | |
| Number of page(s) | 16 | |
| Section | Stellar structure and evolution | |
| DOI | https://doi.org/10.1051/0004-6361/202244046 | |
| Published online | 10 February 2023 | |
V4142 Sgr: Double periodic variable with an accretor surrounded by the accretion disk’s atmosphere⋆
1
Main Astronomical Observatory, National Academy of Sciences of Ukraine, 27 Akademika Zabolotnoho St, 03680 Kyiv, Ukraine
2
Departamento de Astronomía, Universidad de Concepción, Casilla 160-C, Concepción, Chile
e-mail: This email address is being protected from spambots. You need JavaScript enabled to view it.
3
Department of Physics, North-West University, Private Bag X2046, Mmabatho 2735, South Africa
4
Astronomical Observatory, Volgina 7, 11060 Belgrade 38, Serbia
5
Isaac Newton Institute of Chile, Yugoslavia Branch, 11060 Belgrade, Serbia
6
Centro de Investigación DAiTA Lab, Facultad de Estudios Interdisciplinarios, Universidad Mayor, Alonso de Córdova 5495, Santiago, Chile
7
Instituto de Física y Astronomía, Universidad de Valparaíso, Av. Gran Bretaña 1111, Casilla, 5030 Valparaíso, Chile
Received:
18
May
2022
Accepted:
11
September
2022
Abstract
Context. A detailed study of the close interacting binary V4142 Sgr, based on photometric and spectroscopic analyses, indicates that this system belongs to the enigmatic class of Algol-like variables exhibiting a long photometric cycle of an unknown nature.
Aims. By performing photometric data-mining and spectroscopic observations covering the orbital cycle, we obtained the orbital parameters and the stellar properties of the binary system, along with the physical properties of the accretion disk located around the hot star. In addition, we gained insights into the evolutive path of the system.
Methods. We modeled the light curve through an inverse method, using a theoretical light curve of the binary system that considers the light curve contribution of both stars and the accretion disk of the hot star to obtain the fundamental parameters. To constrain the main stellar parameters, the mass ratio was fixed in addition to the donor temperature, using the obtained values from our spectroscopic analysis, which includes deblending methods to isolate the spectral lines of the stellar components. The system parameters were compared with a grid of binary star evolutive models in order to gain insights into the evolutionary history of the system.
Results. The orbital period and the long cycle were re-calculated, with the following result: 30d.633 ± 0d.002 and 1201 ± 14 days. The spectral analysis reveals Hα double emission with a persistent V ≤ R asymmetry, which is considered evidence of a possible wind emerging from the hotspot region. In addition, a cold and evolved donor star of Md = 1.11 ± 0.2 M⊙, Td = 4500 ± 125 K and a Rd = 19.4 ± 0.2 R⊙ as well as a rejuvenated B-dwarf companion of Mg = 3.86 ± 0.3 M⊙, Tg = 14 380 ± 700 K, and Rg = 6.35 ± 0.2 R⊙ were found. The gainer is surrounded by a concave and geometrically thick disk, creating its own atmosphere around the main component of a radial extension, ℛd = 22.8 ± 0.3 R⊙, contributing ∼1.4 percent of the total luminosity of the system at the V-band at orbital phase 0.25. The disk is characterized by a hot-spot roughly placed where the stream hits the disk and an additional bright-spot separated 102.° 5 ± 0.° 04 degrees along the disk edge rim in the direction of the orbital motion. The system is seen under an inclination of 81.° 5 ± 0.° 3 and at a distance of dGaia = 1140 ± 35 pc. Doppler maps of the emission lines reveal sites of enhanced line emission in the second and third velocity quadrants. The former would correspond to a hotspot and the latter to a bright spot detected by the light curve analysis. We find that the system comes from an initially shorter orbital period binary that inverted its mass ratio due to mass exchange. A plausible model scenario indicates that, at present, the K-type giant should have been depleted of hydrogen in its core, while the companion would have gained about 2 M⊙ through a process lasting about 2 Myr.
Key words: binaries: eclipsing / binaries: spectroscopic / stars: early-type / circumstellar matter / stars: fundamental parameters / stars: mass-loss
Data are only available at the CDS via anonymous ftp to cdsarc.cds.unistra.fr (130.79.128.5) or via https://cdsarc.cds.unistra.fr/viz-bin/cat/J/A+A/670/A94
© The Authors 2023
 Open Access article, published by EDP Sciences, under the terms of the Creative Commons Attribution License (https://creativecommons.org/licenses/by/4.0), which permits unrestricted use, distribution, and reproduction in any medium, provided the original work is properly cited.
This article is published in open access under the Subscribe-to-Open model. This email address is being protected from spambots. You need JavaScript enabled to view it. to support open access publication.
1. Introduction
Since their discovery, Algol-like close binaries dubbed “double periodic variables” (DPVs) have acquired a predominant role in the study of different mechanisms proposed to explain the second photometric variability reported by Mennickent et al. (2003). The long-cycle length, on average about 33 times longer than the orbital period (Mennickent 2017), was observed for the first time globally in a group of blue variable stars in the Magellanic Clouds; however, the long-cycle phenomenon was already reported in some historic Algol stars. A famous example is β Lyrae, with an orbital period of 12 9 increasing at a rate of 19 s yr−1 (Harmanec & Scholz 1993) and a long cycle of 275 days (Guinan 1989).
Further research has highlighted the constant nature of their orbital periods as a property of the DPVs. This is a feature observed in most of these binaries, which does not occurr in Algol stars undergoing strong mass transfer driven by Roche lobe overflow (RLOF; Garrido et al. 2013). In particular, β Lyrae is almost unique among the DPVs and seems to contradict the almost universal constancy of the orbital period that characterizes these objects. The constancy of the orbital period is puzzling considering that under conservative mass transfer due to RLOF, a change in period ought to be detected. One possible explanation is that these binaries are in a mildly non-conservative mass transfer stage (Mennickent et al. 2008; van Rensbergen et al. 2008a, 2011; Garrido et al. 2013), as has also suggested by some models so far (Rosales et al. 2019; San 2019).
A second photometric variability in Algol-type stars is not something new, although it was already reported in β Per by Soderhjelm (1980). Years later, Sarna et al. (1997), Meintjes (2004) and Peterson et al. (2010) attempted to explain the second observed photometric variability through a mechanism of cyclical magnetic activity produced in the outer convective zone of the cold star, which would cause changes in the orbital period on a ten-year scale. Since then, new studies have begun to consider the possibility of the existence of dynamos in some Algol-type variables. Following this line of reasoning, Schleicher & Mennickent (2017) proposed an explanation for the long cycles of the DPV based on magnetic cycles of the most evolved star, considering that the Applegate mechanism (Applegate & Patterson 1987) would be expected to induce cyclic changes in the donor equatorial radius and, therefore, in the mass transfer rate. Evidence of such a dynamo was reported in the DPV V393 Sco by Mennickent et al. (2018) and explored in the evolutionary track of V495 Centauri through numerical simulations (Rosales 2018; Rosales et al. 2019). The first demonstration of the importance of the MHD dynamo for the stellar structure was provided by Navarrete et al. (2020) through a 3D MHD simulation.
The few DPV models that have been studied thus far reveal a semidetached binary system with a hot star of B-type rejuvenated and surrounded by an optically thick accretion disk (dubbed the gainer) that accumulates matter from the less massive and evolved star (dubbed the donor) and that is commonly observed as a giant of A/F/G type (Mennickent et al. 2016; Mennickent 2017). In addition, a cyclically variable bipolar wind modulated by the long cycle was reported in V393 Scorpii by Mennickent et al. (2012a), said to be reminiscent of the bipolar wind reported in β Lyrae (Harmanec et al. 1996). These investigations gave rise to questions on the role of mass loss in these systems. Thus, the study of these systems will improve the understanding of the complex evolutionary path involving the phase of mass exchange, stellar winds, mass-loss, and stellar dynamo in semidetached stars.
In this work, we present a study of an interacting close binary system that belongs to the group of the DPVs with the longest orbital periods, a sample that has not been well studied thus far. The eclipsing interacting binary V4142 Sgr, according to ASAS1 is classified as eclipsing Algol detached (EA/DS) binary and named ID 180745-2824.1, with equatorial coordinates α2000 = 18 : 07 : 45 and δ2000 = −28 : 24 : 06, and with V = 10.94 ± 0.04 mag, Vamp = 2.019 ± 0.05 mag (Pojmanski 1997). It was classified as a DPV by Mennickent & Rosales (2014), who found a long photometric cycle of 1206 days, resulting in the second one having the longest period among Galactic DPVs up to that point (Fig. 1). In addition, according to SIMBAD (Wenger et al. 2000)2 this object is an eclipsing binary of Algol type of V = 10.95 ± 0.04 mag, and its distance based on Gaia DR3 (Gaia Collaboration 2018a,b)3 is dGaia = 1140 ± 35 pc. In this study, we determine for the first time the fundamental stellar and orbital parameters of this system and contribute to the general understanding of DPVs.
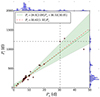 |
Fig. 1. Orbital and long period of Galactic DPVs, see the text for more details. Shaded region limits the 90% confidence boundary. |
In Sect. 2, we present a photometric analysis of V4142 Sgr. In Sect. 3, a spectroscopic analysis is presented, including a Doppler tomography study of emission lines. In Sect. 4, the orbital and physical parameters of the system based on the light curve model, including the light contribution of both stars and an accretion disk, are also revealed. Stellar luminosities, radii, temperatures, surface gravities, masses, and the system’s inclination were obtained. We provide a discussion of our results in Sect. 5. Finally, the main results of the present investigation are summarized in Sect. 6.
2. Photometric analysis
2.1. All Sky Automated Survey (ASAS)
In this section we re-analyzed the ASAS photometric data for V4142 Sgr, considering the 806 better-quality data points labeled as “A-type” and rejecting all outlier points. For this purpose, the data were grouped in a histogram of 50 bins and it was noted that this photometric time series shows an average apparent magnitude, VASAS = 10.939 ± 0.04 mag, with a positive skew distribution and a tail towards faint magnitudes that corresponds to measured magnitudes during the primary and secondary eclipse (see Fig. 2), with a range approximately from 11.07 to 12.80 mag, namely, if the primary and secondary eclipses were less deep, then the skews would be much smaller.
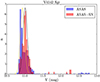 |
Fig. 2. Histogram of magnitude for V4142 Sgr using 50 bins for 806 ASAS A-type data, showing a positive skew distribution. The dashed red line corresponds to a normal distribution of 806 random data with a mean μ = 10.939 mag and sigma σ = 0.06 mag. |
In addition, we decided to strengthen the analysis for the orbital period using the phase minimization dispersion (PDM) code of IRAF (Stellingwerf 1978). Initially, the errors were computed through visual inspection of the light curve phased with trial periods close to the minimum of the periodogram until the light curve decreased its dispersion. Despite that the method gives us reliable results for the orbital period, it lacks the accuracy to estimate the errors. Therefore, we decided to apply the generalized Lomb-Scargle periodogram (GLS; Zechmeister & Kürster 2009) algorithm, in order to strengthen the result and handle adequately the errors; hence, we obtained an orbital period of  . This value coincides and confirms the result from Mennickent & Rosales (2014). The GLS method has been sucesfully applied to photometric time series in the past, for instance, when studying the rotation and differential rotation of active Kepler stars (Reinhold et al. 2013).
After obtaining the orbital period more accurately determined, a second analysis was carried out to determine the so-called “long cycle.” For that, an algorithm was used to disentangle multi-periodic light curves, written by Zbigniew Kolaczkowski, which has been used for previous disentangling analyses (Mennickent et al. 2012a, 2015; Rosales 2018). The code adjusts the light curve with a Fourier series consisting of fundamental frequencies plus their harmonics. The orbital frequency was computed previously, using PDM for our best value. Since the light curve of an eclipsing binary has a more complex nature than a sinusoidal form, it has been emphasized that the use of a few harmonics is not applicable, as the fit depends on the form of the light curve. Thus, a great number of harmonics is needed between 12 and 15 to adequately fit the light curve of an eclipsing binary. Further details of the code can be found in Mennickent et al. (2012b).
The main frequency, f1, (the orbital one) is used in an algorithm for a least-squares fit over the light of a sum of sinus functions of variable amplitudes and phases representing the main frequency and their additional harmonics. Afterwards, we analyzed the residuals to find another periodicity or frequency, f2. Furthermore, the new harmonics and main frequencies were included in the new fitting procedure to obtain the best light curve based on Fourier component frequencies considering both periods. Thus, in the applied deconvolution method on the light curve, we got an orbital frequency of fo = 0.0326445337 d−1 and other fl = 0.0008291874 d−1 for the long cycle. So, in this way, we disentangled both light curves, as shown in Fig. 3. The disentangled light curve with the new orbital period revealed an orbital modulation typical of an eclipsing binary with rounded inter-eclipse regions including proximity effects and a computed amplitude of 2.107 ± 0.057 mag, while the long cycle is characterized by a quasi-sinusoidal variability and typical of the rest of DPVs, whose amplitude in the V-band of 0.192 ± 0.003 mag is around of ∼9 percent with respect to the total brightness. The EA classification provided by ASAS is probably due to the long period and large differences between the main and secondary minimum, but the light curve can easily be classified as EB (i.e., β-Lyrae type) as well, considering the rounded inter-eclipse sections. The aforementioned procedure revealed the following ephemerides for the light curve:
 (1)
(1)
 (2)
(2)
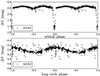 |
Fig. 3. V4142 Sgr ASAS V-band light curve after disentangling. Orbital (top) and long cycle phase (bottom) are phased according to times of the light curve minimum and maxima, given by Eqs. (1) and (2). |
These are used for spectroscopic analysis in the rest of the present work.
2.2. All-Sky Automated Survey for Supernovae (ASAS-SN)
It was decided to reinforce the results obtained in the previous section (Sect. 2), adding a data set from the ASAS-SN Variable Stars Database4 (Shappee et al. 2014; Kochanek et al. 2017; Jayasinghe et al. 2019), whose images in the V-band photometry were obtained through a two-pixel (16″) radius aperture, in contrast to the three pixels (15″) used by ASAS. For this purpose, a second analysis of the 157 data points was carried out using PDM and their errors were estimated through the same GLS algorithm used in the previous section. In addition, during a comparison between data from ASAS and ASAS-SN, we noticed a morphological difference in the shape and amplitude of the light curve during the primary eclipse (see Fig. 4). The range covered by the data is 893 days.
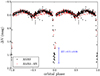 |
Fig. 4. ASAS and ASAS-SN V-band light curves comparisons phased using the orbital period Po = |

For the disentangling method applied on the ASAS-SN light curve, we used the same frequency for the orbital cycle as in the previous section. The obtained results agree and confirm the obtained values with ASAS; we get an orbital period of  and an amplitude of Ao = 1.47 ± 0.03 mag. In addition, the comparison between long cycles showed no morphological changes as occurred during the orbital cycle. The long cycle has an amplitude Al = 0.266 ± 0.006 mag, corresponding to ∼18 percent of the total brightness.
2.3. Multiband photometry
So far, the only references to the V-band analysis come from ASAS and ASAS-SN. Thus, a search of photometric data in ExoFOP-TESS5 (Akeson & Christiansen 2019) was performed for other bands and we summarize a series of these in Table 1. The observed mean color was computed using the Wide-field Infrared Survey Explorer (WISE) Wright et al. (2010), with the following result: W2 − W3 = 0.079 ± 0.024 mag and W3 − W4 = 0.589 ± 0.088 mag. We find the system does not show a color excess in the WISE photometry.
Summary of photometric data for V4142 Sgr at different band passes.
Furthermore, a data comparison was carried out using Two Micron All Sky Survey (2MASS) Skrutskie et al. (2006) and the work by Mennickent et al. (2016), which features a comparison of systems with circumstellar envelopes, namely Be-stars, the rapidly rotating B-type with circumstellar disk, and includes DPVs and others. The computed differences for V4142 Sgr by means of 2MASS J − H = 0.575 ± 0.037 mag and H − K = 0.192 ± 0.032 mag show a color excess in the JHK photometry. The J − H color fits a single star of temperature around ∼5000 K while the H − K excess could be interpreted as evidence of circumstellar material (see Fig. 5). In both cases, we have not accounted for extinction and not corrected the color, since the correction is expected to be insignificant at these wavelengths.
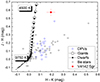 |
Fig. 5. 2MASS J − H versus H − K color-color diagram for V4142 Sgr and other systems with/out circumstellar matter. For more detail of data collection see Mennickent et al. (2016). |
3. Spectroscopic analysis
In this section, information about the spectroscopic data acquisition and a detailed description of the analysis is also provided, as well as the study of radial velocities, the spectral decomposition, and information on the obtained results.
3.1. Spectroscopic observations
To investigate the fundamental properties of the DPV V4142 Sgr, a series of 16 spectra with a resolving power of R ∼ 27 000 (fiber mode) was collected with the CHIRON spectrograh (Tokovinin et al. 2013; Paredes et al. 2021; Proposal ID CN2018A-4) mounted at the SMARTS 1.5 meter telescope, located in Cerro Tololo Interamerican Observatory. The covered spectral region is from 4500 Å to 8500 Å, with a mean signal-to-noise ratio (S/N) of ∼92. The observations were conducted during the maximum of the long cycle and cover relatively well the orbital cycle (see Table 2).
Summary of spectroscopic observation using CHIRON spectrograph mounted on the SMARTS-1.5 m Telescope.
The correction with flat and bias, wavelength calibration, and order merging was carried out with IRAF. In addition, all spectra to the continuum were normalized and corrected to the heliocentric rest frame. No flux calibration of the spectra was needed since this has no effect for the line strength measurements and radial velocities, since the analyzed spectra were normalized to the continuum, thus, the flux in absolute terms was not considered and every intensity is in units of the intensity of the continuum. In addition, the equivalent width by definition does not depend on the flux calibration and these can be defined in spectra normalized to the continuum and the measure of radial velocities, too. Hence, a flux calibration is not needed for the present purposes.
3.2. Radial velocities
The first step to determining the fundamental properties of the DPV V4142 Sgr is to measure the radial velocities (RVs) of both stellar components. For this purpose, a set of absorption lines that represents the movements of both stars was identified, with the primary and hotter star dubbed the “gainer” and the secondary and cooler star as the “donor”.
The O I (8446.335 Å) was selected as a characteristic absorption-line of the gainer star (see Table 3) since it represents its movement and it is easily identifiable visualy between other lines such as N III (4514.89 Å), Ti II (4571.971 Å), Hα (6562.817 Å), and O I (7771.96 Å). In order to measure the RVs of the donor star, we used the Fourier cross-correlation tool (fxcor) of IRAF between the range from 4500 to 6000 Å; in this way we obtained the relative velocities listed in Table 4.
Radial velocities of the gainer and their respective errors, using the O I (8446.35 Å) line.
Radial velocities of the donor and their respective errors, using the Fourier cross-correlation process.
The RVs of donor and gainer star were fitted using a sine function (f(x) = a + bsin(2πx)) through a Marquart-Levenberg (Marquardt 1963) method, a non-linear least squares fit, and their respective errors were obtained through an iterative succession of local linearization. The amplitude of the radial velocity variation of donor, Kd = 89.2 ± 0.5 km s−1, and a zero point of 0.00 ± 0.47 km s−1 were computed; whereas that for the gainer, we computed an amplitude of Kg = 25.56 ± 1.20 km s−1 and a zero point of 0.00 ± 0.86 km s−1 (Fig. 6). However, a lag for RVs of the gainer was noted, which could be interpreted as the effect of the brightness contribution from the accretion disk or bright spot. In addition, we get a system mass ratio q = Kg/Kc = 0.287 ± 0.047.
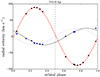 |
Fig. 6. Radial velocities for donor (black-dots) through fxcor process and gainer star (blue-dots) using O I (8446.35 Å) measured by Gaussian fits. The best sinusoidal fits are shown for both orbits. The smoothed blue line corresponds to the RVs of the gainer star without lag. |
To obtain the orbital parameters of V4142 Sgr, a public subroutine based on a generic algorithm called PIKAIA (Charbonneau 1995) was used. It is a heuristic search technique that incorporates, in a computational setting, the biological notion of evolution by means of natural selection, that is, the algorithm determines the single parameter set which minimizes the difference between the model’s predictions and the data. Thus, to obtain the solution for radial velocities and Keplerian orbits, the algorithm finds the best parameters through a chi-square minimization:
 (3)
(3)
the factor (N − 6) of the above equation corresponds to the number of freedom degree of the fit,  is the observed radial velocities in the dataset, while the V(tj; Po, τ, ω, e, Kd, γ) is the theoretical radial velocities at the time, tj, which depends on the following six parameters; wherein Po represents the orbital period, τ is the time of passing through the periastron, ω is the periastron longitude, e is the orbital eccentricity, Kd the half-amplitude of the radial velocity, γ the system’s radial velocity, and the associated error estimate is σj. Thus, the theoretical radial velocities are based and computed via Eq. (2.45) given by Hilditch (2001):
 (4)
(4)
To solve Eq. (4), it is necessary to compute the true and eccentricity anomaly, E. However, E does not have an analytic solution and thus it is necessary implement an iterative method to solve it. Instead, it is possible to find a solution for the true anomaly θ and solve the above equation (Eq. (4)). For more details, we refer to the steps and equations described in Rosales et al. (2021).
Since the analysis of the 806 data points of the obtained magnitudes from ASAS photometry provide us with a much more accurate orbital period than the analysis of the 16 CHIRON spectra, we decided to fix the orbital period computed from the photometric analysis (Sect. 2) at the moment when PIKAIA is used as well as during the Monte-Carlo simulation to estimate the errors. It is supported because the absolute error for Monte-Carlo simulation increases as  , revealing the importance of a large data set alongside the homogeneous sampling of the orbital phase. We present the orbital parameters in Table 5. It has been noted that the eccentricity solution for V4142 Sgr shows a circular orbit, but for a 1σ error, this solution is still allowed (Fig. 7).
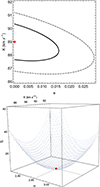 |
Fig. 7. Representation of χ2 distribution in the K − e plane computed through Montecarlo simulation (top). The solid-black and dashed-gray lines correspond to 1σ and 2σ iso-contours, and the red dot indicates the minimum χ2 solution. Contour corresponding to the Δχ2 that includes 68.3% of the probability (bottom). |
3.3. Spectral disentangling
Due to its binary nature, V4142 Sgr presents a series of composed absorption lines into spectra. Therefore, we decided to remove or separate both components in order to analyze the main features of the donor and gainer star. We disentangled every spectrum through an iterative method proposed by González & Levato (2006). Briefly, using a Doppler correction, each spectrum is corrected for its theoretical radial velocity obtained in the previous section (Sect. 3.2). Then a combination of these spectra is made, generating a template for the flux contribution that comes from a single star but is still slightly contaminated by its partner. This process must be repeated with the other star and thus generates the first templates for each stellar component. These first templates are subtracted from each spectrum to eliminate the individual contribution of each star. In the next iteration, the previous steps will be repeated, generating new templates and subtracting so successively until convergence and a clean average spectrum for both components can successfully be obtained. However, it must be emphasized that the disentangling method for the gainer and an accretion disk will not be possible since there are no available models for disk spectral lines.
After removing and obtaining the isolated spectra, the presence of a prominent double peak emission for the Hα profile of the gainer star was noted. This evidence suggests us the existence of a circumstellar accretion disk and supports the interacting binary nature of the system (see Fig. 8). Using the peak separation, we calculated that a particle located on the accretion disk rim would have a velocity of Vp = 170.4 ± 45.7 km s−1. Another interesting but not usual characteristic is the predominant persistence of the red-peak of the emission, during all observed spectra. Normally, the interacting binary stars show variations of the relative intensities on the emission peaks. Thus, this could be interpreted as an effect of the gas stream on the gainer star or a wind emerging probably from the hotspot region (Fig. 9). Despite the fact that the amount of Hα red-peak emission is large compared with the blue side peak, it is not something completely new among DPVs, because this was reported for the DPV V495 Centauri by Rosales (2018). The same V < R characteristic was found in other Balmer lines in V 4142 Sgr.
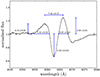 |
Fig. 8. Average Hα profile with their respective sizes. The widths of their emissions peaks and their absorption profile were measured at the height of the continuum. |
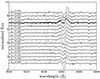 |
Fig. 9. Behaviour of Hα profile sorted by orbital phases and centered at 6562.817 Å for comparing the red-peak emission. The observed spectra show the donor and gainer flux contribution, i.e., these were not disentangled. |
We quantified the ratio V/R of the Hα profile commonly defined as the ratio between the peak relative intensities to the normalized continuum V/R = (Iv − 1)/(Ir − 1), and a non-cyclical variation was noted, where the maximum values are in the second quadrature (Fig. 10, center). The equivalent width (EW) shows a cyclical variation, which varies during the orbital period. Thus, through a Marquart-Levenberg non-linear least squares function, a sinusoidal function was fit through a fixed period of 0.5Po and obtained a half amplitude of 0.63 ± 0.08 Å (Fig. 10, dashed blue line). However, to strengthen the fit and the results we decided to implement the GLS algorithm and this revealed a period of  and an amplitude of AEW = 0.75 ± 0.05 Å (Fig. 10, continuous green line).
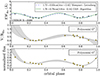 |
Fig. 10. Equivalent width of Hα profile from gainer star during a complete orbital phase with donor contribution subtracted, using the CHIRON spectrograph (top). The dashed blue line corresponds to a Marquart-Levenberg fit using a fixed period 0.5Po and the continuum green line represents a GLS fit with a free period, revealing a period of |

3.4. Determination of secondary component physical parameters
After the disentangling the donor and gainer star described in the previous section (Sect. 3.3), we determined the physical parameters of both components. We compared the observed with a grid theoretical spectra to find the best fit and identify the physical parameters. A grid of synthetic spectra was constructed, modeling the stellar atmosphere through SPECTRUM6 code (Gray et al. 2001; Gray & Corbally 1994), where the model atmospheres are provided by ATLAS9 (Castelli & Kurucz 2003) in local thermodynamic equilibrium (LTE).
Therefore, a grid was constructed for the donor star with different free parameters such as effective temperature (Teff), surface gravity (log g), macro-turbulence velocity (vmac.), micro-turbulence velocity (vmic.), and rotational velocity (v sin i), and even the veiling factor (η) as well. This last parameter corresponds to a constant of proportionality between the theoretical spectrum and the observed due to the light contribution from its companion, which has veiled the absorption lines. All spectra were constructed using a metallicity index similar to the sun and a fixed mixing length parameter l/H = 1.25 by default from the grid, which corresponds to the disruption and dispersion of the blobs that travel in a convecting fluid during a “l” distance from their equilibrium position in an atmosphere of scale height, H.
A chi-squares optimization algorithm was implemented, which consists in the minimization of the deviation between the theoretical normalized and the observed average spectrum of the donor. The theoretical model was produced varying the previous mentioned parameters of the following way; the effective temperature varies from 3500 ≤ Td ≤ 9000 K, with a step of 250 K, the surface gravity varies from 0.0 ≤ log g ≤ 5.0 dex, with step of 0.5 dex, the macro turbulence velocity varies from 0 ≤ vmac. ≤ 10 km s−1, with steps of 1 km s−1, whereas the micro-turbulence velocity there is 0.0 and 2.0 km s−1, the rotational velocity is 10 ≤ v sin i ≤ 150 km s−1, with steps of 10 km s−1, and the veiling factor 0.0 ≤ η5400−5700 Å ≤ 1.0, with steps of 0.1. The implemented method converged successfully to a minimum chi-square at Td = 4500 ± 125 K, log g = 2.5 ± 0.125 dex, vmac. = 1.0 ± 0.25 km s−1, vmic. = 2.0 km s−1, v sin i = 20 ± 5 km s−1, and η = 0.3 ± 0.05 for six freedom degrees and with a best value of  (see Figs. 11–13).
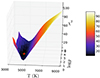 |
Fig. 11. Surface color map of chi-square analysis for the donor star. The best model converges with a χ26 = 10.822 and it is represented by a red dot and their respective errorbars at Td = 4500 ± 125 K and log g = 2.5 ± 0.125 dex. |
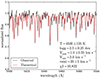 |
Fig. 12. Comparison between the disentangled observed (black) and theoretical (red) spectrum of the donor star and η5400−5500 Å = 0.3. |
 |
Fig. 13. Detailed comparison between the best theoretical model using a veiling factor η5500−5700 Å = 0.3 (red-line) and the average observed spectrum (black-line) for the donor star. |
3.5. Temperature indicators
To date, the temperature indicators have been entirely useful in examining some DPV stars which tend to be biased or veiled by other flux contributions. These indicators are considered indispensable in the spectroscopic investigations, such as: He I 4471 Å, Mg II 4482 Å, Fe II 4128.735 Å, or Si II 4130.884 Å. However, it is not always possible to find them close to wavelengths around the visual. Despite that, there is other indicators like O I 7771.96 Å (3s5S0 − 3p5P, multiplet 1) used by Takeda (1992), Takeda & Sadakane (1997), Takeda et al. (2008) and Takeda & Honda (2016) for studying the behavior of microturbulence velocity, abundances, and rotational efficiency in B,A, and F-type stars.
On this basis, the O I 7771.96 Å multiplet was identified in the present spectra without any disentangling (Fig. 14). Thus, to estimates the temperature of the gainer star, we performed the procedure of Sect. 3.4 to the average spectrum of the gainer star. This consists of a minimization of the deviation between the theoretical LTE normalized and the observed average spectrum of the gainer, performed in the range from 7700 Å to 7800 Å. The theoretical models were constructed by varying the physical parameters of the following way; the effective temperature is composed for two group 8000 ≤ Tg ≤ 11 000 K, with a step of 250 K, and from 11 000 ≤ Tg ≤ 25 000 K, with a step of 1000 K; while the surface gravity runs from 0.0 ≤ log g ≤ 5.0 dex, with steps of 0.5 dex, the macroturbulence velocity varies from 0 ≤ vmac. ≤ 10 km s−1, with steps of 1 km s−1, and the microturbulence velocity was analyzed for 0.0 and 2.0 km s−1, while the rotational velocities vary from 10 ≤ v sin i ≤ 150 km s−1, with steps of 10 km s−1 and finally the veiling factor varies from 0.0 ≤ η7700−7800 Å ≤ 1.0 with steps 0.1 (dimensionless).
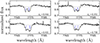 |
Fig. 14. Oxygen absorption line O I 7771.96 Å (3s5S0 − 3p5P, multiplet 1) of observed spectra (without donor contribution) at different orbital phases, showing the triplet. |
The theoretical LTE model converged successfully for a minimum chi-square  for a effective temperature of 8000 ± 125 K, a surface gravity of 1.0 ± 0.25 dex, a macro-turbulence velocity of 1.0 ± 0.25 km s−1, the micro-turbulence of 2.0 km s−1, a rotational velocity of 40 ± 5 km s−1, and a veiling factor of η7700−7800 Å = 0.9 ± 0.05 (see Fig. 15). We notice the emission shoulders in the blue (orbital phases 0.6 and 0.7) and red (orbital phases 0.0 and 0.2) wings in Fig. 14 and also in Fig. 15. We interpret these emissions as true spectral features probably signatures of the circumstellar matter around the gainer. Similar emission wings with the same timing were reported in Balmer lines of the DPV V 393 Scorpius. They were interpreted as due to photon scattering in a wind region (Mennickent et al. 2012a). In addition, the equivalent width for O I multiplet was measured directly on the average gainer spectrum and we obtained an EWO I = 0.67 ± 0.03 and compared with HD 47306 (AOII-type) provided by UVES-POP7 (Bagnulo et al. 2003), with an effective temperature of 9738 ± 145 K provided by ExoFOP-TESS and veiled for this purpose; we measured an equivalent width of EW = 0.65 ± 0.01. In addition, it was noted that the pronounced in V and R intensities could be caused by the accretion disk and the differences are possibly caused by emission on the hot spot on the accretion disk. Therefore, the temperature indicator could be affected by the flux contribution from the accretion disk, and for now, it is only possible to estimate the range of the effective temperature of the accretion disk since it could be creating its own atmosphere. The results for the temperature and surface gravity of the gainer star differ from the typical nature of the DPV systems, wherein the gainer star is always a B-type dwarf star. Despite that, this and other oxygen lines could explain the reason for the observed lag obtained in the radial velocities analysis, because although these lines follow the movement of the gainer star, they would belong to the accretion disk and create this observed lag in the RV of the gainer. Following this reasoning, we measured a series of other absorption lines, such as Ti II (4536 Å), TiO (4548.0 Å), TiO (4584.0 Å), and Ti I (4731.172 Å), in order to improve our understanding about the gainer and its accretion disk. However, these lines are representative of single stars with a surface gravity and effective temperature less than a B-type dwarf, varying from spectral types A0 to M2 type. Therefore, the accretor star is being hidden by its accretion disk and at the same time, the movement that we observe from the RVs measurements corresponds to the accretion disk that follows the movement of its accretor (see Fig. 16).
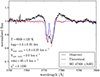 |
Fig. 15. Comparison between the average disentangled gainer (black line) and theoretical LTE spectrum (blue line) for O I 7771.96 Å (3s5S0 − 3p5P, multiplet 1) without donor contribution using a veling factor η7700−7800 Å = 0.9. Red line corresponds to A0II-type star (HD 47306). |
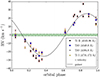 |
Fig. 16. Radial velocities for temperature indicators of gainer star. However, these are biased or they come from the same disk. Green dashed area corresponds to the system velocity γ. |
3.6. Mass ratio, Roche lobe radius, and structure
Once we have confirmed the interacting binary nature of V4142 Sgr and the existence of an accretion disk, we can assume a semidetached nature of this system, which is a characteristic of the binaries of the Algol type. Therefore, it is assumed that the less massive star, in this case, the donor star, has filled the Roche lobe. Then, beyond the synchronism concept, we decided to analyze the ratio between the effective Roche lobe geometry of the donor star RL concerning the orbital separation, using the following equation given by Eggleton (1983):
 (5)
(5)
for a mass ratio, q = 0.287 ± 0.047, whose value is consistent with binary interactions of conservative process. Other relevant analysis for the DPVs is the study of the synchronism of the systems. Thus, to analyze the compatibility of a synchronously rotating donor star and filling the Roche lobe, we used the composite equation between Eqs. (3.5) and (3.9), provided by Eggleton (2006), which is valid for system in synchronization with:
 (6)
(6)
Using the obtained values for the semi-amplitude of the donor Kd = 89.2 ± 0.5 km s−1, its rotational velocity Vd, rot sin i = 20 ± 5 km s−1 obtained in the Sect. 3.4 and using Eq. (6), suggests a mass ratio qtheo = 0.096 ± 0.007, namely, the theoretical mass ratio should be one-third of the observed one. This difference suggests that the system is non-synchronous (see Fig. 17). In addition, it is known that the mass ratio obtained from Sect. 3.2 comes from the kinematics of the binary system, whereby the analysis does not consider the proper rotation of each star.
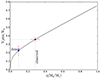 |
Fig. 17. Test for donor synchronization. Solid black line is given by Eq. (6). The dashed red line represents the obtained mass ratio (q = 0.287) from RVs analysis (synchronous) and the continuum blue line represents the suggested mass ratio (qtheo. = 0.096) given by Eq. (6) (sub-synchronous). |
Despite this, the mean density  of the donor star was quantified through the mass ratio from the RV analysis and the following relation,
  , Md = Mq/(1 + q), and using Kepler’s third law to obtain the following equation:
 (7)
(7)
the obtained value close to the expected one for a giant K1 III type (see Fig. 18), which is complemented by the temperature and the rotational velocity obtained in the Sect. 3.4. Another, rather interesting relation linked to the mean density of a star that fills its Roche lobe and the effective radius RLEggleton (1983, 2006) is the critical period, which corresponds to the shortest possible period (days) for a binary system of given mass ratio into which a star of given mean density (in solar units, i.e.,  ), which can be fitted without overflowing its Roche lobe:
 (8)
(8)
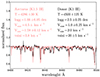 |
Fig. 18. Detailed comparison between the observed spectrum of donor star of the Galactic DPV V4142 Sgr (black line) and a single star, Arcturus (red line; previously veiled). Both show similar spectral types and parameters. |
Then, the critical period can be redefined using Eqs. (7) and (8). Following this line, we computed a critical period of  , which is greater than to one currently observed in
  . In order to constrain the system, we decided to analyze the ratio between the stellar radius and the mass as determined by its internal structure, that is, the response of the donor’s Roche lobe radius to the mass transfer depends on the mass ratio and the accretion efficiency 0 ≤ ϵ ≤ 1 (ϵ = 1 conservative, ϵ = 0 non-conservative mass transfer), using the following dimensionless equation:
 (9)
(9)
In detail, the equation of the logarithmic derivate of the orbital separation is composed by a first-term related to the mass loss or transfer:
 (10)
(10)
Since the second term of Eq. (9) is composed by two more terms, it is, in summary, the Roche lobe’s response to the change in mass ratio (Eggleton 1983):
 (11)
(11)
The other part represents the response of the mass ratio to the change in donor mass, where ϵ corresponds to the accreted fraction:
 (12)
(12)
Thus, for an accretion efficiency value ϵ = 1, the donor star is able to recover its hydrodynamic equilibrium, while remaining within its Roche lobe with a mass ratio q = 0.287 ± 0.047, that is, V4142 Sgr is inside to the zone of dynamical-stability of mass-transfer (see Fig. 19).
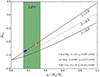 |
Fig. 19. Roche lobe response to the dynamical stability of mass transfer. The donor star is able to recover its hydrodynamic equilibrium while remaining within its Roche lobe with a mass ratio q = 0.287 ± 0.047 to different accretion efficiency values from ϵ = 0.0 to 1.0 (yellow triangle). Blue dots represent other well-studied DPVs. The dashed green rectangle spans from the minimum to maximum mass ratio of the DPVs known to date. |
3.7. Doppler tomography
We performed a Doppler tomography (DT) to reconstruct the velocity space of the system and study the structure of the accretion disk and the possible circumstellar material. Doppler tomography has been a widely used method in the field of binary systems (Marsh & Horne 1988) and numerous studies using the DT method to date have revealed features of the accretion disk, stream impact region, and so on.
For those references, the DTTVM code (Uemura et al. 2015)8 was used, which allows for Doppler tomograms to be built for the Hα emission line. In brief, the method reconstructs a Doppler map, that is, the intensity map in the velocity space (vx, vy), based on the model of DT (Marsh & Horne 1988), where the orbital phase is computed from observation ephemeris of the binary system and assumes that the noise follows a symmetric probability distribution, such as a Gaussian distribution, and that all observations yield the same variance. The code has been described in detail by Uemura et al. (2015).
The method considers different parameters such as the number of bins on side of the Doppler map nbin, with a total number of N = nbin × nbin, the resolution’s velocity of the input spectra (km s−1) resol, λ is the hyper-parameter of the model, namely, it is a weight for the total variation term, γ is the system’s radial velocity (km s−1), and, finally, the thresh is a step to terminate the iteration. Thus, the tomograms were produced using the previous mentioned parameters of the following way; nbin = 90, resol = 2.96 km s−1, γ = 0.2 km s−1, and thresh = 1E − 5 km s−1, with different λ for two configurations zoomed in and zoomed out. λ1 = 2.33572, zoom on the donor, gainer, accretion disk (top-left), λ2 = 2.33572, zoom on the gainer, accretion disk (bottom-left), λ3 = 0.07848, zoom-out of the donor, gainer, accretion disk (top-right) and λ4 = 0.04833, zoom-out of the gainer, accretion disk (bottom-right).
The implemented parameters for the Doppler converge successfully and show those maps that suggest an optical accretion disk, consistent with the scenario of mass transfer. However, we noted that the Balmer line emission has a horseshoe shape. In addition, the accretion disk shows inhomogeneous zones of low and high intensities, and two bright structures are detected at the second and third quadrant (Fig. 20, top-right). On the other hand, for the Doppler map without donor contribution the same more defined structure was observed with this horseshoe-shaped and their bright structures are smaller and located between quadrants I-II and the following III-IV.
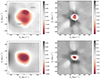 |
Fig. 20. Doppler map for V4142 Sgr which shows the gainer almost at the center of mass together with its companion (top-left). The structure of the accretion disk shows both slight and wide absorption zones (top-right). Contour lines represent levels of emission. Doppler map without donor contribution, showing diverse dense zones of absorption (bottom). The set of panels were calculated with different λ. Red zones indicate absorption and gray-black zones emission in the Hα line. |
4. Light curve model and system parameters
4.1. Fitting procedure
From the spectroscopic analysis using the temperature indicator of the gainer star, it can be confirmed that the accretion disk is creating its own atmosphere surrounding its accretor, then hiding and obstructing it while knowing the physical parameters such as temperature, radius, surface gravity, and so on. To determine and characterize the DPV V4142 Sgr, it is necessary to determine the fundamental parameters of each stellar component and the accretion disk. Therefore, we performed a fit in V-band light curve, using an algorithm developed by Djurašević (1992, 1996).
The current algorithm is capable to solve the inverse problem for the disentangled orbital light curve, of close binary systems with a hot star surrounded by an accretion disk and incorporating a bright spot located on the edge of this and a hot spot placed where occurs the impact of the gas stream. This active region or hot spot is described by the ratio of the hot-spot temperature and the unperturbed local temperature of the disk (Bisikalo et al. 2003), their angular and longitude dimensions are measured in arc degree. The algorithm, providing the stellar and disk parameters, is based on inverse problem solving, namely, consisting of a determination of the optimal values yielding the best fit between the observed light curve and the theoretical one, resolving an iterative cycle of corrections to the model elements based on the Nelder-Mead simplex algorithm (Press et al. 1992) with optimizations described by Denis & Torczon (1991), which depends on some determined parameters previously in previous sections. In addition, the model uses the results of hydrodynamical simulation of gas dynamics for interacting close binary systems by Bisikalo et al. (1998, 1999, 2003) and has been tested in several studies (Garrido et al. 2013; Mennickent et al. 2015; Rosales 2018).
To obtain reliable estimates of the system, we decided to restrict some free parameters by correcting some of them. We fixed the mass ratio q = 0.287 and the temperature of the donor star to Td = 4500 K, based on the spectroscopic analysis. Gravity-darkening of the donor βd = 0.08 and gainer βd = 0.25 was set, and the albedo of both components Ad = 0.5 and Ag = 1.0, according to von Zeipel’s law (von Zeipel 1924) for radiative envelopes and complete re-radiation (Rafert & Twigg 1980), while the limb-darkening for each component were computed by the way described by Djurašević et al. (2010).
In addition, the rotation of the donor as synchronous (fd = 1.00) was also considered, namely, the parameter fd = Porb/Pd = 1 means that the donor rotates synchronously with the orbital period. If fd is different from 1, the rotation is non-synchronous. However, the present study is not capable of making a spectroscopic determination of a synchronous or non-synchronous state for the gainer star, because it is hidden by the accretion disk, and their absorption lines are produced in the disk more than in the gainer. Despite this, an analysis of the light curves allows us to estimate the equivalent radius of the gainer, namely, the radius that a spherical star of the same volume would have if it were a rotationally deformed gainer; so, in this way, the speed of rotation of the gainer, at which the estimated radius is obtained, can be indirectly estimated. In other words, fh can, in some cases, be treated as a model free parameter in solving the inverse problem of light curves analysis. This is exactly how fh was estimated fh = 23.8 ± 1.1 in Table 6, where fh is the non-synchronous rotation coefficient of the more massive gainer.
Results of the analysis of V4142 Sgr ASAS V-band light-curve obtained by solving the inverse problem for the Roche model with an accretion disk around the more-massive (hotter) gainer in the critical non-synchronous rotation regime.
4.2. Best light curve model
The described code in the above subsection (Sect. 4.1) was used, computing the best fit, O-C residuals, along with the individual flux contributions of the donor, gainer, and disk of V4142 Sgr, and including the view of the optimal model at orbital phases 0.17, 0.45, 0.80, and 0.93. From the residuals, we notice a scatter around ΔV ∼ 0.2 (mag) without dependencies related to orbital or long cycle phases. The best-fitting model contains an optically and geometrically thick accretion disk surrounding a non-synchronous gainer star with the presence of a bright and hot spot (see Table 6). The accretion disk is assumed in physical contact with its accretor and it is characterized by its radius ℛd, with a temperature distribution along the radius of the disk of:
 (13)
(13)
where Td is the disk temperature at its outer edge (r = ℛd) and aT is the temperature exponent. The last term represents how close is the radial temperature profile to steady-state configuration. The best model shows a system under inclination 81.° 5 ± 0.° 3, with a cold and evolved donor star of mass Md = 1.11 ± 0.20 M⊙, temperature Td = 4500 ± 125 K, and a radius Rd = 19.4 ± 0.2 M⊙, and a surface gravity log gd = 1.90 ± 0.05 dex. In addition, the model shows a hot and rejuvenated companion (gainer) of Mg = 3.86 ± 0.3 M⊙, Tg = 14 380 ± 700 K corresponding to a BV6-type star. The radius is Rg = 6.35 ± 0.2 R⊙ and the surface gravity log gg = 3.42 ± 0.05 dex. The model shows that the gainer is surrounded by an optically and geometrically thick accretion disk of radial extension ℛd = 22.8 ± 0.3 R⊙, contributing ∼1.4 percent of the total luminosity of the system at the V-band at an orbital phase of 0.25.
The disk is characterized by a hot-spot with an angular dimension of 19.° 7 ± 2.° 6, situated at longitude λhs = 339.° 0 ± 6.° 2 roughly placed where the stream hits the disk and an additional bright-spot separated 102.° 5 ± 0.° 04 degree apart along the disk edge rim in the direction of the orbital motion, with a temperature Ths = 4440 ± 235 K which it is 43 percent higher than the disk edge temperature (see Fig. 21). The bright spot should be located beyond the disk and is due to the interaction between the envelope and the stream, according to Bisikalo et al. (2003). namely, it is a product of the interaction of the circumdisk halo and the stream, dubbed a “hotline”. It is located at longitude λbs = 236.° 5 ± 9.° 1 degree, an angular dimension of 41.° 4 ± 8.° 0, and a temperature Tbs = 4316 ± 232 K.
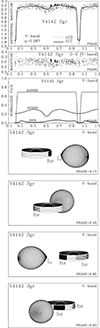 |
Fig. 21. Observed (LCO), synthetic (LCC) light-curves, and the final O–C residuals between the observed and synthetic light curves of the V4142 Sgr; fluxes of gainer, donor, and the accretion disk, normalized to the total system flux at phase 0.25; views of the model at orbital phases 0.17, 0.45, 0.80, and 0.93, obtained with parameters estimated by light curve analysis. |
5. Discussion
We find that V4142 Sgr is a relatively typical DPV in some aspects, consisting of a B-type gainer surrounded by an accretion disk that receive matter from a K-type giant filling its Roche lobe. However, its relatively long orbital period of 30 6 makes it an interesting object, since not many of these long-period DPVs have been studied spectroscopically. In addition, some interesting features appear, such as the presence of a wind and a thick disk partially hiding the gainer. In spite of this occultation, the gainer is so bright that the main eclipse is much deeper than the secondary one. A wind or general mass loss was detected in the DPVs OGLE 05155332-6925581 (Po = 7
 3), V393 Sco (Po = 7
 7), AU Mon (Po = 11
 1), β Lyr (Po = 12
 9), HD 170582 (Po = 16
 9), and V495 Cen (Po = 33
 5). Theoretical studies suggest that a radiatively supported mass outflow or wind could be formed in the hotspot region, especially in systems with high mass transfer rate (van Rensbergen et al. 2008a). The changing aspect of the eclipse depth in ASAS and ASAS-SN data suggests a variable disk structure. The complex structure of the mass flows are reflected in the Doppler tomograms, showing a non-homogeneous emissivity distribution for Hα. The constancy of the orbital period on the other hand, suggests that the mass transfer rate is not so large, otherwise changes in the orbital period should be observed due to the re-distribution of the angular momentum among two bodies of changing masses orbiting their center of mass. The influence of the disk is observed in the continuum and the optical spectral lines. Double and asymmetrical Balmer emission lines, as well as sharp absorption lines of low ionized atoms, such Ti II, Ti O, and Ti I are probably formed in low-temperature, optically thin disk regions, not as the continuum light probably formed in the optically thick and denser part of the disk. The γ and phase shifts observed in the OI 8446.35 Å line suggest that the photosphere of the gainer is hidden by the disk and that the absorption lines of the more massive star photosphere are filled with disk emission, difficulting the task of determining the spectral type of the gainer.
We compiled stellar temperatures and radii for DPVs and show the position of V 4142 Sgr among their pairs in Fig. 22. While the radius of the DPV gainers remain between 4 and 8 R⊙ consistent with B-type dwarfs, the donor radius increases with the orbital period, consisting with giant stars filling their Roche lobes. The stellar temperatures also show a significant tendency, hotter gainer are accompaigned by hotter donors. V 4142 Sgr is located in the cold extreme of the sample. The fits shown in this figure are intended to provide global tendencies in the data:
 (14)
(14)
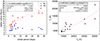 |
Fig. 22. Stellar radius versus orbital period for DPVs (left). The arrow indicates the position of V 4142 Sgr and the solid line the best second-order polinomial fit for the donor star data. Right: temperatures for the hot and cool stellar components of DPVs. The arrow indicate the position of V 4142 Sgr and the solid line is the best 2nd order polinomial fit to the data. |
with a standard deviation of 2.40 R⊙ and adjusted R squared of 0.735 and
 (15)
(15)
with standard deviation 2490 K and Adj. R-sqare 0.676. The data used in these fits are from Mennickent et al. (2016) and references therein, and from more recent datasets published by Mennickent & Djurašević (2021), Rosales et al. (2021), Mennickent et al. (2019, 2020a,b) and Rosales (2018).
We searched for the best model and evolutive path for V 4142 Sgr among a grid of binary star evolutionary models (van Rensbergen et al. 2008b), following a χ2 minimization method among the observed and theoretical radii, luminosities, temperatures, masses, and orbital period and also considering the errors of these parameters as weights in the process (Mennickent et al. 2012b). We find that the current position of the system can be reproduced by a binary system with an initial period of 5 days, initial masses of 3 and 2.7 M⊙, radii of 2.0 and 1.9 R⊙ found at an age of 4.24 × 10⁸ yr. At this age, the model consists of a B-type star of temperature 13 930 K and mass 4.78 M⊙ and a K-type star of temperature 4285 K and mass 0.925 M⊙ filling its Roche lobe and transferring mass onto the more massive star at a rate of 1.4 × 10⁻⁷ M⊙ yr−1 in a conservative way, being the orbital period of the system 30 754. These results need to be interpreted with caution, since they are limited due to the resolution of the grid of models, which is rather coarse, and also because the efficience of mass transfer in the system is not well constrained, and is included only in a simplified way in the models. However, some general results can be inferred: (i) the initially less massive star turns to be rejuvenated because of the mass accreted from the donor star and now is the more luminous and massive star of the system (Fig. 23) and (ii) the donor has depleted of hydrogen its core that consists now of 98% of helium, while the gainer has a core hydrogen fraction of 0.28 and helium fraction of 0.70. The above scenario, especially the hydrogen depleted donor, is consistent with investigations of other DPVs indicating case-B mass exchange systems (Mennickent et al. 2016).
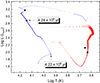 |
Fig. 23. Evolutionary paths for the donor (red circles) and gainer (blue circles). The system starts mass transfer around 4.22 × 10⁸ yr and now it is found at an age of 4.24 × 10⁸ yr. Squares indicate the best model parameters and the dots the parameters derived from observations. |
6. Conclusions
We have investigated, spectroscopically and photometrically, the Galactic DPV V4142 Sgr in detail, in addition to conducting a photometric analysis to find the main eclipsing times spanning 8.7 years and an improved orbital period of 30 633(2) as well as a long cycle of 1201 ± 14 days. A comparison between data from ASAS and ASAS-SN revealed a morphological difference in the shape and amplitude of the light curves during the primary eclipse. From our analysis of the radial velocities, we found a circular orbit, a mass ratio of q = 0.287 ± 0.047, a half amplitude of Kd = 89.2 ± 0.5 km s−1, and systemic velocity γ = 0.2 ± 0.77 km s−1. In addition, a semi-amplitude of Kg = 25.56 ± 1.20 km s−1 was calculated.
The next notable case we found is that the color-color analysis considering J − H = 0.575 ± 0.037 mag and H − K = 0.192 ± 0.032 mag shows a color excess in JHK photometry, considering as reference a single star of temperature around 5000 K. This excess could be interpreted as evidence for circumstellar material.
The inverse problem was solved to derive the parameters producing the best match between a theoretical light curve and the observed one. The best model of the V-band ASAS light curve includes a cold and evolved donor star of Md = 1.11 ± 0.2 M⊙, Td = 4500 ± 125 K, and Rd = 19.4 ± 0.2 R⊙, as well as a rejuvenated B type star of Mg = 3.86 ± 0.3 M⊙, Tg = 14 380 ± 700 K, and Rg = 6.35 ± 0.2 R⊙. We determined that the gainer star is surrounded by a concave and geometrically thick disk creating its atmosphere around the main component of a radial extension, ℛd = 22.8 ± 0.3 R⊙, contributing ∼1.4 percent of the total luminosity of the system at the V-band at orbital phase 0.25. The disk is characterized by a hot spot roughly placed where the stream hits the disk and an additional bright spot separated 102.° 5 ± 0.° 04 degree apart along the disk edge rim in the direction of the orbital motion. In addition, the accretion disk atmosphere is detected in absorption lines Ti II 4533.96 Å, Ti O 4548.0 Å, Ti O 4584.0 Å, and Ti I 4731.172 Å. The double peaked Hα emission with persistent V ≤ R asymmetry could be an indication of optically thin regions of a wind emerging from the system.
Considering that Doppler maps converged successfully, these suggest an optically thick accretion disk, consistent with the scenario of mass transfer of DPVs. In addition, we noted that the Balmer line emissivity distribution has a horseshoe shape and shows inhomogeneous zones of low and high intensities; in addition, two bright structures are detected in the second and third quadrant, wherein the first one would correspond to the hot spot and the second one to the bright spot detected by the light curve analysis.
Once we had improved our understanding of the evolution, we determined that the system is the result of the evolution of an initially shorter orbital period binary, which inverted its mass ratio as a result of the mass transfer among the initially more massive star onto the initially less massive star. At present, the donor star is an early K-type giant that depleted its core of hydrogen while the companion has gained about 2 M⊙ and increased its luminosity by one order of magnitude or more in a process lasting about 2 Myr. These results are consistent with the evolutionary histories of other investigated DPVs (Mennickent et al. 2016).
Acknowledgments
We thank the referee Dr. Mikhail Kovalev for useful comments on the first version of this manuscript. G.D. and J.P. gratefully acknowledge the financial support of the Ministry of Education, Science and Technological Development of the Republic of Serbia through contract No 451-03-68/2020-14/200002. R.E.M. and D.S. gratefully acknowledge support by PFB–06/2007, ANID BASAL projects ACE210002 and FB210003, FONDECYT Regular 1190621 and FONDECYT Regular 1201280. J.R.G. acknowledges support by BASAL Centro de Astrofísica y Tecnologías Afines (CATA) FB210003. I.A. and M.C. acknowledge support from FONDECYT project No 1190485. I.A. is also grateful for the support from FONDECYT project No 11190147. This work has made use of data from the European Space Agency (ESA) mission Gaia (https://www.cosmos.esa.int/gaia), processed by the Gaia Data Processing and Analysis Consortium (DPAC, https://www.cosmos.esa.int/web/gaia/dpac/consortium). Funding for the DPAC has been provided by national institutions, in particular the institutions participating in the Gaia Multilateral Agreement. This paper includes data collected by the TESS mission, which are publicly available from the Mikulski Archive for Space Telescopes (MAST).
References
- Akeson, R., & Christiansen, J. 2019, AAS, 233, 140.09 [NASA ADS] [Google Scholar]
- Applegate, J. H., & Patterson, J. 1987, ApJ, 322, L99 [NASA ADS] [CrossRef] [Google Scholar]
- Bagnulo, S., Jehin, E., Ledoux, C., et al. 2003, The Messenger, 114, 10 [Google Scholar]
- Bisikalo, D. V., Boyarchuk, A. A., Chechetkin, V. M., Kuznetsov, O. A., & Molteni, D. 1998, MNRAS, 300, 39 [NASA ADS] [CrossRef] [Google Scholar]
- Bisikalo, D. V., Boyarchuk, A. A., Chechetkin, V. M., Kuznetsov, O. A., & Molteni, D. 1999, Astron. Rep., 43, 797 [NASA ADS] [Google Scholar]
- Bisikalo, D. V., Boyarchuk, A. A., Kaigorodov, P. V., & Kuznetsov, O. A. 2003, Astron. Rep., 47, 809 [NASA ADS] [CrossRef] [Google Scholar]
- Castelli, F., & Kurucz, R. L. 2003, IAUS, 210, A20 [NASA ADS] [Google Scholar]
- Charbonneau, P. 1995, ApJS, 101, 309 [Google Scholar]
- Denis, J. E., & Torczon, V. 1991, SIAM J. Optim., 1, 448 [Google Scholar]
- Djurašević, G. 1992, Ap&SS, 197, 17 [CrossRef] [Google Scholar]
- Djurašević, G. 1996, Ap&SS, 243, 413 [CrossRef] [Google Scholar]
- Djurašević, G., Latković, O., Vince, I., & Cséki, A. 2010, MNRAS, 409, 329 [CrossRef] [Google Scholar]
- Eggleton, P. P. 1983, ApJ, 268, 368 [Google Scholar]
- Eggleton, P. 2006, Evolutionary Processes in Binary and Multiple Stars, (Cambridge University Press) [Google Scholar]
- Gaia Collaboration (Brown, A. G. A., et al.) 2018a, A&A, 616, A1 [NASA ADS] [CrossRef] [EDP Sciences] [Google Scholar]
- Gaia Collaboration (Katz, D., et al.) 2018b, A&A, 616, A11 [NASA ADS] [CrossRef] [EDP Sciences] [Google Scholar]
- Garrido, H. E., Mennickent, R. E., Djurašević, G., et al. 2013, MNRAS, 428, 1594 [NASA ADS] [CrossRef] [Google Scholar]
- González, J. F., & Levato, H. 2006, A&A, 448, 283 [NASA ADS] [CrossRef] [EDP Sciences] [Google Scholar]
- Gray, R. O., & Corbally, C. J. 1994, AJ, 107, 742 [Google Scholar]
- Gray, R. O., Graham, P. W., & Hoyt, S. R. 2001, AJ, 121, 2159 [NASA ADS] [CrossRef] [Google Scholar]
- Guinan, E. F. 1989, Space Sci. Rev., 50, 35 [NASA ADS] [CrossRef] [Google Scholar]
- Harmanec, P., & Scholz, G. 1993, A&A, 279, 131 [NASA ADS] [Google Scholar]
- Harmanec, P., Morand, F., Bonneau, D., et al. 1996, A&A, 312, 879 [Google Scholar]
- Hilditch, R. W. 2001, An Introduction to Close Binary Stars, (Cambridge University Press) [Google Scholar]
- Jayasinghe, T., Stanek, K. Z., Kochanek, C. S., et al. 2019, MNRAS, 486, 1907 [NASA ADS] [Google Scholar]
- Kochanek, C. S., Shappee, B. J., Stanek, K. Z., et al. 2017, PASP, 129, 104502 [Google Scholar]
- Marquardt, D. W. 1963, SIAM, 11, 431 [Google Scholar]
- Marsh, T. R., & Horne, K. 1988, MNRAS, 235, 269 [Google Scholar]
- Meintjes, P. J. 2004, MNRAS, 352, 416 [NASA ADS] [CrossRef] [Google Scholar]
- Mennickent, R. E. 2017, Serb. Astron. J., 194, 1 [NASA ADS] [CrossRef] [Google Scholar]
- Mennickent, R. E., & Djurašević, G. 2021, A&A, 653, A89 [NASA ADS] [CrossRef] [EDP Sciences] [Google Scholar]
- Mennickent, R. E., & Rosales, J. 2014, IBVS, 6116, 1 [NASA ADS] [Google Scholar]
- Mennickent, R. E., Pietrzyński, G., Diaz, M., & Gieren, W. 2003, A&A, 399, L47 [NASA ADS] [CrossRef] [EDP Sciences] [Google Scholar]
- Mennickent, R. E., Kołaczkowski, Z., Michalska, G., et al. 2008, MNRAS, 389, 1605 [NASA ADS] [CrossRef] [Google Scholar]
- Mennickent, R. E., Kołaczkowski, Z., Djurasevic, G., et al. 2012a, MNRAS, 427, 607 [NASA ADS] [CrossRef] [Google Scholar]
- Mennickent, R. E., Djurašević, G., Kołaczkowski, Z., & Michalska, G. 2012b, MNRAS, 421, 862 [NASA ADS] [Google Scholar]
- Mennickent, R. E., Djurašević, G., Cabezas, M., et al. 2015, MNRAS, 448, 1137 [NASA ADS] [CrossRef] [Google Scholar]
- Mennickent, R. E., Otero, S., & Kołaczkowski, Z. 2016, MNRAS, 455, 1728 [NASA ADS] [CrossRef] [Google Scholar]
- Mennickent, R. E., Schleicher, D. R. G., & San, Martin-Perez R. 2018, PASP, 130, 094203 [CrossRef] [Google Scholar]
- Mennickent, R. E., Cabezas, M., Djurašević, G., et al. 2019, MNRAS, 487, 4169 [NASA ADS] [CrossRef] [Google Scholar]
- Mennickent, R. E., Djurašević, G., Vince, I., Garcés, J., et al. 2020a, A&A, 642, A211 [NASA ADS] [CrossRef] [EDP Sciences] [Google Scholar]
- Mennickent, R. E., Garcés, J., Djurašević, G., et al. 2020b, A&A, 641, A91 [NASA ADS] [CrossRef] [EDP Sciences] [Google Scholar]
- Navarrete, F. H., Schleicher, D. R. G., Käpylä, P. J., et al. 2020, MNRAS, 491, 1043 [Google Scholar]
- Paredes, L. A., Henry, T. J., Quinn, S. N., et al. 2021, AJ, 162, 176 [NASA ADS] [CrossRef] [Google Scholar]
- Peterson, W. M., Mutel, R. L., Güdel, M., & Goss, W. M. 2010, Nature, 463, 207 [NASA ADS] [CrossRef] [Google Scholar]
- Pojmanski, G. 1997, AcA, 47, 467 [NASA ADS] [Google Scholar]
- Press, W. H., Teukolsky, S. A., Vetterling, W. T., & Flannery, B. P. 1992, Numerical Recipes in Fortran, second ed., in: The Art of Scientific Computing, 120, (Cambridge University Press) [Google Scholar]
- Rafert, J. B., & Twigg, L. W. 1980, MNRAS, 193, 79 [Google Scholar]
- Reinhold, T., Reiners, A., & Basri, G. 2013, A&A, 560, A4 [NASA ADS] [CrossRef] [EDP Sciences] [Google Scholar]
- Rosales Guzmán, J. A., Mennickent, R. E., Djurašević, G., Araya, I., & Curé, M. 2018, MNRAS, 476, 3039 [Google Scholar]
- Rosales, J. A., Mennickent, R. E., Schleicher, D. R. G., & Senhadji, A. A. 2019, MNRAS, 483, 862 [Google Scholar]
- Rosales, J. A., Mennickent, R. E., Djurašević, G., et al. 2021, AJ, 162, 66 [NASA ADS] [CrossRef] [Google Scholar]
- San Martín-Pérez R. I., Schleicher, D. R. G., Mennickent, R. E., & Rosales, J. A. 2019, BAAA, 61, 107 [Google Scholar]
- Sarna, M. J., Muslimov, A., & Yerli, S. K. 1997, MNRAS, 286, 209 [NASA ADS] [CrossRef] [Google Scholar]
- Schleicher, D. R. G., & Mennickent, R. E. 2017, A&A, 602, A109 [NASA ADS] [CrossRef] [EDP Sciences] [Google Scholar]
- Shappee, B. J., Prieto, J. L., Grupe, D., et al. 2014, ApJ, 788, 48 [Google Scholar]
- Skrutskie, M. F., Cutri, R. M., Stiening, R., et al. 2006, AJ, 131, 1163 [NASA ADS] [CrossRef] [Google Scholar]
- Soderhjelm, S. 1980, A&A, 89, 100 [Google Scholar]
- Stellingwerf, R. F. 1978, ApJ, 224, 953 [Google Scholar]
- Takeda, Y. 1992, PASJ, 44, 309 [NASA ADS] [Google Scholar]
- Takeda, Y., & Honda, S. 2016, PASJ, 68, 32 [NASA ADS] [CrossRef] [Google Scholar]
- Takeda, Y., & Sadakane, K. 1997, PASJ, 49, 367 [NASA ADS] [Google Scholar]
- Takeda, Y., Han, I., Kang, D.-I., Lee, B.-C., & Kim, K.-M. 2008, JKAS, 41, 83 [NASA ADS] [Google Scholar]
- Tokovinin, A., Fischer, D. A., Bonati, M., et al. 2013, PASP, 125, 1336 [NASA ADS] [CrossRef] [Google Scholar]
- Uemura, M., Kato, T., Nogami, D., & Mennickent, R. 2015, PASJ, 67, 22 [NASA ADS] [Google Scholar]
- van Rensbergen, W., De Greve, J. P., De Loore, C., & Mennekens, N. 2008a, A&A, 487, 1129 [NASA ADS] [CrossRef] [EDP Sciences] [Google Scholar]
- van Rensbergen, W., De Greve, J. P., De Loore, C., & Mennekens, N. 2008b, VizieR On-line Data Catalog: J/A+A/487/1129 [Google Scholar]
- van Rensbergen, W., de Greve, J. P., Mennekens, N., Jansen, K., & de Loore, C. 2011, A&A, 528, A16 [NASA ADS] [CrossRef] [EDP Sciences] [Google Scholar]
- von Zeipel, H. 1924, MNRAS, 84, 702 [Google Scholar]
- Wenger, M., Ochsenbein, F., Egret, D., et al. 2000, A&AS, 143, 9 [NASA ADS] [CrossRef] [EDP Sciences] [Google Scholar]
- Wright, E. L., Eisenhardt, P. R. M., Mainzer, A. K., et al. 2010, AJ, 140, 1868 [Google Scholar]
- Zechmeister, M., & Kürster, M. 2009, A&A, 496, 577 [CrossRef] [EDP Sciences] [Google Scholar]
All Tables
Summary of spectroscopic observation using CHIRON spectrograph mounted on the SMARTS-1.5 m Telescope.
Radial velocities of the gainer and their respective errors, using the O I (8446.35 Å) line.
Radial velocities of the donor and their respective errors, using the Fourier cross-correlation process.
Results of the analysis of V4142 Sgr ASAS V-band light-curve obtained by solving the inverse problem for the Roche model with an accretion disk around the more-massive (hotter) gainer in the critical non-synchronous rotation regime.
All Figures
|
Fig. 1. Orbital and long period of Galactic DPVs, see the text for more details. Shaded region limits the 90% confidence boundary. |
| In the text | |
|
Fig. 2. Histogram of magnitude for V4142 Sgr using 50 bins for 806 ASAS A-type data, showing a positive skew distribution. The dashed red line corresponds to a normal distribution of 806 random data with a mean μ = 10.939 mag and sigma σ = 0.06 mag. |
| In the text | |
|
Fig. 3. V4142 Sgr ASAS V-band light curve after disentangling. Orbital (top) and long cycle phase (bottom) are phased according to times of the light curve minimum and maxima, given by Eqs. (1) and (2). |
| In the text | |
|
Fig. 4. ASAS and ASAS-SN V-band light curves comparisons phased using the orbital period Po = |
| In the text | |
|
Fig. 5. 2MASS J − H versus H − K color-color diagram for V4142 Sgr and other systems with/out circumstellar matter. For more detail of data collection see Mennickent et al. (2016). |
| In the text | |
|
Fig. 6. Radial velocities for donor (black-dots) through fxcor process and gainer star (blue-dots) using O I (8446.35 Å) measured by Gaussian fits. The best sinusoidal fits are shown for both orbits. The smoothed blue line corresponds to the RVs of the gainer star without lag. |
| In the text | |
|
Fig. 7. Representation of χ2 distribution in the K − e plane computed through Montecarlo simulation (top). The solid-black and dashed-gray lines correspond to 1σ and 2σ iso-contours, and the red dot indicates the minimum χ2 solution. Contour corresponding to the Δχ2 that includes 68.3% of the probability (bottom). |
| In the text | |
|
Fig. 8. Average Hα profile with their respective sizes. The widths of their emissions peaks and their absorption profile were measured at the height of the continuum. |
| In the text | |
|
Fig. 9. Behaviour of Hα profile sorted by orbital phases and centered at 6562.817 Å for comparing the red-peak emission. The observed spectra show the donor and gainer flux contribution, i.e., these were not disentangled. |
| In the text | |
|
Fig. 10. Equivalent width of Hα profile from gainer star during a complete orbital phase with donor contribution subtracted, using the CHIRON spectrograph (top). The dashed blue line corresponds to a Marquart-Levenberg fit using a fixed period 0.5Po and the continuum green line represents a GLS fit with a free period, revealing a period of |
| In the text | |
|
Fig. 11. Surface color map of chi-square analysis for the donor star. The best model converges with a χ26 = 10.822 and it is represented by a red dot and their respective errorbars at Td = 4500 ± 125 K and log g = 2.5 ± 0.125 dex. |
| In the text | |
|
Fig. 12. Comparison between the disentangled observed (black) and theoretical (red) spectrum of the donor star and η5400−5500 Å = 0.3. |
| In the text | |
|
Fig. 13. Detailed comparison between the best theoretical model using a veiling factor η5500−5700 Å = 0.3 (red-line) and the average observed spectrum (black-line) for the donor star. |
| In the text | |
|
Fig. 14. Oxygen absorption line O I 7771.96 Å (3s5S0 − 3p5P, multiplet 1) of observed spectra (without donor contribution) at different orbital phases, showing the triplet. |
| In the text | |
|
Fig. 15. Comparison between the average disentangled gainer (black line) and theoretical LTE spectrum (blue line) for O I 7771.96 Å (3s5S0 − 3p5P, multiplet 1) without donor contribution using a veling factor η7700−7800 Å = 0.9. Red line corresponds to A0II-type star (HD 47306). |
| In the text | |
|
Fig. 16. Radial velocities for temperature indicators of gainer star. However, these are biased or they come from the same disk. Green dashed area corresponds to the system velocity γ. |
| In the text | |
|
Fig. 17. Test for donor synchronization. Solid black line is given by Eq. (6). The dashed red line represents the obtained mass ratio (q = 0.287) from RVs analysis (synchronous) and the continuum blue line represents the suggested mass ratio (qtheo. = 0.096) given by Eq. (6) (sub-synchronous). |
| In the text | |
|
Fig. 18. Detailed comparison between the observed spectrum of donor star of the Galactic DPV V4142 Sgr (black line) and a single star, Arcturus (red line; previously veiled). Both show similar spectral types and parameters. |
| In the text | |
|
Fig. 19. Roche lobe response to the dynamical stability of mass transfer. The donor star is able to recover its hydrodynamic equilibrium while remaining within its Roche lobe with a mass ratio q = 0.287 ± 0.047 to different accretion efficiency values from ϵ = 0.0 to 1.0 (yellow triangle). Blue dots represent other well-studied DPVs. The dashed green rectangle spans from the minimum to maximum mass ratio of the DPVs known to date. |
| In the text | |
|
Fig. 20. Doppler map for V4142 Sgr which shows the gainer almost at the center of mass together with its companion (top-left). The structure of the accretion disk shows both slight and wide absorption zones (top-right). Contour lines represent levels of emission. Doppler map without donor contribution, showing diverse dense zones of absorption (bottom). The set of panels were calculated with different λ. Red zones indicate absorption and gray-black zones emission in the Hα line. |
| In the text | |
|
Fig. 21. Observed (LCO), synthetic (LCC) light-curves, and the final O–C residuals between the observed and synthetic light curves of the V4142 Sgr; fluxes of gainer, donor, and the accretion disk, normalized to the total system flux at phase 0.25; views of the model at orbital phases 0.17, 0.45, 0.80, and 0.93, obtained with parameters estimated by light curve analysis. |
| In the text | |
|
Fig. 22. Stellar radius versus orbital period for DPVs (left). The arrow indicates the position of V 4142 Sgr and the solid line the best second-order polinomial fit for the donor star data. Right: temperatures for the hot and cool stellar components of DPVs. The arrow indicate the position of V 4142 Sgr and the solid line is the best 2nd order polinomial fit to the data. |
| In the text | |
|
Fig. 23. Evolutionary paths for the donor (red circles) and gainer (blue circles). The system starts mass transfer around 4.22 × 10⁸ yr and now it is found at an age of 4.24 × 10⁸ yr. Squares indicate the best model parameters and the dots the parameters derived from observations. |
| In the text | |
Current usage metrics show cumulative count of Article Views (full-text article views including HTML views, PDF and ePub downloads, according to the available data) and Abstracts Views on Vision4Press platform.
Data correspond to usage on the plateform after 2015. The current usage metrics is available 48-96 hours after online publication and is updated daily on week days.
Initial download of the metrics may take a while.