| Issue |
A&A
Volume 698, June 2025
|
|
|---|---|---|
| Article Number | A56 | |
| Number of page(s) | 10 | |
| Section | Stellar structure and evolution | |
| DOI | https://doi.org/10.1051/0004-6361/202452959 | |
| Published online | 28 May 2025 | |
Cyclic variability of the accretion disk in the eclipsing binary OGLE-LMC-DPV-065
1
Universidad de Concepción, Departamento de Astronomía, Casilla 160-C, Concepción, Chile
2
Astronomical Observatory, Volgina 7, 11060 Belgrade 38, Serbia
3
Issac Newton institute of Chile, Yugoslavia Branch, 11060 Belgrade, Serbia
⋆ Corresponding author: This email address is being protected from spambots. You need JavaScript enabled to view it.
Received:
11
November
2024
Accepted:
11
April
2025
Abstract
Context. The long photometric cycle observed in Algol OGLE-LMC-DPV-065 (OGLE05200407-6936391), and other similar systems, still challenges explanation. It is currently thought that a variable mass transfer rate could modify the structure of the accretion disk surrounding the more massive star, producing modulations of the global system brightness.
Aims. We revisited I-band Optical Gravitational Lensing Experiment (OGLE) photometric time series spanning 20 years, with the aim of detecting and analyzing possible changes in the accretion disk properties, namely, radial and vertical extension and also temperature, and explored the existence of shock regions.
Methods. We solved the inverse problem yielding the best configuration of stellar and disk parameters for explaining the variability of the light curve on the orbital as well as the long-cycle timescales. A simple model allowed us to estimate the relative mass transfer rate, and the disk parameters were analyzed to evaluate their dependence and variability.
Results. We find that changes in the accretion disk properties reproduce the light curve variability patterns observed on the orbital and long-term cycle timescales. The mass transfer rate is highest and the disk thickness minimum at the maximum of the long-term cycle. The large vertical thicknesses suggest motions at scales beyond the classic scale height dominating the disk vertical structure while the disk almost always remains within the tidal radius.
Conclusions. We conclude that the long-term cycle can be explained by a variable disk and that the mass transfer rate plays a fundamental role in establishing these changes.
Key words: binaries: eclipsing / binaries: general / stars: emission-line, Be / stars: evolution / stars: variables: general
© The Authors 2025
 Open Access article, published by EDP Sciences, under the terms of the Creative Commons Attribution License (https://creativecommons.org/licenses/by/4.0), which permits unrestricted use, distribution, and reproduction in any medium, provided the original work is properly cited.
This article is published in open access under the Subscribe to Open model. This email address is being protected from spambots. You need JavaScript enabled to view it. to support open access publication.
1. Introduction
Binary stars act as natural laboratories for examining fundamental stellar parameters and are relatively prevalent in the universe, particularly those consisting of massive stars. Depending on the size of the system, and as the more massive star evolves first, it may eventually fill its Roche lobe, the volume where it exerts significant gravitational influence, and begin transferring matter to its companion. If this process persists over an extended period, the system's mass ratio reverses: the initially more massive star becomes the less massive and more evolved member of the pair, a phenomenon known as the Algol paradox. As mass transfer continues, the system becomes an interacting binary, offering a captivating natural laboratory to explore the mass transfer phenomenon between stars and the development of accretion disks in some instances. These processes and the general physical principles of binary star evolution have recently been reviewed by Tauris & van den Heuvel (2023).
Double periodic variables (DPVs) are Algols characterized by a long photometric cycle of unknown nature (Mennickent et al. 2003, 2016a; Poleski et al. 2010; Pawlak et al. 2013; Mennickent 2017). They are semidetached binaries, typically consisting of an A-, F-, or G-type giant star (the donor) that has filled its Roche lobe and is transferring mass onto a B-type primary (the gainer) that is surrounded by an accretion disk. The long-term cycle has recently been interpreted in terms of a magnetic dynamo anchored in the donor star, since a star experiencing magnetic cycles might show variations in its gravitational quadrupole, yielding cycles of mass overflowing through the inner Lagrangian point (Applegate & Patterson 1987; Applegate 1992; Schleicher & Mennickent 2017). However, no direct evidence of a magnetic field has been reported for most DPVs. The study of the long-term cycle could provide clues to the physical processes involved and the ratio between accreted and lost mass in these systems.
V 4142 Sgr is an interesting case. Its gainer is located in a region of the luminosity-temperature diagram similar to other type B gainer DPVs that have undergone mass accretion. In this system the size of the gainer star shrinks considerably, but it increases its mass, luminosity, and temperature thanks to the material acquired from the donor (Rosales et al. 2024). In addition, structural changes in the disk of OGLE-LMC-DPV-097 have been proposed to explain its long-term cycle, whereas a successful model that explains the long-term and orbital brightness variability of OGLE-BLG-ECL-157529 also considers changes in the vertical and radial extension of the disk (Garcés et al. 2018; Mennickent & Djurašević 2021).
Recent studies suggest that DPV disks are not accretion powered as happens in close binaries with compact accreting objects, for example white dwarfs or neutron stars. Since DPVs host B-type dwarfs, their gravitational wells are not deep enough to generate sufficient accretion-powered luminosity in the disk. On the contrary, their disks seem to be heated by their central stars, and radiate into the observer's line of sight according to their temperature, projected area, and size. For five well-studied DPVs, the disk luminosity scales with the primary mass and is much larger than the theoretical accretion luminosity (Mennickent et al. 2016b).
Among DPVs, an interesting case is the system OGLE05200407-6936391 (OGLE-LMC-DPV-065), which shows a double hump light curve during its long-term cycle and has been studied by Mennickent et al. (2019, hereafter M19). This study describes the analysis of photometric time series data spanning 124 years, along with high-resolution spectra to study the orbital motion and stellar physical parameters. The analysis confirms a stable orbital period of about  without variation; however, small but significant changes in the timings of the secondary eclipse are noted. Over 13 years, the long-term cycle decreased from 350 to 218 days and then stabilized for about 10 years. The study confirms that the binary's orbit is circular with a mass ratio of approximately 0.203. The system includes two stars with masses of approximately 13.8 and 2.81 M⊙ and radii of 8.8 and 12.6 R⊙. A thick disk around the hotter star is noted, with a radius of 25 R⊙. The presence of two shock regions on the disk explains the observed asymmetries in the light curves. The system is classified among the DPVs, and shares some characteristics with the well-known β Lyrae system, for instance, in terms of the mass of the gainer, the orbital separation, and the long-term cycle length.
In this paper we present a new perspective of the system OGLE-LMC-DPV-065. A reanalysis of the photometric data allowed us to detect signs of disk variability. We find that the orbital light curve changes during the long-term cycle, and we modeled the system using a set of parameters that vary along this cycle. In Sect. 2 we present our methodology for the light curve analysis and the model used for the accretion disk. In Sect. 3 we show our results, emphasizing the link between the physical quantities and the long-term cycle phase. A discussion in the context of mass transferring semidetached binaries is given in Sect. 4. Finally, in Sect. 5 we present our conclusions, and we note how these DPV systems call for new models of the stream disk interaction region and mass flows in semidetached binaries.
2. Data and methodology
From the work by M19 we considered the OGLE-II (Szymanski 2005)1 and OGLE-III/IV data. The OGLE-IV project is described by Udalski et al. (2015). Poleski et al. (2010) published the OGLE-II and OGLE-III I-band2 data analyzed in this paper. A summary of the studied data is given in Table 1.
Summary of I-band photometric observations considered in this paper.
The primary distinction between the study by M19 and our current work lies in our approach to data analysis. Unlike the previous study, we do not separate the light curve into orbital and long-cycle components. Instead, we segment the data relative to the long-term cycle, accounting for its variability, and analyze each segment independently. The light curve model adopted here, consisting of 12 parameters, is similar to that used in M19, but adopts a slightly modified temperature law for the disk, which aligns more closely with recent findings in the field. This methodology enables us to gain new insights into the variability of OGLE-LMC-DPV-065. By foregoing the disentanglement of the light curve, we address the overall light curve while considering variations in the zero-point magnitude throughout the long-term cycle. The disk parameters presented in the aforementioned paper should be regarded as preliminary insights, representing an average orbital state of the parameters that does not account for temporal variability.
OGLE-LMC-DPV-065 shows a varying long-term cycle length whose ephemeris is documented in Table 2, where six segments of data are given with its respective long-term cycle period. According to the location in these segments, we assigned to every data point the corresponding long-term cycle phase. The result shows how well the shape of this cycle is preserved at different cycle lengths, and also how the orbital cycle changes during the long-term cycle (Fig. 1). The characterization of the data segments used in this paper are given in Table 4; the segments cover the orbital phase well, including quadratures and eclipses.
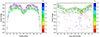 |
Fig. 1. Light curve folded with the orbital period (left) and with the long-term cycle periods (right). All I-band data are shown, and are colored according to the long-term cycle or orbital phases. |
Data intervals used for the long-period analysis in M19.
The light curve model employs an advanced simplex algorithm (Dennis & Torczon 1991), to address the inverse problem by fine-tuning the light curve to match the precise parameters that characterize the stars-orbit-disk system being observed. The basic principles of this model and the methodologies used to generate light curves are extensively detailed in existing scholarly works (Djurašević 1992, 1996). Additional advancements and improvements to this model have been reported and proven effective in the examination of various closely orbiting binary star systems (e.g., Djurašević et al. 2008; Mennickent & Djurašević 2013; Rosales Guzmán et al. 2018; Mennickent et al. 2020).
The light curve model calculates the total flux emitted by the binary system as the sum of individual stellar fluxes and the radiation emitted by an optically thick accretion disk that encircles the brighter star. It also takes into account geometrical and projection effects due to the perspective of the observer. The disk's light contribution was derived from localized Planck radiation functions set at specific temperatures specifically in order to avoid complex radiative transfer calculations. However, the model does consider simpler effects such as reflection, limb darkening, and gravitational dimming.
The accretion disk is described through parameters such as its radius Rd, vertical thickness at its central and outer edges (dc and de respectively), and a radial temperature gradient described by the equation
 (1)
(1)
where Td represents the temperature at the disk's outer rim (r=Rd) and aT is the exponent controlling the temperature gradient, not exceeding the steady-state limit of 0.75. Therefore, this exponent, aT, reflects how closely the radial temperature profile nears a steady state. The above power law differs from the one used by M19 for the first study of this system. It appears that a power law is a better description for modeling the β Lyrae type disk (Mourard et al. 2018).
Moreover, the model suggests the existence of two shock regions on the disk's edge: a “hot spot” at the presumed impact point where the inner Lagrangian point's gas stream meets the disk, and a “bright spot” at another location on the disk's edge. These areas are identified by their varied thickness and temperature in relation to the disk and have been confirmed through hydrodynamic simulations and Doppler mapping of Algol systems (Bisikalo et al. 2000; Richards 2004; Richards et al. 2014). Their presence has been deduced from light curve analyses and supported by polarimetric and interferometric studies (Lomax et al. 2012; Mourard et al. 2018).
In this model the hot and bright spots are characterized by their temperatures relative to the disk's temperature Ahs≡Ths/Td and Abs≡Tbs/Td, by their angular dimensions θhs and θbs, and by their positions relative to the line connecting the stars in the direction of orbital motion λhs and λbs. Additionally, θrad represents the angle between the line perpendicular to the local disk edge surface and the direction of maximum radiation from the hot spot. The disk radius is also gauged by the parameter Fd≡Rd/Ryk, where Ryk was defined by Djurašević (1992) as the distance from the center of the hotter star to its Roche lobe, measured perpendicular to the line joining the star centers. The model maintains that the disk remains stable only within the boundary Fd≤1, with any material beyond the Roche limit potentially escaping the system or forming a circumbinary envelope, particularly around the Lagrange equilibrium point L3. Following the previous investigation, the model sets the gravity-darkening coefficients for the stars β1=0.25 and β2=0.08, with albedo coefficients A1=1.0 and A2=0.5, where indexes 1 and 2 refer to the gainer and donor, respectively (Mennickent et al. 2019).
In addition, we kept the mass ratio fixed to q=M2/M1=0.203 and the orbital inclination to  , and also assumed synchronous rotation of the donor and 8.9 as the factor of the non-synchronous gainer's rotation (Mennickent et al. 2019). We considered T1=25 300 K, T2=9825 K, and the masses and radii as given in Sect. 1. The logarithm of the gravity of the gainer and the donor were set to 3.68 and 2.69, respectively. The orbital semimajor axis was taken as 49.91 R⊙. The stellar and orbital parameters of the binary are summarized in Table 3.
Summary of stellar and orbital parameters and their formal errors.
In addition, we calculated the relative mass transfer rate Ṁ using the approximation given by Mennickent & Djurašević (2021)
![Mathematical equation: $$ \frac {{\dot {M}}_{2,f}}{{\dot {M}}_{2,i}}= \frac { {{R}^2_{disk,f}} [A_{hs,f}T_{disk,f}]^{4} d_{e,f} \theta _{hs,f} }{{{R}^2_{disk,i}} [A_{hs,i}T_{disk,i}]^{4} d_{e,i} \theta _{hs,i}}. $$](/articles/aa/full_html/2025/06/aa52959-24/aa52959-24-eq4.gif) (2)
(2)
This formula enables us to calculate the relative mass transfer rates at various times, denoted by epochs i and f, within a specific system. To standardize the values of Ṁ we obtained, we referenced the minimum value, which was recorded at data set 15. These values are displayed in Table 4. The uncertainty was calculated by error propagation, considering a fixed mass transfer rate of the reference data set 15. The normalized mass transfer rates calculated in this way have a mean value of 6.81 with a standard deviation of 6.95, and maximum and minimum values of 23 and 1.
Data sets used in this paper.
3. Results
The results of the light curve fits are summarized in Table 5. We give the 12 model parameters plus the disk radius for each of the 20 data sets. The disk radius was obtained directly from Fd. The mean values and their standard deviations are also given along with typical formal errors. An analysis of the correlation matrix of the model parameters revealed no significant correlations indicative of potential parameter degeneracies.
Light curve fit parameters for the data segments.
We investigated closely the relationships between the derived parameters, especially their changes during the long-term cycle. We find that the relative mass transfer rate is probably the most interesting parameter driving the physical changes in the disk; we used sixth-order polynomial fits to the data to help to visualize the behavior of the disk parameters during the long-term cycle (Fig. 2). We observed that the normalized mass transfer rate increases during the long-term cycle maximum, both at the primary maximum and during the secondary maximum. The magnitude at orbital phase 0.25 follows fairly closely the long-term cycle, suggesting that the light responsible for this cycle is clearly visible at this system perspective. The disk central vertical thickness decreases at long-term cycle maximum, allowing greater visibility of the gainer star. The disk radius shows two maxima at ΦL=0.1 and 0.7. The disk's temperature follows the long-term cycle, with maxima roughly coinciding with the maxima of dM/dt and brightness.
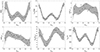 |
Fig. 2. Disk parameters and dM/dt, I0.25 values, as a function of the long-term cycle phase. Sixth-order polynomial fits along with the 95% confidence bands are shown. The parameters of these fits are given in Table A.1. |
Furthermore, additional information can be extracted from the light curve fits (Fig. A.1). The larger flux contribution of the gainer at epochs of maximum brightness is evident (data sets 1 and 20). This reinforces the hypothesis that in this system the long-term cycle reflects gainer obscuration cycles. The light curve fits are especially useful to evaluate the fractional light contribution of gainer, donor, and disk at different orbital and long-term cycle phases, depending on the disk accretion parameters.
On the other hand, medium or maxima dM/dt occur for medium-size disks with hot and bright spots relatively constrained in angular position. It is for low dM/dt that the disk attains extreme values for its radial extension, and the spots, especially the bright spots, can also reach locations farther from the donor (Fig. 3).
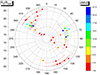 |
Fig. 3. Position and angular extension of the hot spots (dots) and bright spots (squares) are shown. The data are color-coded according to the normalized mass transfer rate. |
The double-hump nature of the long-term cycle light curve can be explained by local maxima of dM/dt and Tdisk around ΦL=0.5.
We find a slight dependence of the bright spot angular position on the parameter ΔI0.25, essentially a measure of the brightness of the system, and also with the disk temperature: the bright spot is located farther from the donor at fainter systems, corresponding to systems with cooler disks (Fig. 4). These are the systems with lower normalized mass transfer rates and larger sizes (Fig. 3). The mean positions of the hot and bright spots,  and
and  , respectively, can be compared with the expected positions of disk thickenings at 288° and 144°, predicted for a binary of q=0.2 (Kaigorodov et al. 2017). These thickenings are attributed to vertical oscillations of the gas at the outer edge of the accretion disk, induced by interactions with the matter stream from the inner Lagrangian point, L1.
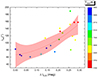 |
Fig. 4. Angular position of the bright spot as a function of ΔI0.25. The color indicates the disk temperature. The second-order polynomial fit is shown, along with the 95% confidence band. |
4. Discussion
The optically thick region of the disk, which primarily emits in the continuum, is examined using our model based on light curve fits, as well as the hot shock regions known as hot and bright spots. Consequently, we anticipate a relatively massive disk, likely stratified vertically. Given the observed significant variations in both the vertical height and radial extension of the disk, it is plausible to suggest that large, cyclic bursts of mass transported via the gas stream into the disk are responsible for these changes
After Lubow & Shu (1975) theoretically explored the gas dynamics in semidetached binaries, numerous studies delved into the complexities of disk-stream interactions. Overflow over the disk is anticipated under specific conditions (e.g., Dgani et al. 1989), and disk thickening along fixed lines of sight may result in dips in the light curve due to non-axisymmetric structures stemming from significant disk overflow (Armitage & Livio 1998; Kaigorodov et al. 2017). These simulations highlight that the response varies and depends on the physical properties of the stream and disk, such as density, temperature, and flow velocity (Godon 2019). Predictions from other simulations include shock-induced spiral waves and elongated hot spots in the disk. While much of the prior numerical and theoretical research focused on cataclysmic variables, Algol systems have received less scrutiny.
Conversely, the study by Blondin et al. (1995) presents two-dimensional hydrodynamic simulations of mass transfer in the Algol (beta Persei) binary system, highlighting differences from systems with long-period steady accretion disks. This research emphasizes how the dynamics of circumstellar gas flow are influenced by the stream's velocity, angle, and especially its density. It concludes that high-density streams generate stable isothermal flows, while low-density streams result in extended adiabatic accretion disks. At intermediate densities the formation of the disk is variable, corroborating observations of transient accretion disks in such systems. The interaction near the primary star is likely responsible for localized H-alpha emissions observed in Algol.
On the other hand, our simple model for OGLE-LMC-DPV-065 suggests that substantial changes in the disk occur over a long-term cycle. The disk radius changes from 10.6 to 26.1 R⊙ between data set 6 and data set 16. The central edge thickness of the disk varies from 7.6 (data sets 3 and 11) to 1.23 (set 20) R⊙, highlighting the importance of material reorganization and motions at scales beyond the classic scale height in the evolution of the system. These changes are significant and likely indicate the role played by the mass transfer rate in the process. Additionally, they suggest mass depletion as it is difficult to imagine that the disk mass increases throughout the cycle. At the present level of understanding, we can only speculate where the mass goes; escaping through the outer space via the Lagrangian L3 point or being accreted by the central star are possible paths. If the material is accreted, it could potentially accelerate the star since it carries angular momentum acquired during its passage from the donor to the disk. Another possible alternative is outflows through bipolar winds. Some of these scenarios have been proposed to explain certain spectral features, like asymmetrical emission lines observed in some DPVs as V 393 Sco (Mennickent et al. 2012) and V 405 Cen (Rosales Guzmán et al. 2018).
The fractional radius of the gainer, R1/a=0.18, reveals an almost tangential impact of the stream on the star, and that a disk has been formed following the ballistic trajectories of infalling particles (Lubow & Shu 1975).
During the 20-year time baseline the system shows systematic changes of the disk properties, in particular its vertical height at the outer edge. In hydrostatic equilibrium, the vertical height H of an accretion disk at radius Rd is
 (3)
(3)
where vk is the Keplerian velocity and cs the sound speed, which for an isothermal perfect gas can be approximated as
 (4)
(4)
(Eqs. (3.35) and (3.32) in Kolb 2010).
The mean parameters Rdisk=19.9 R⊙, de=4.91 R⊙, dc=5.11 R⊙, and R1=8.8 R⊙, yield de/Rd=0.25 and dc/R1=0.58. From the above equations and considering Tdisk=7698 K and T1=25 300 K we get (vk, cs) = (365, 9) and (547, 16) in km s−1 in the outer and inner disk, respectively, yielding H/R=0.02 and 0.03 in these borders. Considering that the vertical thickness is twice H, we conclude that the disk vertical height is much larger than expected for hydrodynamical equilibrium, suggesting that motions at scales beyond the classic scale height dominate the disk vertical structure at the inner and outer boundaries. In this calculation we considered mean disk properties, but this is true for all stages of disk evolution. In this context, it may be worth mentioning that in a detailed model of β Lyrae, the disk height had to be multiplied by a factor of about four times its expected equilibrium value in order to fit the observed value, possibly reflecting non-negligible hydrodynamic flows within the disk (Brož et al. 2021). These large-scale motions could be produced by the continuous injection of mass from the inner Lagrangian point, through a gas stream, into the accretion disk.
In principle, the disk can be stable until the last non-intersecting orbit defined by the tidal radius (Paczynski 1977; Warner 1995, Eq. (2.61)):
 (5)
(5)
Here we obtain Rt/aorb=0.50, or Rt=24.9 R⊙. We observe that often the disk outer radius stays within the volume defined by the tidal radius, but during data sets 12, 13, 14, and 16 the disk reaches and even exceeds this limit making it potentially unstable to tidal forces. This may allow some particles to escape the system. This occurs in the optically thick regions of the disk; the optically thinner regions, which manifest mostly in hydrogen emission lines, are not examined in this paper. These thinner regions form a less gravitationally bound envelope around the disk, which should facilitates their ejection from the system. The fact that the disk almost always remains within the tidal radius indicates that tidal forces are not significant in shaping the disk's form or driving changes in its properties during the long-term cycle.
5. Conclusion
For the first time, we reported evidence of structural changes in the accretion disk of OGLE-LMC-DPV-065, correlating with the long-term cycle. These changes are particularly pronounced in the disk's radial and vertical extensions, as well as its temperature fluctuations. This finding is significant, as the analyzed data sets, each of which captures a distinct segment of the long-term cycle, span multiple epochs over a 20-year observation period. Remarkably, despite variations in the long-term cycle across these epochs, our method of binning the data into a master long-term cycle based on phase intervals yielded coherent results. This consistency strongly suggests that the long-term cycle plays a pivotal role in regulating the disk's behavioral parameters. Notably, the system's brightness at orbital phase 0.25 closely mirrors the long-term cycle. Furthermore, our calculations suggest that the mass transfer rate peaks during the primary and secondary maxima of the long-term cycle. Concurrently, the disk appears thinner, exposing a larger portion of the gainer, which enhances overall brightness. This effect is augmented by an intermediate disk size that projects a significant fraction of light toward the observer's line of sight. Additionally, our analysis indicates that the disk temperature generally tracks the mass transfer rate, while the disk radius exhibits more complex behavior, displaying minima at ΦL=0.3 and maxima at ΦL=0.7. Finally, we find that the bright spot is located closer to the gainer at higher relative mass transfer rates.
In this study we presented evidence of a cyclically variable mass transfer rate from the donor to the accretion disk. However, the origin of this cyclic variability in the mass transfer rate remains unknown. Additionally, it is unclear what proportion of the injected mass is accreted by the gainer and what proportion is expelled from the system, potentially as a disk wind or through outflows at the Lagrangian L3 point, or both. Future spectroscopic studies will be crucial in addressing these uncertainties.
Acknowledgments
We acknowledge the comments and suggestions of the anonymous referee that revised the first version of this manuscript. We also acknowledge support by the ANID BASAL project Centro de Astrofísica y Tecnologías Afines ACE210002 (CATA). Thanks also to Juan Garcés for useful discussions on this article.
References
- Applegate, J. H. 1992, ApJ, 385, 621 [Google Scholar]
- Applegate, J. H., & Patterson, J. 1987, ApJ, 322, L99 [NASA ADS] [CrossRef] [Google Scholar]
- Armitage, P. J., & Livio, M. 1998, ApJ, 493, 898 [Google Scholar]
- Bisikalo, D. V., Harmanec, P., Boyarchuk, A. A., Kuznetsov, O. A., & Hadrava, P. 2000, A&A, 353, 1009 [NASA ADS] [Google Scholar]
- Blondin, J. M., Richards, M. T., & Malinowski, M. L. 1995, ApJ, 445, 939 [Google Scholar]
- Brož, M., Mourard, D., Budaj, J., et al. 2021, A&A, 645, A51 [EDP Sciences] [Google Scholar]
- Dennis, J. E., & Torczon, V. 1991, SIAM J. Optim., 1, 448 [Google Scholar]
- Dgani, R., Livio, M., & Soker, N. 1989, ApJ, 336, 350 [Google Scholar]
- Djurašević, G. 1992, Ap&SS, 196, 267 [Google Scholar]
- Djurašević, G. 1996, Ap&SS, 240, 317 [Google Scholar]
- Djurašević, G., Vince, I., & Atanacković, O. 2008, AJ, 136, 767 [Google Scholar]
- Garcés, L. J., Mennickent, R. E., Djurašević, G., et al. 2018, MNRAS, 477, L11 [CrossRef] [Google Scholar]
- Godon, P. 2019, ApJ, 870, 112 [NASA ADS] [CrossRef] [Google Scholar]
- Kaigorodov, P. V., Bisikalo, D. V., & Kurbatov, E. P. 2017, ARep, 61, 639 [NASA ADS] [Google Scholar]
- Kolb, U. 2010, Extreme Environment Astrophysics (Cambridge University Press) [Google Scholar]
- Lomax, J. R., Hoffman, J. L., Elias, N. M., Bastien, F. A., & Holenstein, B. D. 2012, ApJ, 750, 59 [CrossRef] [Google Scholar]
- Lubow, S. H., & Shu, F. H. 1975, ApJ, 198, 383 [NASA ADS] [CrossRef] [Google Scholar]
- Mennickent, R. E. 2017, SerAJ, 194, 1 [Google Scholar]
- Mennickent, R. E., & Djurašević, G. 2013, MNRAS, 432, 799 [NASA ADS] [CrossRef] [Google Scholar]
- Mennickent, R. E., & Djurašević, G. 2021, A&A, 653, A89 [NASA ADS] [CrossRef] [EDP Sciences] [Google Scholar]
- Mennickent, R. E., Pietrzyński, G., Diaz, M., & Gieren, W. 2003, A&A, 399, L47 [NASA ADS] [CrossRef] [EDP Sciences] [Google Scholar]
- Mennickent, R. E., Kołaczkowski, Z., Djurasevic, G., et al. 2012, MNRAS, 427, 607 [NASA ADS] [CrossRef] [Google Scholar]
- Mennickent, R. E., Otero, S., & Kołaczkowski, Z. 2016a, MNRAS, 455, 1728 [NASA ADS] [CrossRef] [Google Scholar]
- Mennickent, R. E., Zharikov, S., Cabezas, M., & Djurašević, G. 2016b, MNRAS, 461, 1674 [NASA ADS] [CrossRef] [Google Scholar]
- Mennickent, R. E., Cabezas, M., Djurašević, G., et al. 2019, MNRAS, 487, 4169 [NASA ADS] [CrossRef] [Google Scholar]
- Mennickent, R. E., Djurašević, G., Vince, I., et al. 2020, A&A, 642, A211 [NASA ADS] [CrossRef] [EDP Sciences] [Google Scholar]
- Mourard, D., Brož, M., Nemravová, J. A., et al. 2018, A&A, 618, A112 [NASA ADS] [CrossRef] [EDP Sciences] [Google Scholar]
- Paczynski, B. 1977, ApJ, 216, 822 [CrossRef] [Google Scholar]
- Pawlak, M., Graczyk, D., Soszynski, I., et al. 2013, AcA, 63, 323 [Google Scholar]
- Poleski, R., Soszyński, I., Udalski, A., et al. 2010, AcA, 60, 179 [Google Scholar]
- Richards, M. T. 2004, AN, 325, 229 [Google Scholar]
- Richards, M. T., Cocking, A. S., Fisher, J. G., & Conover, M. J. 2014, ApJ, 795, 160 [Google Scholar]
- Rosales Guzmán, J. A., Mennickent, R. E., Djurašević, G., Araya, I., & Curé, M., 2018, MNRAS, 476, 3039 [Google Scholar]
- Rosales, J. A., Petrović, J., Mennickent, R. E., et al. 2024, A&A, 689, A154 [NASA ADS] [CrossRef] [EDP Sciences] [Google Scholar]
- Schleicher, D. R. G., & Mennickent, R. E. 2017, A&A, 602, A109 [NASA ADS] [CrossRef] [EDP Sciences] [Google Scholar]
- Szymanski, M. K. 2005, AcA, 55, 43 [Google Scholar]
- Tauris, T. M., & van den Heuvel, E. P. J. 2023, Physics of Binary Star Evolution - From Stars to X-ray Binaries and Gravitational Wave Sources (Princeton University Press) [Google Scholar]
- Udalski, A., Szymański, M. K., & Szymański, G. 2015, AcA, 65, 1 [Google Scholar]
- Warner, B. 1995, in Cataclysmic Variable Stars, (Cambridge University Press), Cambridge Astrophys. Ser., 28 [CrossRef] [Google Scholar]
Appendix A: Additional figure and Table
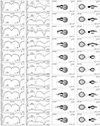 |
Fig. A.1. Orbital I-band differential light curves and the respective fits for segments listed in Table 2. The dashed line indicates the maximum brightness of the system in the orbital phase 0.25 during all the observations. All the brightness curves are normalized in relation to this maximum brightness. The flux contribution from the disk, gainer and donor are shown along the orbital phase, along with pictures showing the system appearance at different epochs. |
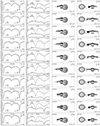 |
Fig. A.1. continued |
Parameters for the fits shown in Fig. 2.
All Tables
All Figures
|
Fig. 1. Light curve folded with the orbital period (left) and with the long-term cycle periods (right). All I-band data are shown, and are colored according to the long-term cycle or orbital phases. |
| In the text | |
|
Fig. 2. Disk parameters and dM/dt, I0.25 values, as a function of the long-term cycle phase. Sixth-order polynomial fits along with the 95% confidence bands are shown. The parameters of these fits are given in Table A.1. |
| In the text | |
|
Fig. 3. Position and angular extension of the hot spots (dots) and bright spots (squares) are shown. The data are color-coded according to the normalized mass transfer rate. |
| In the text | |
|
Fig. 4. Angular position of the bright spot as a function of ΔI0.25. The color indicates the disk temperature. The second-order polynomial fit is shown, along with the 95% confidence band. |
| In the text | |
|
Fig. A.1. Orbital I-band differential light curves and the respective fits for segments listed in Table 2. The dashed line indicates the maximum brightness of the system in the orbital phase 0.25 during all the observations. All the brightness curves are normalized in relation to this maximum brightness. The flux contribution from the disk, gainer and donor are shown along the orbital phase, along with pictures showing the system appearance at different epochs. |
| In the text | |
|
Fig. A.1. continued |
| In the text | |
Current usage metrics show cumulative count of Article Views (full-text article views including HTML views, PDF and ePub downloads, according to the available data) and Abstracts Views on Vision4Press platform.
Data correspond to usage on the plateform after 2015. The current usage metrics is available 48-96 hours after online publication and is updated daily on week days.
Initial download of the metrics may take a while.