Open Access
Fig. 7.
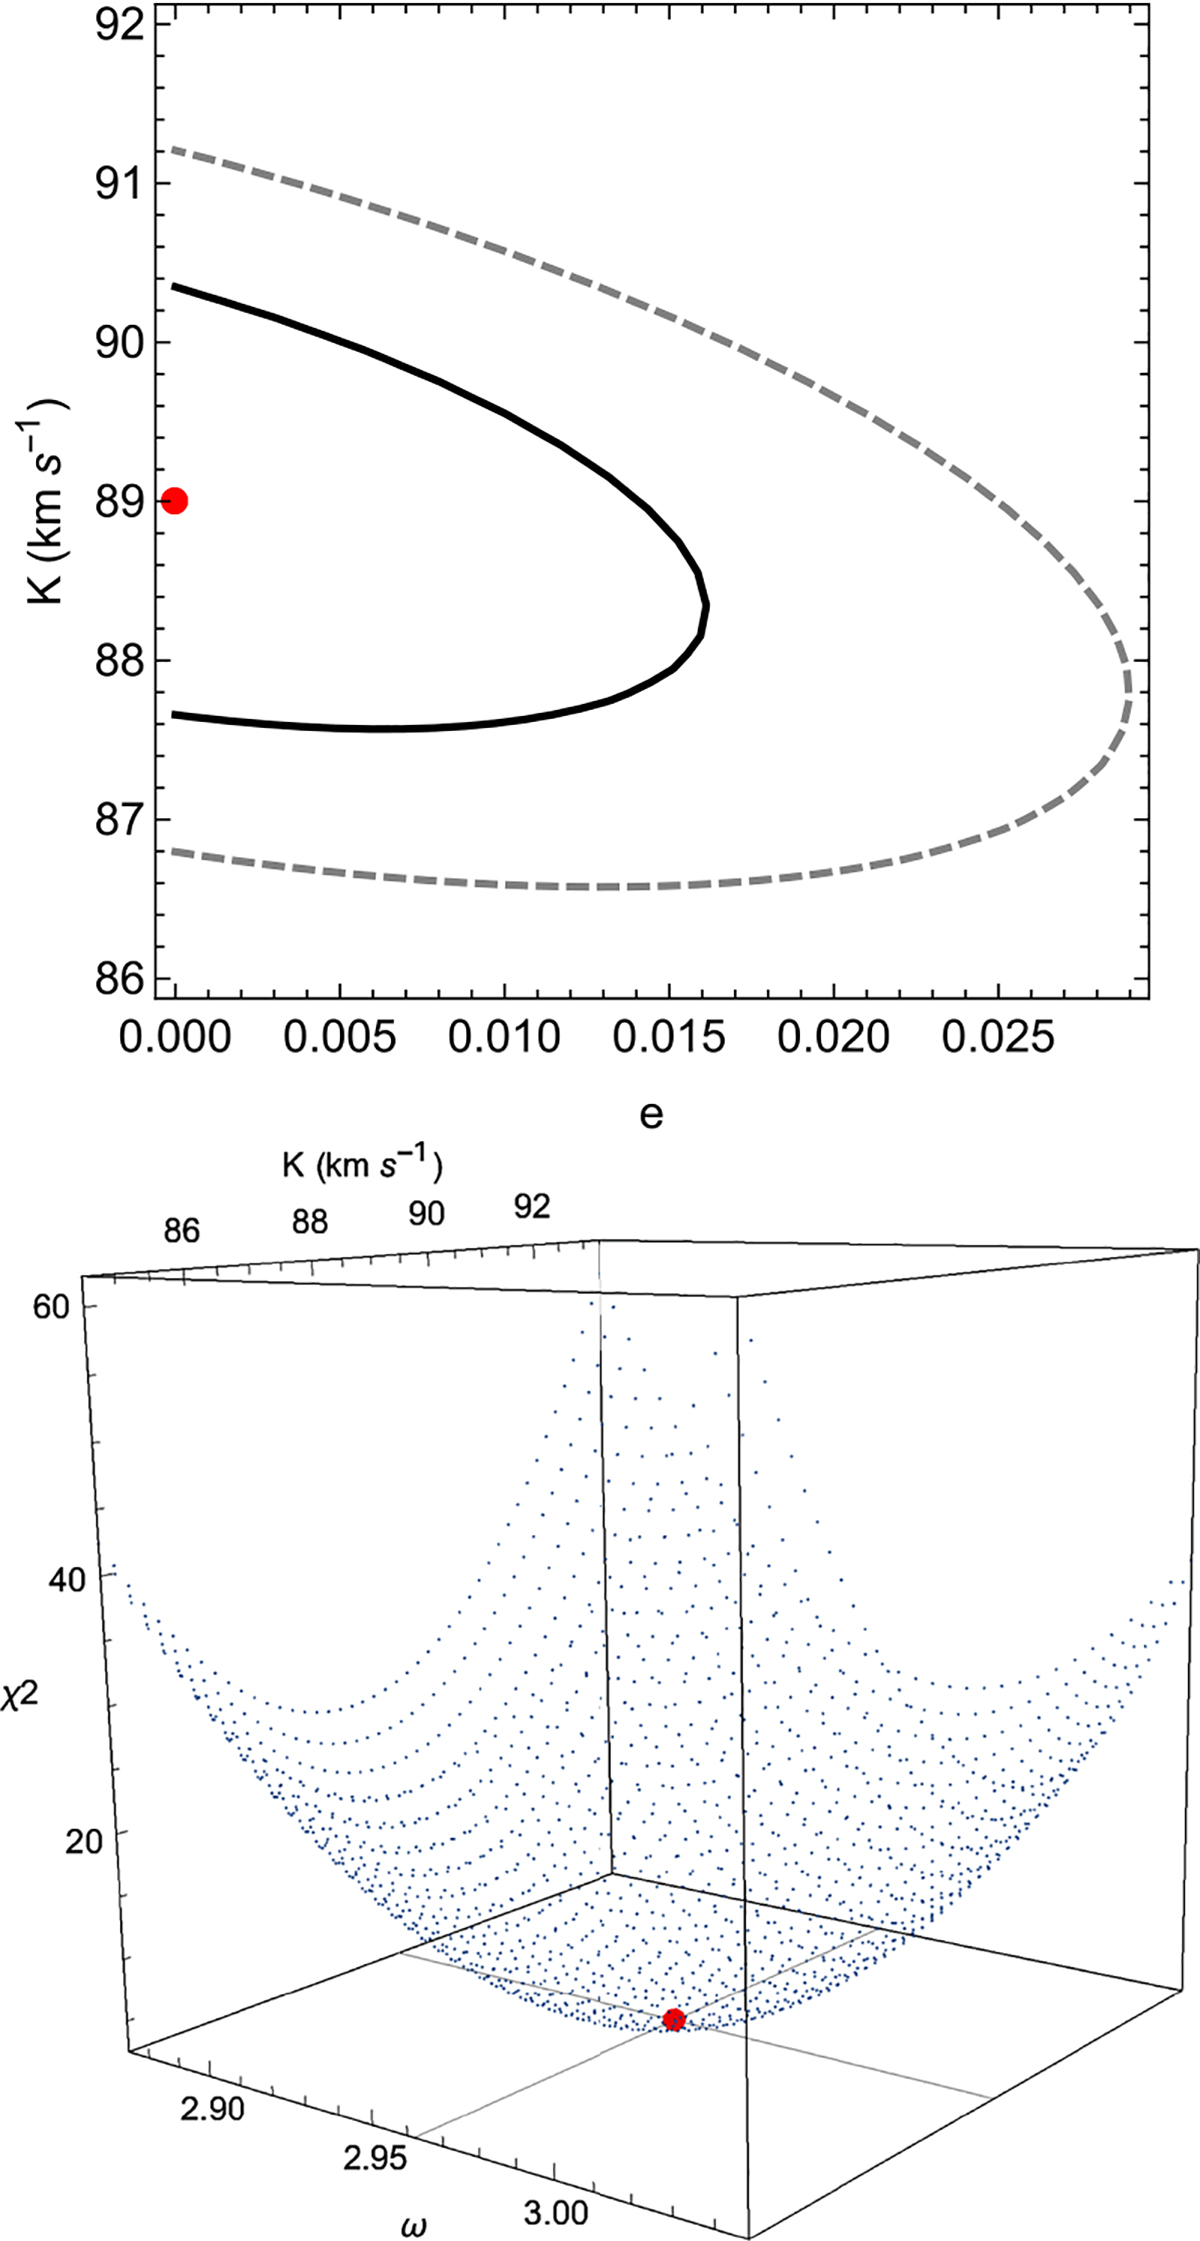
Download original image
Representation of χ2 distribution in the K − e plane computed through Montecarlo simulation (top). The solid-black and dashed-gray lines correspond to 1σ and 2σ iso-contours, and the red dot indicates the minimum χ2 solution. Contour corresponding to the Δχ2 that includes 68.3% of the probability (bottom).
Current usage metrics show cumulative count of Article Views (full-text article views including HTML views, PDF and ePub downloads, according to the available data) and Abstracts Views on Vision4Press platform.
Data correspond to usage on the plateform after 2015. The current usage metrics is available 48-96 hours after online publication and is updated daily on week days.
Initial download of the metrics may take a while.