Open Access
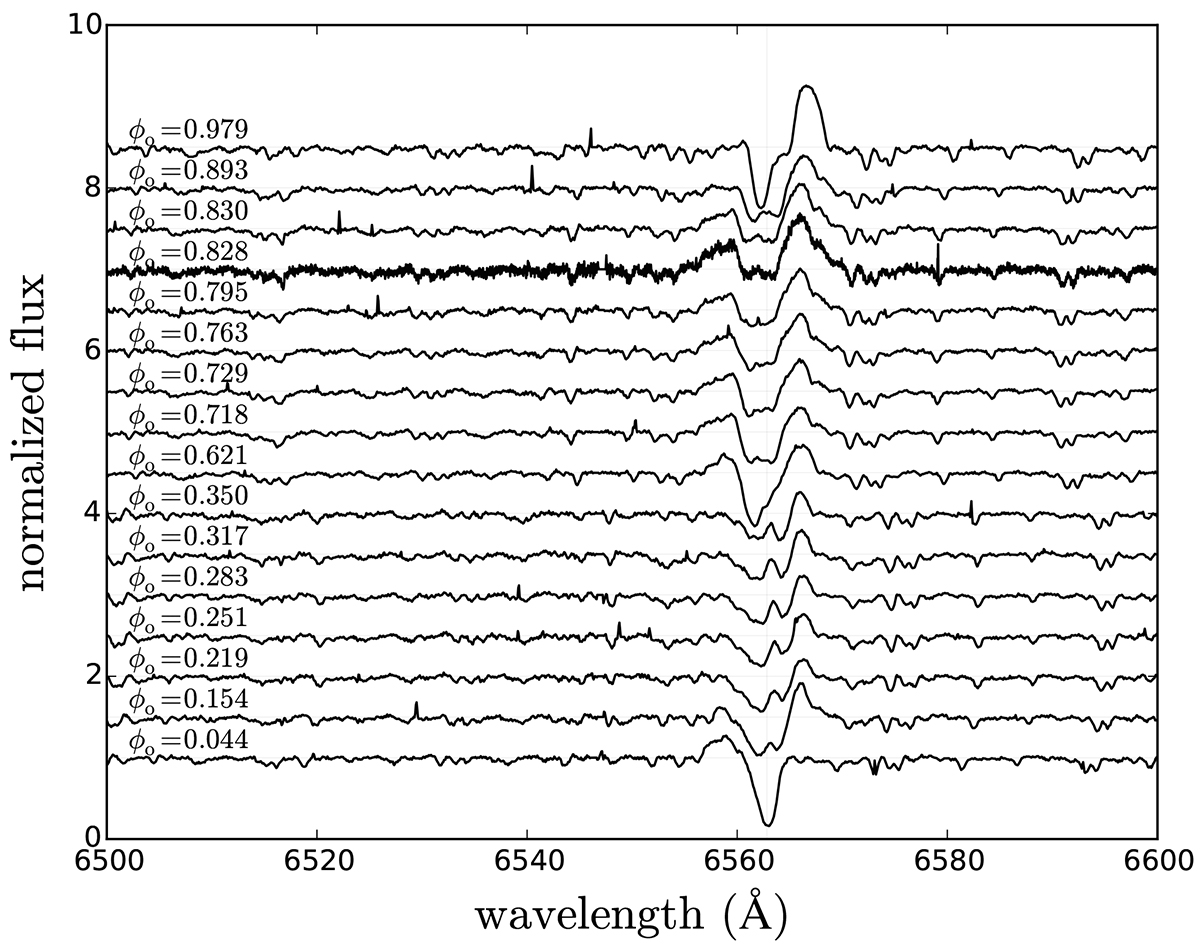
Fig. 9.
Download original image
Behaviour of Hα profile sorted by orbital phases and centered at 6562.817 Å for comparing the red-peak emission. The observed spectra show the donor and gainer flux contribution, i.e., these were not disentangled.
Current usage metrics show cumulative count of Article Views (full-text article views including HTML views, PDF and ePub downloads, according to the available data) and Abstracts Views on Vision4Press platform.
Data correspond to usage on the plateform after 2015. The current usage metrics is available 48-96 hours after online publication and is updated daily on week days.
Initial download of the metrics may take a while.