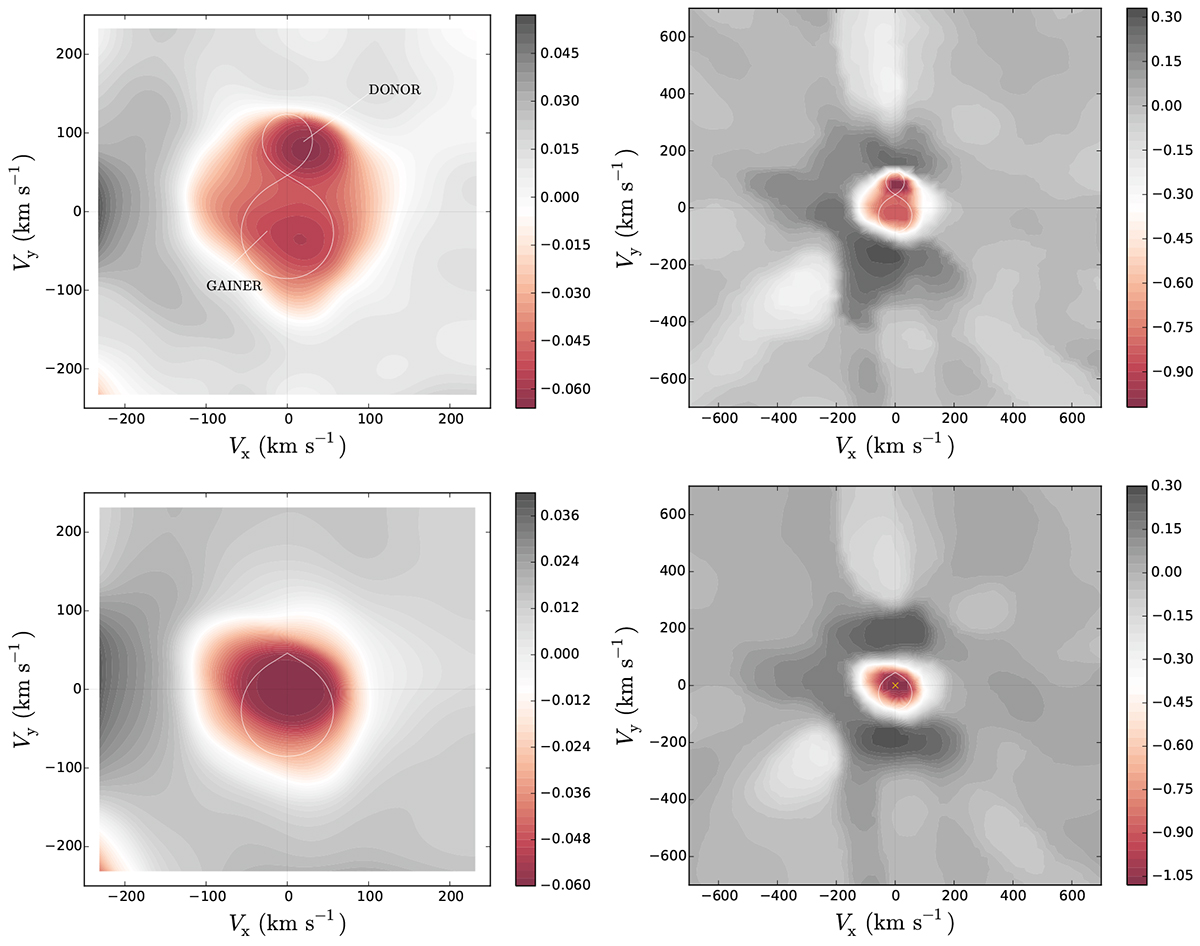
Fig. 20.
Download original image
Doppler map for V4142 Sgr which shows the gainer almost at the center of mass together with its companion (top-left). The structure of the accretion disk shows both slight and wide absorption zones (top-right). Contour lines represent levels of emission. Doppler map without donor contribution, showing diverse dense zones of absorption (bottom). The set of panels were calculated with different λ. Red zones indicate absorption and gray-black zones emission in the Hα line.
Current usage metrics show cumulative count of Article Views (full-text article views including HTML views, PDF and ePub downloads, according to the available data) and Abstracts Views on Vision4Press platform.
Data correspond to usage on the plateform after 2015. The current usage metrics is available 48-96 hours after online publication and is updated daily on week days.
Initial download of the metrics may take a while.