Fig. 10.
Download original image
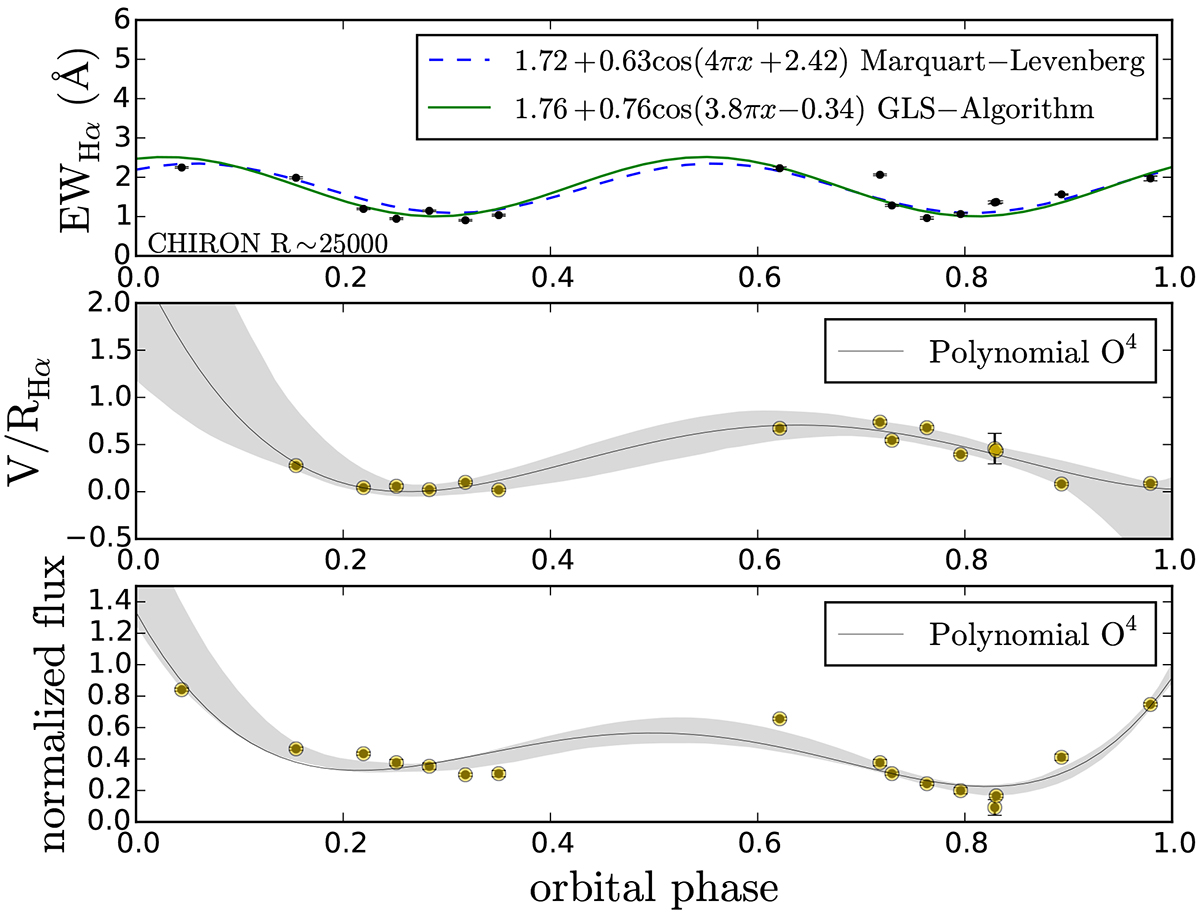
Equivalent width of Hα profile from gainer star during a complete orbital phase with donor contribution subtracted, using the CHIRON spectrograph (top). The dashed blue line corresponds to a Marquart-Levenberg fit using a fixed period 0.5Po and the continuum green line represents a GLS fit with a free period, revealing a period of ![]() . violet and red intensities (V/R) ratio of Hα profile, measured from the continuum of the gainer star (center). Variations in the depth of absorption line of Hα measured in the gainer star (bottom).
. violet and red intensities (V/R) ratio of Hα profile, measured from the continuum of the gainer star (center). Variations in the depth of absorption line of Hα measured in the gainer star (bottom).
Current usage metrics show cumulative count of Article Views (full-text article views including HTML views, PDF and ePub downloads, according to the available data) and Abstracts Views on Vision4Press platform.
Data correspond to usage on the plateform after 2015. The current usage metrics is available 48-96 hours after online publication and is updated daily on week days.
Initial download of the metrics may take a while.