| Issue |
A&A
Volume 668, December 2022
|
|
|---|---|---|
| Article Number | A130 | |
| Number of page(s) | 38 | |
| Section | Extragalactic astronomy | |
| DOI | https://doi.org/10.1051/0004-6361/202245043 | |
| Published online | 13 December 2022 | |
The resolved scaling relations in DustPedia: Zooming in on the local Universe⋆
1
INAF – Istituto di Radioastronomia, Via P. Gobetti 101, 40129 Bologna, Italy
e-mail: This email address is being protected from spambots. You need JavaScript enabled to view it.
2
INAF – Osservatorio Astrofisico di Arcetri, Largo E. Fermi 5, 50125 Firenze, Italy
3
Department of Physics and Astronomy, N283 ESC, Brigham Young University, Provo, UT 84602, USA
4
Sterrenkundig Observatorium Universiteit Gent, Krijgslaan 281 S9, 9000 Gent, Belgium
5
INAF – Osservatorio di Astrofisica e Scienza dello Spazio, Via Gobetti 93/3, 40129 Bologna, Italy
6
INAF – Istituto di Astrofisica Spaziale e Fisica cosmica, Via A. Corti 12, 20133 Milano, Italy
7
Space Telescope Science Institute, 3700 San Martin Drive, Baltimore, MD 21218, USA
8
Instituto de Radioastronomía y Astrofísica, UNAM, Campus Morelia, A.P. 3-72, C.P., Morelia 58089, Mexico
9
AIM, CEA, CNRS, Université Paris-Saclay, Université Paris-Diderot, Sorbonne Paris-Cité, 91191 Gif-sur-Yvette, France
10
National Observatory of Athens, IAASARS, Ioannou Metaxa and Vasileos Pavlou, 15236 Athens, Greece
11
Dipartimento di Fisica e Astronomia, Universitá of Bologna, Via Gobetti 93/2, 40129 Bologna, Italy
12
ICRAR – University of Western Australia, 35 Stirling Highway, Crawley, WA 6009, Australia
13
ARC Centre of Excellence for All-Sky Astrophysics in 3 Dimensions (ASTRO 3D), ACT, Australia
14
Institut d’Astrophysique Spatiale, Université Paris-Saclay, 91405 Orsay, France
Received:
22
September
2022
Accepted:
25
October
2022
Abstract
Aims. We perform a homogeneous analysis of an unprecedented set of spatially resolved scaling relations (SRs) between interstellar medium (ISM) components, that is to say dust, gas, and gas-phase metallicity, and other galaxy properties, such as stellar mass (Mstar), total baryonic content, and star-formation rate (SFR), in a range of physical scales between 0.3 and 3.4 kpc. We also study some ratios between galaxy components: dust-to-stellar, dust-to-gas, and dust-to-metal ratios.
Methods. We use a sample of 18 large, spiral, face-on DustPedia galaxies. The sample consists of galaxies with spatially resolved dust maps corresponding to 15 Herschel-SPIRE 500 μm resolution elements across the optical radius, with the morphological stage spanning from T = 2 to 8, Mstar from 2 × 10⁹ to 1 × 10¹¹ M⊙, SFR from 0.2 to 13 M⊙ yr−1, and oxygen abundance from 12 + log(O/H) = 8.3 to 8.8.
Results. All the SRs are moderate or strong correlations except the dust-H I SR that does not exist or is weak for most galaxies. The SRs do not have a universal form but each galaxy is characterized by distinct correlations, affected by local processes and galaxy peculiarities. The SRs hold, on average, starting from the scale of 0.3 kpc, and if a breaking down scale exists it is below 0.3 kpc. By evaluating all galaxies together at the common scale of 3.4 kpc, differences due to peculiarities of individual galaxies are cancelled out and the corresponding SRs are consistent with those of whole galaxies. By comparing subgalactic and global scales, the most striking result emerges from the SRs involving ISM components: the dust-total gas SR is a good correlation at all scales, while the dust-H2 and dust-H I SRs are good correlations at subkiloparsec/kiloparsec and total scales, respectively. For the other explored SRs, there is a good agreement between small and global scales and this may support the picture where the main physical processes regulating the properties and evolution of galaxies occur locally. In this scenario, our results are consistent with the hypothesis of self-regulation of the star-formation process. The analysis of subgalactic ratios between galaxy components shows that they are consistent with those derived for whole galaxies, from low to high redshift, supporting the idea that also these ratios could be set by local processes.
Conclusions. Our results highlight the heterogeneity of galaxy properties and the importance of resolved studies on local galaxies in the context of galaxy evolution. They also provide fundamental observational constraints to theoretical models and updated references for high-redshift studies.
Key words: galaxies: ISM / galaxies: evolution / dust / extinction / ISM: atoms / ISM: molecules / ISM: abundances
DustPedia is a project funded by the European Union under the heading “Exploitation of space science and exploration data”. It has the primary goal of exploiting existing data in the Herschel Space Observatory and Planck Telescope databases.
© The Authors 2022
 Open Access article, published by EDP Sciences, under the terms of the Creative Commons Attribution License (https://creativecommons.org/licenses/by/4.0), which permits unrestricted use, distribution, and reproduction in any medium, provided the original work is properly cited.
This article is published in open access under the Subscribe-to-Open model. This email address is being protected from spambots. You need JavaScript enabled to view it. to support open access publication.
1. Introduction
The scaling relations (SRs) between main global galaxy properties are largely used tools to study the internal physics of different galaxy populations and their formation and evolutionary histories. Among the first studied relationships, there has been the Tully-Fisher relation for spiral galaxies (Tully & Fisher 1977), an empirical relation between the mass or intrinsic luminosity of a galaxy, and its asymptotic rotation velocity or emission line width. Another deeply studied correlation is the fundamental plane for elliptical galaxies (Djorgovski & Davis 1987; Jorgensen et al. 1996), a set of bivariate correlations connecting some of the galaxy properties such as the effective radius, average surface brightness, and central velocity dispersion. Since the early 2000s, several efforts have been devoted to characterize the correlation between the stellar mass (Mstar) and star-formation rate (SFR) in galaxies, the so-called star-forming main sequence (SFMS or MS, e.g., Brinchmann et al. 2004; Daddi et al. 2007; Elbaz et al. 2007; Santini et al. 2009, 2017; Peng et al. 2010; Rodighiero et al. 2014; Schreiber et al. 2015; Tomczak et al. 2016). In the meantime, other correlations have been found between Mstar and the average oxygen abundance, the mass-metallicity (MZ) relation (e.g., Lequeux et al. 1979; Garnett & Shields 1987; Vila-Costas & Edmunds 1992; Tremonti et al. 2004; Erb et al. 2006), and between the SFR and the surface density of cold gas in disks, the Kennicutt-Schmidt (KS) star formation (SF) relation (Schmidt 1959, 1963; Kennicutt 1998a,b). Variations of these correlations have been largely explored, in particular changing the method of derivation of galaxy properties involved in the studied SRs. In the recent years, the number of works dedicated to the interstellar medium (ISM) SRs has also grown, with an increasing level of refinement such as separating the different components of the ISM (e.g., Saintonge et al. 2011; Corbelli et al. 2012; Boselli et al. 2014; Cortese et al. 2016; Catinella et al. 2018; Lamperti et al. 2019; Lisenfeld et al. 2019; Casasola et al. 2020, hereafter C20 De Looze et al. 2020; Ginolfi et al. 2020; Hunt et al. 2020; Dunne et al. 2022; Saintonge & Catinella 2022). Some of the explored SRs (e.g., MS and MZ) have also been confirmed at various redshifts, showing a dependence on the cosmological time and thus allowing us to trace the evolution of galaxy properties with time (e.g., Davé et al. 2011).
To intimately understand the fundamental physics underlying the global SRs, it is necessary to look at small spatial scales, approaching the intrinsic scale of the SF process, that is the size of the giant molecular clouds (GMCs, from a few parsecs to a few hundred parsecs, Solomon et al. 1987). The GMCs, that is the major reservoirs of molecular gas, are indeed the sites of most SF in our Galaxy and other galaxies, and their properties set the initial conditions for protostellar collapse. Due to the explosion in multiwavelength resolved data, made possible with surveys on large samples of nearby galaxies with instruments covering different spectral bands (e.g., UV: GUViCS, Boselli et al. 2011; Optical: MaNGA, Bundy et al. 2015; SAMI, Croom et. al. 2012; VESTIGE, Boselli et al. 2018; NIR: S4G, Sheth et al. 2010; FIR: KINGFISH, Kennicutt et al. 2011; Boselli et al. 2010; CO: HERACLES-IRAM 30 m, Leroy et al. 2009; ALLSMOG: Cicone et al. 2017; COMING, Sorai et al. 2019; H I: VLA THINGS survey, Walter et al. 2008; xGASS, Catinella et al. 2018) and the detailed work of homogenization of preexistent data to collect large amounts of coherent observations (e.g., DustPedia, Davies et al. 2017), it is now possible to investigate the main SRs also on the subgalactic scale. In the literature one refers to such subgalactic SRs, typically at kiloparsec scales, as resolved SRs (e.g., Viaene et al. 2014; Roychowdhury et al. 2015; Barrera-Ballesteros et al. 2016, 2021; Cano-Díaz et al. 2016, 2019; Hsieh et al. 2017; Pan et al. 2018; Lin et al. 2019; Vulcani et al. 2019; Enia et al. 2020; Morselli et al. 2020; Ellison et al. 2021; Sánchez et al. 2021; Abdurro’uf et al. 2022; Baker et al. 2022). Most of these works focused on the SF relations, that is those between stellar mass surface density (Σstar), molecular gas mass surface density (ΣH2), and SFR surface density (ΣSFR).
In this paper, we study an unprecedented set of resolved SRs involving molecular, atomic and total gas, dust, gas-phase metallicity, stars, total baryonic content, SFR, and some ratios of these quantities in the sample of 18 nearby, face-on, spiral galaxies presented by Casasola et al. (2017, hereafter C17) and extracted from the DustPedia1 sample (we refer to Davies et al. 2017, for a detailed description of the DustPedia project and sample). In C17 we have characterized the radial distribution of dust, stars, gas, and SFR of the sample, and the main result was that, on average, the dust-mass surface-density exponential scale length is about 1.8 times higher than the stellar scale length. Here we study a collection of SRs for individual galaxies in the range of physical scales from 0.3 to 3.4 kpc and for all the sample galaxies evaluated together at the common scale of 3.4 kpc, providing useful information for those who want to study a given galaxy of our sample and/or need mean trends at subgalactic scales. The galaxy sample offers the possibility to study SRs at different resolved physical scales searching for the definition of universal calibrations and/or of breakdown scales, if any. The aim of this paper is therefore to give a view that is as complete as possible of the resolved SRs in spiral galaxies of the local Universe. The paper is organized as follows. In Sect. 2 we outline the sample selection, in Sect. 3 we describe the data used in this work, and in Sect. 4 their treatment is provided. We present the results in Sects. 5 and 6, and we discuss them in Sect. 7. In Sect. 8 we summarize the entire work. The paper also includes Appendices A–C with additional matter.
2. The galaxy sample
We use the galaxy sample of C17 consisting of 18 DustPedia nearby, large, spiral galaxies with a small (or moderate) disk inclination. These galaxies have a diameter D25 ≥ 7 82 and a Hubble stage T ranging from 2 to 8. They have been imaged over their whole extent with both PACS and SPIRE in Herschel and they have a submillimeter diameter Dsubmm ≥ 9′, corresponding at least to 15 spatial resolution elements in the SPIRE 500 μm maps (FWHM = 36″). For this latter reason, we define these galaxies as resolved in dust emission. Sample galaxies have Mstar from 2 × 10⁹ to 1 × 10¹¹ M⊙, SFR from 0.2 to 13 M⊙ yr−1, and oxygen abundance from 12 + log(O/H) = 8.3 to 8.8. The sample includes galaxies characterized by different peculiarities, such as the presence of bars, of signatures of interaction with companions, and/or of an active galactic nucleus (AGN). Tables 1 and 2 summarize the main properties and global masses and SFR of galaxies, respectively. Galaxies are sorted in increasing distance order. We refer to C17 for further details on the galaxy sample and its selection.
Main properties of galaxies.
Global masses and SFR of galaxies.
3. The dataset
In this section we present the set of maps used for this study. Most of these maps come from the dataset of C17 and, when available, new gas maps have been added. We use mass surface density maps of various galactic components (dust, molecular, atomic and total gas, stars, and total baryonic content) and of the SFR. All maps are corrected for inclination i (see Table 1). We focus on the region within the optical disk (r ≤ r25) for all maps of all galaxies. This represents a sort of normalization parameter, already used in the literature (e.g., C20, Morselli et al. 2020).
3.1. The dust and stellar mass and SFR maps
We use dust mass, stellar mass and SFR surface density maps produced for the analysis performed in C17. Details on the derivation of these maps are given in C17. Here we recall their main steps. The dust mass surface density has been derived by comparing a modeled SED, convolved with the Herschel filter response functions, with the observed data at each position within a galaxy. We adopted the optical properties and grain size distributions of the THEMIS3 dust model, as described in Jones et al. (2013) and its updates (Köhler et al. 2014; Ysard et al. 2015; Jones et al. 2017).
We use the maps of the stellar mass surface density derived by means of the Spitzer-IRAC 3.6 and 4.5 μm images and following the prescription of Querejeta et al. (2015). This method has the advantage of isolating the old stellar light from contaminant emission (e.g., hot dust and the 3.3 μm polycyclic aromatic hydrocarbon feature) in the 3.6 and 4.5 μm bands, that is able to significantly contribute to the 3.6 μm flux (see Meidt et al. 2012).
We use the SFR surface density maps derived from GALEX-FUV emission corrected for dust extinction using WISE 22 μm emission according to the calibration of Bigiel et al. (2008), by replacing the 24 μm intensity with the 22 μm emission. This calibration is based on the stellar initial mass function of Calzetti et al. (2007), consisting of two power laws, with slope of −1.3 in the range 0.1 − 0.5 M⊙ and slope of −2.3 in the range 0.5 − 120 M⊙ (see also Leitherer et al. 1999). This combined (GALEX-FUV + WISE 22 μm) SFR calibration is widely used in the literature (e.g., Cortese 2012; Huang & Kauffmann 2015; Muraoka et al. 2019; Yajima et al. 2021).
The maps of dust and stellar mass surface density and of SFR surface density are available for the entire sample. The uncertainties on these maps take into account uncertainties associated with the methods used for their derivation.
3.2. The gas mass maps
We use molecular (H2) and atomic (H I) gas mass surface density maps from C17 with some updates. Table 3 collects the gas dataset used in this work. The ΣH2 maps have been derived by both 12CO(1–0) and 12CO(2–1) emission line observations, based on available data, under the assumption of optically thick 12CO emission. The derived ΣH2 maps do not take into account the contribution of helium. We adopt both a constant value for the CO-to-H2 conversion factor (XCO = N(H2)/ICO, where N(H2) is the molecular gas column density in cm−2 and ICO is the CO line intensity in K km s−1) and a metallicity-dependent conversion factor. We aim at exploring the effect of these two assumptions on XCO, which provide a conservative range of molecular gas mass estimations, on the spatially resolved SRs. We adopt the constant value of XCO = 2.0 × 1020 cm−2 (K km s−1)−1 with ±30% uncertainty (e.g., Bolatto et al. 2013), corresponding to a CO-to-H2 conversion factor expressed in terms of αCO (αCO = M(H2)/LCO, where M(H2) is the H2 mass in M⊙ and LCO the CO line luminosity in K km s−1 pc2) of αCO = 3.2 M⊙ pc−2 (K km s−1)−1 (Narayanan et al. 2012). We assume the calibration for the metallicity-dependent XCO by Amorín et al. (2016): log(αCO) = 0.68 − 1.45[12 + log(O/H − 8.7)], corresponding to XCO ∝ (Z/Z⊙)−1.5. This calibration provides a value of αCO including the contribution of helium, so we correct the relation of Amorín et al. (2016) to be consistent with our measurements of H2 mass. The calibration of Amorín et al. (2016) is derived combining low-metallicity starburst galaxies with more metal-rich galaxy objects, including the Milky Way and Local Volume galaxies from Leroy et al. (2011), and is in agreement with other observational determinations (e.g., Genzel et al. 2012; Schruba et al. 2012) and model predictions (e.g., Wolfire et al. 2010). The calibration of Amorín et al. (2016) is also consistent with the more recent determination by Hunt et al. (2020) of a XCO ∝ (Z/Z⊙)−1.55 in local star-forming galaxies. The adopted calibrations of XCO by Bolatto et al. (2013) and Amorín et al. (2016) are the same ones used in the study of the global ISM SRs for DustPedia late-type galaxies of C20, allowing therefore a consistent comparison of the SRs between small and global scales. In the case of the use of 12CO(2–1) observations, we assumed a 12CO line ratio R21 = ICO(2 − 1)/ICO(1 − 0) = 0.7, a typical value for nearby spiral galaxies (e.g., Schruba et al. 2011; Leroy et al. 2013; Casasola et al. 2015; Yajima et al. 2021). This value of R21 is also consistent within the errors with that recently determined by den Brok et al. (2021), R21 = 0.64 ± 0.09.
Gas maps used in this work.
With respect to the CO data used in C17, we added the following: (i) the 12CO(1–0) map of NGC 5236 obtained with the Nobeyama 45 m radio telescope and available thanks to the Nobeyama CO Atlas of Nearby Spiral Galaxies survey (Kuno et al. 2007; ii) the 12CO(2–1) map of NGC 3621 obtained with ALMA and available thanks to the PHANGS survey4 (Leroy et al. 2021b; iii) the 12CO(1–0) map of NGC 3521 obtained with the Nobeyama 45 m radio telescope and available thanks to the COMING survey (Sorai et al. 2019); iv) the 12CO(1–0) map for NGC 1365 obtained with ALMA and available in the ALMA Science Archive5. In particular, we replace the IRAM–30m 12CO(2–1) map of NGC 3521 used in C17 with 12CO(1–0) observations mentioned above. This substitution is dictated by the fact that the use of the 12CO(1–0) emission line eliminates the uncertainty on the R21 line ratio in the H2 mass derivation and the COMING map, differently by that used in C17, covers the entire optical radius of NGC 3521. As regards NGC 3621, we point out that the PHANGS survey provides 12CO(2–1) maps convolved to angular resolutions of 2″, 7 5, 11″, and 15″, in addition to the native resolution of ∼1″. Since we compare maps at 36″ resolution, we use the 12CO(2–1) PHANGS map of NGC 3621 at 15″ resolution. We use the integrated intensity map obtained by the high completeness “broad” masking scheme, optimized to include all emission from the galaxy (for details on PHANGS-ALMA Data Processing and Pipeline see Leroy et al. 2021a,b). The new 12CO data adopted in this work are treated following the same prescriptions described above and in C17 in order to derive ΣH2 maps. Combining all 12CO data, ΣH2 maps are available for 15/18 sample galaxies (they would be 16/18 but NGC 3031 is not detected in CO, see Table 3). The uncertainties on ΣH2 maps are calculated as the quadrature sum of the uncertainty on the 12CO flux and on the XCO conversion factor. Under the assumption of the metallicity-dependent XCO, uncertainties in ΣH2 take also into account uncertainties on the metallicity maps (see Sect. 3.4) and on the calibration of XCO with the metallicity.
We use maps of the atomic gas mass surface density (ΣHI) from C17, derived from H I 21 cm line intensity images under the assumption of optically thin H I emission. The produced ΣHI maps do not take into account the contribution of the helium. The ΣHI maps are available for 15/18 sample galaxies. The uncertainties on ΣHI maps take into account uncertainties associated to H I observations.
Combining available data on molecular and atomic gas, we have produced total gas-mass surface-density maps summing atomic and molecular gas masses and correcting this sum for the helium contribution by multiplying by a factor of 1.36 (see Schruba et al. 2011), Σtot gas = 1.36 × (ΣHI + ΣH2). The Σtot gas maps are available for 13/18 sample galaxies.
3.3. The total baryonic content maps
We produce total baryonic content maps summing stellar, total gas, and dust masses, Σbar = Σstar + Σtot gas + Σdust. We stress how complete estimations of Σbar such as the ones presented here have rarely been attempted in the similar studies. Taking into account the analysis of all galaxies evaluated together at 3.4 kpc scale, for the almost totality of the ≥3σ pixels Σstar > Σtot gas and all ≥3σ pixels have a mean value Σstar/Σtot gas = 11.74 ± 0.62. The Σbar maps are available for 13/18 sample galaxies.
3.4. The gas-phase metallicity maps
We use the oxygen abundance, 12 + log(O/H), to trace the gas-phase metallicity in our sample of galaxies. We adopt a solar oxygen abundance of 12 + log(O/H) = 8.69 ± 0.05 from Asplund et al. (2009). Among the various gas-phase metallicity determinations for DustPedia galaxies provided in De Vis et al. (2019), we select the empirical calibration N2 from Pettini & Pagel (2004), based on the ratio of [N II] λ6584Å and Hα, since it is available for all sample galaxies, except for NGC 4725 (see Table 1). The N2 metallicities at the galactocentric distance r = 0.4r25 of our galaxy sample span from 12 + log(O/H)N2 = 8.3 to 8.8 and the metallicity gradients from 0.0 to −0.5 dex  . Azimuthally averaged metallicity maps were derived from these values, and from the galaxy inclinations and position angles used by De Vis et al. (2019).
We decide to discard the values of metallicity gradients derived from the N2 calibration of NGC 5194 and NGC 1097 because they are unreliable and quite unusual for typical nearby spiral galaxies (e.g., Magrini et al. 2011, 2016; Sánchez et al. 2014; Belfiore et al. 2017; Maiolino & Mannucci 2019; Yates et al. 2021). We have checked the values of the slopes and intercepts of the metallicity gradients of these two DustPedia galaxies provided by other calibrations (e.g., O3N2, Pettini & Pagel 2004; KK04, Kobulnicky & Kewley 2004; PG16S, Pilyugin & Grebel 2016) and collected in De Vis et al. (2019). The galaxies NGC 5194 and NGC 1097 have negative, positive, or flat metallicity gradients, depending on the adopted strong line ratio and relative calibration. We refer to De Vis et al. (2019) for the discussion on the comparison between different metallicity calibrations for DustPedia galaxies (see also e.g., Maiolino & Mannucci 2019; Yates et al. 2021, for similar comparisons). Fortunately, Croxall et al. (2015) detected the temperature-sensitive auroral lines [O III] λ4363Å, [N II] λ5755Å and [S III] λ6312Å for 28 H II regions of NGC 5194, permitting the derivation of the oxygen abundance from the so-called direct method, as part of the CHemical Abundances of Spirals project (CHAOS, Berg et al. 2015). Croxall et al. (2015) found that the central O/H abundance of NGC 5194 is roughly solar or possibly slightly super-solar by 10%−30%, depending on the adopted solar oxygen abundance, and this galaxy has a relatively flat metallicity gradient with a slope of −0.30 dex  (or −0.023 dex kpc−1), consistent with the findings of Bresolin et al. (2004). Since the mean O/H abundance of NGC 5194 derived from the N2 calibration is consistent with the values derived from direct measures (see Table 1), we adopt the O/H gradient found by Croxall et al. (2015, see their Eq. (3)). To our knowledge, a direct measurement of the oxygen abundance for NGC 1097 is instead not available. For this galaxy, we prefer to use the estimate of the mean metallicity.
Although the use of the metallicity gradient instead of the mean metallicity should contribute to refine the results, we have to remind the readers of one main caveat in our approach. We use metallicity maps derived from metallicity gradients instead of “real” and complete metallicity maps. In this way we have neglected the azimuthal variations that may be present at each galactocentric radius or local chemical inhomogeneities as present, for example, in H II regions (e.g., Rosolowsky & Simon 2008; Sanders et al. 2012; Clark et al. 2019). However, it is also worth mentioning that in massive spiral galaxies the metallicity variation is dominated by the radial gradient while the azimuthal scatter is marginal (e.g., Berg et al. 2015; Croxall et al. 2016; Kreckel et al. 2019). Therefore, our approach is legitimate and it is expected to give a good approximation of the real map.
The metallicity maps are available for 17/18 sample galaxies. The uncertainties on the metallicity maps are calculated as the quadrature sum of the uncertainties on the mean metallicity and on the metallicity gradient.
4. Treatment of data
4.1. Image convolution and resizing
All images are convolved at the resolution of 36″, the same of the Σdust maps. This resolution is that of the Herschel-SPIRE 500 μm maps used in the spectral energy distribution (SED) fitting procedures in C17. All maps are resampled to a pixel size equal to the adopted dust resolution, 36″, that is one pixel per beam (see, e.g., Viaene et al. 2014; Vutisalchavakul et al. 2014; Casasola et al. 2015; Saikia et al. 2020, for a similar treatment of images). This choice differs from that adopted in C17 where the maps have been resampled to a pixel size equal to 12″(1/3 × FWHM). Studying pixel-by-pixel SRs, we prefer to assume the pixel size equivalent to the spatial resolution so that the pixels can be considered as roughly statistically independent, and there should be little correlation among them. In other words, each pixel is treated as a single datapoint.
We also produced an additional set of maps regridded to the common 3.4 kpc scale, that is the physical scale corresponding to 36″ for the most distant galaxy in the sample (NGC 1097). Consistent with what is discussed above, also in this case the pixel size of all maps is resampled to the angular scale corresponding to 3.4 kpc for each galaxy. The galaxies NGC 3621 and NGC 4736 are excluded from the analysis at 3.4 kpc because the convolution at this resolution produces maps of only 4 pixels size.
With all collected and properly treated maps, we explore several resolved (pixel-by-pixel) SRs. These procedures were performed using CASA6 (versions from 5.1.1 to 5.1.5), IDL7, IRAM/GILDAS8, and IRAF9 software packages.
4.2. Fitting method
After eliminating possible corrupted pixels and pixels with negative values, we use those with ≥3σ significance within r25 of all galaxy maps in order to study the pixel-by-pixel SRs. We stress that the ≥3σ pixels represent ∼97–100% of the pixels within the optical radius of the explored galaxies. Given the low number of nondetections within r25, their exclusion has no systematic impact on the inferred slopes as a function of the spatial scale, contrary to what may happen when exploring the entire galactic extension (e.g., Pessa et al. 2021).
For a given SR, we fit the data in logarithmic space as follows:
 (1)
(1)
where Σx and Σy can be ΣHI, ΣH2, Σtot gas, Σdust, Σstars, and Σbar in units of M⊙ pc−2 and ΣSFR in units of M⊙ yr−1 kpc−2, m is the slope and q the intercept of the linear fit. For each linear fit we also provide the Pearson correlation coefficient R, the standard deviation of residuals (dispersion) σ, and the number of datapoints taken into account.
5. The resolved scaling relations
In this section we present the results obtained from the study of the pixel-by-pixel SRs for our galaxy sample. We explore the following SRs: Σdust–ΣH2, Σdust–ΣHI, Σdust–Σtot gas (these three together hereafter called ISM SRs), Σstar–ΣH2, Σstar–Σdust, Σstar–Σtot gas, Σstar–ΣSFR, ΣH2–ΣSFR, Σtot gas–ΣSFR, Σbar–ΣSFR. When the molecular gas is involved, two prescriptions on XCO are explored.
5.1. Results for individual galaxies
Figure 1 shows the example of the SRs derived for NGC 6946 at the resolution of 1 kpc. For this galaxy, all components are, on average, moderately or strongly correlated10 within the optical disk, under both assumptions on XCO when the molecular gas is involved in a given SR. Only, the Σdust–ΣHI SR is a weak or moderate correlation.
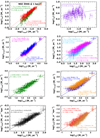 |
Fig. 1. Resolved SRs for the galaxy NGC 6946 within r25 at the resolution of 1 kpc, in logarithmic scale. From left to right: Σdust–ΣH2, Σdust–ΣHI, Σdust–Σtot gas, Σstar–ΣH2, Σstar–Σdust, Σstar–Σtot gas, Σstar–ΣSFR, ΣH2–ΣSFR, Σtot gas–ΣSFR, Σbar–ΣSFR. Two sets of data are shown when the H2 gas is involved according to the two assumptions on XCO (see the legends). The lines are the linear fits to the data: continuum line for the constant XCO (Bolatto et al. 2013), dashed line for the metallicity-dependent XCO (Amorín et al. 2016). Fit parameters are also given in the figures. |
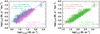 |
Fig. 1. continued. |
Figure A.1 displays the SRs for the entire sample and Table A.1 collects properties of the corresponding linear fits to the data. The analysis of the full sample shows that each galaxy is characterized by distinct, in terms of slope and R (and σ), SRs on scales between 0.3 and 3.4 kpc. Nevertheless, we identify some recurrent behaviors for each SR: for instance, the Σdust–ΣH2 SR has a superlinear slope for most galaxies. Details on galaxies deviating from recurrent trends are provided in Appendix B. All the explored SRs are moderate or strong correlations except the Σdust–ΣHI SR that does not exist or is a weak relationship for most galaxies.
The results found by assuming the metallicity-dependent XCO are similar, in terms of slopes and R, to those under the prescription of the constant XCO. However, there is evidence, for each galaxy, that the slopes and R values change a little bit as a function of the prescription on XCO. For example, the slopes and R values of the SRs with ΣH2 in the y−axis (e.g., Σdust–ΣH2) under the metallicity-dependent XCO prescription are lower than those under the constant one. In this type of SRs, the values of slopes typically get lower for steeper gas-phase metallicity gradients (e.g., NGC 628), for significantly lower mean metallicities than that of solar (e.g., NGC 925), or for the combination of the two conditions (e.g., NGC 5457).
We have tested two other prescriptions on XCO, one from Bolatto et al. (2013) and the other one from Madden et al. (2020). Since these tests do no give extremely different results from those obtained under the adopted prescriptions, we do not show them for the entire sample. Details on these tests are described in Appendix C.
Since we have also all maps convolved at the common scale of 3.4 kpc we are able to check the existence of possible dependencies of SRs as a function of scale (see Table A.1). The slopes turn out to be approximately independent on the physical scale, in the range of scales we explore. In particular, for a given galaxy the slope of a SR at the scale imposed by the dust map and that at 3.4 kpc are almost always consistent within a factor of (1 − 3) times the uncertainties. Overall, there is no evidence of a dependence of R of all SRs on the scale.
5.2. Results for the sample
Figure 2 shows the results obtained from the study of the pixel-by-pixel SRs for all sample galaxies evaluated together at 3.4 kpc. The parameters of these correlations are collected in Table A.1.
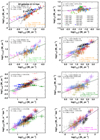 |
Fig. 2. Same as Fig. 1 for all sample galaxies evaluated together at the common scale of 3.4 kpc. Only data referring to the assumption of the constant XCO are shown, while the drawn lines refer to the fits under the two assumptions on XCO. Different symbols (and colors) represent different galaxies according to the legend shown in the panel displaying the Σdust–ΣHI SR. |
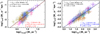 |
Fig. 2. continued. |
In general, all the explored SRs are strong correlations and the Σbar–ΣSFR SR is the strongest one. The most striking results concern the ISM SRs. The Σdust–ΣHI SR is a weak correlation also for all galaxies evaluated together at 3.4 kpc. These results differ from those found from the global study of DustPedia late-type galaxies (C20), where both dust–H I and dust–total gas are better correlated than dust–H2. In particular, comparing the ISM SRs studied for individual galaxies at subkiloparsec/kiloparsec (subkpc/kpc) scales (Sect. 5.1), those for all galaxies at 3.4 kpc (this section), and those at global scales (C20), it emerges that the Σdust–Σtot gas SR is a good correlation at all (from small to global) scales, and the strength of the Σdust–ΣH2 and Σdust–ΣHI SRs vary as a function of the sampled scale. The atomic gas is globally a very good tracer of dust within the optical disk of spiral galaxies, while H I is almost always unrelated with dust at scales between 0.3 and 3.4 kpc. The molecular gas is globally a good tracer of dust within the optical disk of spiral galaxies, but the Σdust–ΣH2 SR strengthens at subkpc/kpc scales. For the other SRs there is a good agreement, in terms of slopes and R, between small-scale SRs we explore and integrated SRs present in the literature (see Sect. 1 for some references), supporting a scenario where the main physical processes regulating the properties and evolution of galaxies may locally occur.
A short summary of the main results presented in this section is shown in Figs. 3 and 4. They refer to the dust-total gas and SFMS SRs as an example and the emerging considerations can be extended to all SRs. Figure 3 shows the nonuniversality of the resolved SRs of sample galaxies individually evaluated at the scale imposed by the dust map, from 0.3 to 3.4 kpc. Figure 4 displays that also when the slopes of a given SR are evaluated at the common scale of 3.4 kpc there is a variety of results but the slope of all galaxies at 3.4 kpc (gray star) is consistent with their median slope (light blue band). In this figure, transparent symbols represent the slopes at the scale imposed by the dust map and the comparison with the slopes at 3.4 kpc shows the approximate independence, for a given galaxy, of the slope of a SR on the physical scale (see Sect. 5.1). Table A.1 collects the median slopes of the SRs at 3.4 kpc.
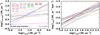 |
Fig. 3. Linear fits of the dust-total gas (left panel) and SFMS (right panel) SRs of sample galaxies individually evaluated at the physical scale imposed by the dust map resolution (36″), from 0.3 to 3.4 kpc (see Sect. 5.1). Each colored fit corresponds to a galaxy according to the legend shown in the left panel. The total gas refers to the assumption of the constant XCO (Bolatto et al. 2013). |
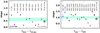 |
Fig. 4. Slopes of the dust-total gas (left panel) and SFMS (right panel) SRs of sample galaxies individually evaluated at 3.4 kpc (see Sect. 5.2). Each colored dot corresponds to a galaxy. The transparent symbols represent the corresponding slopes at the resolution imposed by the dust map (see Sect. 5.1). The light blue band is the median slope with error and the gray star the slope of all galaxies at 3.4 kpc (see Table A.1). The total gas refers to the assumption of the constant XCO (Bolatto et al. 2013). |
6. Resolved ratios in the local Universe
In this section we study some ratios focusing on ISM components: dust-to-stellar, dust-to-gas, and dust-to-metal ratios. We explore the behavior of these ratios as a function of various galaxy physical quantities typically used as tracers of the evolutionary stage (especially in global analyses). In particular, we study the ratios against 12 + log(O/H), Σstar, specific SFR (the SFR per unit stellar mass) surface density (ΣSSFR), and gas fraction (fgas = Σtot gas/(Σtot gas + Σstar)). We present the results taking into account all galaxies evaluated together at 3.4 kpc. Table 4 collects mean values of the ratios and Table 5 the properties of the fits to data.
Mean values of dust-to-stellar, dust-to-gas, and dust-to-metal ratios for the galaxy sample at 3.4 kpc.
6.1. Dust-to-stellar mass ratio
We explore the dust-to-stellar mass ratio, Σdust/Σstar, also called the specific dust mass. The mean value of Σdust/Σstar for our resolved sample is log(Σdust/Σstar) = − 3.12 ± 0.39, broadly consistent with the dust-to-stellar mass ratio of Herschel Reference Survey (HRS, Boselli et al. 2010) galaxies at stellar mass Mstar ≳ 109 M⊙ (De Vis et al. 2017a)11. Comparisons with the literature require to pay attention to derivation method of the involved quantities and this is particularly important for the dust mass whose values are strongly dependent on adopted SED fitting and dust model (see, e.g., Relaño et al. 2022). However, De Vis et al. (2019) found that dust masses used in De Vis et al. (2017a) derived with MAGPHYS (da Cunha et al. 2008) and the DustPedia ones (see Sect. 3) are very similar.
Dust is formed by condensation of metals in the atmospheres of evolved stars (seed grains formation in supernova (SN) ejecta and AGB stars) and can grow its mass in the dense ISM (where the accretion of metals on grains is balanced by SN shock-wave destruction). Because of this, relations are expected between the dust content, the stellar mass and SF activity, and the gas-phase metallicity. Figure 5 shows the trend of Σdust/Σstar as a function of Σstar (left panel) and ΣSSFR (right panel). As expected, there is a strong anticorrelation between Σdust/Σstar and Σstar, which is already known in the literature both at subkpc scales for, for example, M 31 (Viaene et al. 2014) and at global scales for samples of galaxies (e.g., Cortese 2012; Clemens et al. 2013; Clark et al. 2015; Calura et al. 2017; De Vis et al. 2017a; Orellana et al. 2017; C20; De Looze et al. 2020), and it has been reproduced by both chemical evolutionary models (e.g., Cortese 2012; Calura et al. 2017; De Vis et al. 2017a) and cosmological hydro simulations (e.g., Camps et al. 2016). The anticorrelation between Σdust/Σstar and Σstar indicates that galaxy regions with a lower stellar mass have higher dust-to-stellar mass ratios with respect to stellar mass than their more massive counterparts. In C20, where we have defined the global Mstar–Mdust/Mstar SR for 432 DustPedia late-type galaxies, we have proposed the following interpretation: although both stars and dust are products of SF, stellar mass grows with time as the galaxy evolves whereas the amount of dust can decrease as due to astration and destruction (see, e.g., Calura et al. 2008). This explanation can be also applied to individual galaxy regions. This trend could be seen as a local version of the downsizing of galaxies (e.g., Cowie et al. 1996; Fontanot et al. 2009), where massive galaxies have already consumed most of their gas converting it into stars and most of dust mass was produced during these SF episodes. The correlation between Σdust/Σstar and ΣSSFR is moderate: Σdust/Σstar increases with increasing ΣSSFR, according to global analyses (e.g., da Cunha et al. 2010; De Looze et al. 2020). This relation provides indications on the role of recent SF activity in the determination of dust content.
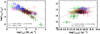 |
Fig. 5. Logarithm of dust-to-stellar mass ratio as a function of logarithm of stellar mass (left panel) and SSFR surface density (right panel). The continuum line is the linear fit to the data (see Table 5). Symbols are same as Fig. 2. |
Figure 6 shows Σdust/Σstar vs. 12 + log (O/H): we find a decrease by a factor of ∼3, from ≈0.001 at 12 + log(O/H) ∼8.3 to ≈0.0004 at 12 + log(O/H) ∼ 8.8. A similar trend is also found by Vílchez et al. (2019), although characterized by a decreasing by an order of magnitude. The anticorrelation of Σdust/Σstar with metallicity might simply reflect that with the stellar mass, since both quantities are well known to correlate: the dust mass is consumed in more evolved, high-metallicity and high-mass, galaxies.
6.2. Dust-to-total gas mass ratio
We study the dust-to-total gas mass ratio (DGR = Σdust/Σtot gas). The mean values of DGR for our resolved sample are log(DGR) = − 2.20 ± 0.04 and −2.23 ± 0.21 for constant and metallicity-dependent XCO, respectively. They are consistent within errors with the global values found for DustPedia late-type galaxies (C20) and other samples (e.g., KINGFISH, Aniano et al. 2020).
Figure 7 shows DGR as a function of Σstar (left panel) and ΣSSFR (right panel). DGR shows a strong correlation with Σstar, while it is not correlated (or is very weakly correlated) with ΣSSFR. Strong relations of the DGR with both stellar mass and SSFR are usually found for global values; they are generally interpreted by saying that less massive galaxies are vigorously forming stars, while most of their metals have not been locked up in dust grains (see, e.g., De Looze et al. 2020). In our study, where DGR is computed also using information on the molecular gas, we still find a strong correlation with the stellar mass. Instead, we do not see any correlation with the resolved SSFR. Thus, the anticorrelation between DGR and ΣSSFR is valid only if averaged over considerable areas (≳ kpc or global scales). This agrees with the recent resolved analysis performed by Abdurro’uf et al. (2022) finding no significant anticorrelation between dust and SSFR for ten nearby galaxies (some in common with our sample).
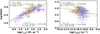 |
Fig. 7. Logarithm of dust-to-gas mass ratio as a function of logarithm of Σstar (left panel) and ΣSSFR (right panel). Data points refer to the assumption of the constant XCO, fit lines to both prescriptions on XCO (see legend). Symbols are same as Fig. 2. |
Figure 8 shows the trend of DGR vs. 12 + log (O/H) (left panel) and fgas (right panel). We find an increasing DGR with increasing metallicity. The DGR depends on metallicity as DGR ∝ (O/H)1.2 and DGR ∝ (O/H)1.3, assuming constant and metallicity-dependent XCO, respectively. Our results are consistent with several observational works finding that the DGR is well represented by a power law with a slope of about 1 or higher at high metallicity (12 + log (O/H) ≳ 8.3, e.g., James et al. 2002; Draine et al. 2007; Leroy et al. 2011; Galliano et al. 2008; Sandstrom et al. 2013; Giannetti et al. 2017), and with theoretical expectations including dust grain growth (e.g., Asano et al. 2013; Zhukovska 2014; Feldmann 2015; Aoyama et al. 2017; De Vis et al. 2017b; McKinnon et al. 2018). We stress that the single power law with superlinear slope provides the best description of the DGR-metallicity relation for the full DustPedia late-type galaxy sample, testing different metallicity calibrations (De Vis et al. 2019). A superlinear slope indicates that the stellar dust alone cannot explain the resulting DGR-metallicity relation. Some spatially resolved studies instead found a DGR-metallicity relation showing a two slopes behavior, with a break at a critical metallicity (e.g., Relaño et al. 2018; Vílchez et al. 2019), consistently with the results of Rémy-Ruyer et al. (2014) based on the global analysis of nearby galaxies covering a 2 dex metallicity range (from 12+log(O/H) = 7.1 to 9.1). Below this critical metallicity, the DGR-metallicity relation becomes steeper with respect to higher metallicities. The existence of a critical metallicity able to explain the change of slope in the DGR-metallicity relation has been theoretically predicted by Asano et al. (2013, see also Popping et al. 2017). It defines the two regimes dominated by stellar dust production and grain growth in the ISM, and its existence is invoked when stardust production equals grain grown. In this regard, very recently Galliano (2022) defined a critical metallicity regime that is in the range from 12 + log(O/H) ∼8 to ∼8.3 for nearby galaxies (see also Galliano et al. 2018). We recall that our sample has metallicity values ranging from 12 + log(O/H) = 8.3 to 8.8 (∼20% have metallicities lower than 8.4). DGR increases with decreasing fgas (right panel of Fig. 8) following a strong relation. This anticorrelation says that galaxy regions with lower fgas, which implies that they are more evolved and more quiescent having converted most of their gas reservoir into stars, tend to have higher DGR.
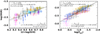 |
Fig. 8. Same as Fig. 7, but as a function of 12 + log (O/H) (left panel) and logarithm of fgas (right panel). |
We also explore DGR as a function of ΣH2/Σtot gas and ΣH2/ΣHI following Vílchez et al. (2019) and C20, respectively. Asano et al. (2013) predicted that the accretion time for grain growth is proportional to the inverse of the fraction of the cold component of the ISM, and ΣH2/Σtot gas is a proxy of this fraction. The left panel of Fig. 9 shows DGR vs. ΣH2/Σtot gas across sample galaxies (with constant XCO). The DGR tends to increase with increasing ΣH2/Σtot gas for ΣH2/Σtot gas≳ 0.1, while it vertically drops down for lower molecular gas fractions. This suggests a nondependence of low DGR (log(DGR) ≲ − 2.3) on the grain growth. It is consistent with the results of Vílchez et al. (2019) and supports the idea that the trend of DGR as a function of ΣH2/Σtot gas is associated to the grain growth that should occur when the DGR is sufficiently high (see also, e.g., Chiang et al. 2018). The right panel of Fig. 9 displays the trend of DGR as a function of ΣH2/ΣHI: in general, DGR tends to increase with increasing ΣH2/ΣHI. We also note a sort of plateau or the beginning of a decreasing of DGR at ΣH2/ΣHI ≈ 1. With our dataset, we are not able to draw this trend up to ΣH2/ΣHI ∼ 10 and higher, but the behavior of DGR at ΣH2/ΣHI ≈ 1 seems to be consistent with the hill-like shape published in C20. The increasing part of the trend shown in the right panel of Fig. 9 corresponds to galaxy regions where H I dominates and dust is yet in small quantities with respect to the total gas, and it is predicted from theoretical models (e.g., Krumholz et al. 2009; Magrini et al. 2012; Wong et al. 2013). An increasing ΣH2/ΣHI indeed implies that the atomic gas is transformed into molecular gas and then into stars, and these latter in turn produce an increase of the hydrostatic pressure in the disk, triggering the formation of dense molecular clouds. The central and right-hand parts of the plot are instead unexpected, and no simulations or theoretical models, to our knowledge, make predictions on them. In C20 we proposed some explanations for this decreasing trend invoking dust destroyed by events (e.g., shocks, collisional sputtering) and/or reduced due to differential consumption of dust and gas, different emission efficiency of dust grains producing an underestimation of dust mass, or the use of the same XCO for different H2-dominated regions of different galaxies.
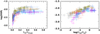 |
Fig. 9. Same as Fig. 7, but as a function of ΣH2/Σtot gas (left panel) and logarithm of ΣH2/ΣHI (right panel). In the left panel, the drawn black line is the fit to the data and it only helps to follow the trend (the corresponding equation is not provided). |
6.3. Dust-to-metal ratio
We explore the ratio between the dust mass and the total amount of metals, the dust-to-metal ratio (DTM). Following De Vis et al. (2019), the DTM is defined as DTM = Σdust/ΣZ(gas + dust), where ΣZ(gas + dust) = fZ × Σgas + Σdust with fZ fraction of metals by mass calculated using fZ = 27.36 × 10(12 + log(O/H)−12). The DTM is a measure of the fraction of metals locked up in the interstellar dust grains, and its behavior provides information on the efficiency of dust production and destruction mechanisms. By simplifying the general theoretical framework (e.g., Asano et al. 2013), the DTM is expected to remain constant if the dust is mainly produced by stellar sources, to increase as galaxies evolve enriching the ISM with metals, or to decrease if the dust is destroyed via SN shocks. The mean values of DTM ratios for our resolved sample are log(DTM) = − 0.43 ± 0.10 and −0.46 ± 0.10 for constant and metallicity-dependent XCO, respectively. These values are consistent within errors with the high end of DTM ratios of nearby galaxies12 corresponding, for instance, to non-H I-deficient galaxies of the HRS sample (see De Vis et al. 2017a, for the definition of non-H I-deficient galaxies).
Figures 10 and 11 show DTM against Σstar, ΣSSFR, 12 + log (O/H), and fgas. The trends as a function of Σstar, ΣSSFR, and fgas are broadly similar to those found for DGR but with flatter slopes and lower correlation coefficients (see Table 5). This suggests that DGR and DTM are quite interchangeable quantities with respect to Σstar, ΣSSFR, and fgas, and we can reasonable assume that the underlying physics is approximatively the same (see Sect. 6.2). DTM against 12 + log (O/H) (left panel of Fig. 11) instead reveals no clear trend, with DTM remaining approximately constant across the metallicity range. This might indicate that the critical metallicity threshold above which grain growth becomes efficient in the dust production is not important in the explored range of metallicity (see Sect. 6.2). The absence of a clear trend of DTM vs. 12 + log (O/H) also characterizes global analyses of galaxy samples with or without few low-metallicity systems (e.g., De Vis et al. 2019; De Looze et al. 2020).
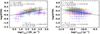 |
Fig. 10. Logarithm of dust-to-metal ratio as a function of logarithm of Σstar (left panel) and of ΣSSFR (right panel). Data points refer to constant XCO, fit lines to both assumptions on XCO (see legend in Fig. 7 and Table 5). Symbols are same as Fig. 2. |
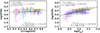 |
Fig. 11. Same as Fig. 10, but as a function of 12 + log (O/H) (left panel) and logarithmic of fgas (right panel). |
7. Discussion
7.1. The nonuniversality of resolved scaling relations
All the studied SRs show moderate or strong correlations except the Σdust–ΣHI SR that does not exist for most galaxies. Since mass radial profiles of many quantities (e.g., dust, stars, gas) in spiral galaxies have been drawn and generally characterized with an exponential decline of their surface density with radius (e.g., Alton et al. 1998; Xilouris et al. 1999; Bianchi 2007; Leroy et al. 2008, 2009; Muñoz-Mateos et al. 2009; Schruba et al. 2011; De Geyter et al. 2014; Hunt et al. 2015; Smith et al. 2016; C17), a positive correlation between these properties is expected within individual galaxies. We find that each galaxy is characterized by distinct SRs on the explored scales. The studied SRs are therefore, on average, strong correlations though not universal. These variations found for individual galaxies, not being driven by the sampled scale, seem to be affected by local processes and galaxy peculiarities (e.g., an overabundance of H I). The nonuniversality of the SRs at subkpc/kpc scales has been already found by other authors referred to a restricted set of SRs, the SF relations (e.g., Vulcani et al. 2019; Ellison et al. 2021; Thorp et al. 2022). We extend the nonuniversality to other SRs involving dust, H I, and total baryonic content.
Leroy et al. (2013) cautioned that the KS relation tends to show a uniform behavior when the studied sample is dominated by star-forming disk galaxies. However, our sample shows a wide range of behaviors in terms of SRs although it consists of galaxies belonging to the same subclass of objects (that is, large, face-on, spiral galaxies) and all the derived quantities have been treated with the same methodology. The nonuniversal KS relation we find is consistent with a KS relation varying significantly from cloud to cloud in the Milky Way found by some authors (e.g., Gutermuth et al. 2011; Lada et al. 2013; Willis et al. 2015; Pokhrel et al. 2020, 2021). However, Pokhrel et al. (2021) found a tight, linear correlation between Σgas and ΣSFR normalized by the gas free-fall time (tff) for 12 Galactic nearby (< 1.5 kpc) molecular clouds. This relation is the same in all studied molecular clouds spanning a huge range of properties (e.g., clouds without massive stars or massive stellar feedback, clouds being sites of ongoing massive SF, large complexes comparable to those observed in nearby galaxies). Most theoretical models predicting the existence of a KS relation for single clouds also predict a dependence on the gas tff (e.g., Krumholz & McKee 2005; Federrath & Klessen 2012; Padoan et al. 2012; Krumholz et al. 2019), which in turn depends on the volume density. The finding of a universal intercloud KS relation, which link SFR to the volume density, supports models in which SF is regulated by local processes (e.g., turbulence, stellar feedback, protostellar outflows), while disfavors models in which SF is driven only by galaxy properties or phenomena on galactic scales (e.g., SN feedback). The dependence on local processes is in line with our results showing different SRs (not only the KS one) found for individual galaxies at subkpc/kpc scales.
All SRs involving only H2 gas mass are potentially affected by the assumptions on XCO. On the contrary, SRs involving total (H2 + H I) gas are, on average, less dependent on these assumptions, suggesting that adding H I tends to cancel out or mitigate the variations observed in the SRs as a function of XCO.
It is well known that the H2 gas typically dominates in the central regions of the optical disk of galaxies while H I outside of it, extending, on average, far away beyond r25, by a factor between 2 and 4 (rHI = 2 − 4r25, e.g., Wong & Blitz 2002; Bigiel et al. 2008; C17). This is the most frequently observed trend in galaxies and can explain the very weak or absent correlation between dust (present within the disk of galaxies) and H I gas at subkpc/kpc scales. However, we have to mention that a variety of ISM morphologies has been found (Dib et al. 2021), including a central gaseous hole, both in CO and H I, as, for instance, in the Milky Way (Misiriotis et al. 2006) and NGC 3031 (Casasola et al. 2007, present in our sample). The idea that recently emerged is that the role of H I in regulating SF may have been down-played so far (see, e.g., the discussion in Ellison et al. 2021). Bacchini et al. (2019a,b) defined a tight correlation between volume densities of H I and SFR in disk galaxies, including the Milky Way, and both Saintonge et al. (2016) and Morselli et al. (2020) found that the MS can be explained by their cold gas reservoir as observed in the H I line, both globally and with spatially resolved measurements. More recently, Morselli et al. (2021) estimated the redshift evolution of the H2/H I mass ratio within galaxies finding that H I should not be neglected at high redshift, as commonly done, but rather we should reevaluate its role (see also Roychowdhury et al. 2015).
7.2. The resolved vs. global scaling relations
The SRs studied in this paper hold starting from the scale of 0.3 kpc, with some exceptions (see Appendix B). If a breaking down scale for these SRs exists, it is below 0.3 kpc. When all galaxies are evaluated together at the common scale of 3.4 kpc, differences due to peculiarities of individual galaxies, such as an abundant H I content (e.g., NGC 7793) and/or an anomalous dust mass/distribution (e.g., NGC 300), are cancelled out. The resulting SRs are consistent with those typically characterizing whole galaxies. The scale of 3.4 kpc therefore provides a view of the behavior of SRs at global scales.
The good match between subgalactic and global SRs should be in line with a scenario where main physical processes regulating the properties and evolution of galaxies occur at subkpc/kpc scales and drive the behavior of galaxies as a whole. In particular, the agreement between the SF relationships studied at different scales has been recently discussed in the hypothesis of self-regulation of the SF process (e.g., Zaragoza-Cardiel et al. 2019, 2020; Barrera-Ballesteros et al. 2021; Sánchez et al. 2021). This scenario could be applied to all SRs we explore. The hypothesis of self-regulation of the SF process assumes that since stars impact their environment, the rate at which gas can collapse to make new stars is also affected by the previous generation of SF. The molecular clouds, once collapsed, follow, both individually and locally, the KS relation. The different slopes of this relation present in the literature would be explained by the fact that this relationship is “smoothed” at subkpc/kpc scales including different galaxy regions, that is those actively forming stars, those not forming stars, and those with stars formed by the previous generations of clouds. Timescales also play a role in the scenario of self-regulation of the SF process. Many works found that the KS relation holds when it is averaged on timescales of ∼30–100 Myr (e.g., Silk 1997; Ostriker et al. 2010; Kruijssen et al. 2019), much larger than those of the SF process (for instance, a typical mean density within GMCs of nH = 100 cm−3 implies a typical tff ∼ 2 − 4 × 10⁶ yr, see, e.g., Li et al. 2019). Kruijssen et al. (2019) inferred that the decorrelation between the molecular gas and high-mass SF on the spatial scale of GMCs in NGC 300 implies rapid evolutionary cycling between clouds, SF, and feedback. They demonstrated that SF is regulated by efficient stellar feedback arising from radiation and stellar winds, before SN explosions can occur.
If small-scale processes drive the SF and a large set of SRs at different scales, this does not mean that also global processes and global galaxy properties do not play a role (see, e.g., Abdurro’uf et al. 2022). Galaxies with strong bars, interactions between galaxies and with the environment, mergers, gas inflows/outflows, and/or the presence of an AGN can affect the gas fraction and therefore the SF of the entire galaxy (e.g., Casasola et al. 2004; Poggianti et al. 2017; Sánchez et al. 2018; Sánchez 2020; Mancillas et al. 2019). However, as pointed out by Sánchez et al. (2021), they influence the whole galaxy in an indirect way, via the physical processes that affect the SF.
7.3. Ratios and their evolution
The mean values and evolution of specific dust mass, DGR, and DTM for nearby galaxies at subgalactic scales are consistent with those derived for whole galaxies. In particular, their evolution is in agreement with what is globally observed both for nearby and high-redshift galaxies (e.g., Rémy-Ruyer et al. 2014; Calura et al. 2017; C20; Popping & Péroux 2022). Popping & Péroux (2022) especially found little to no evolution in the observed trends between DGR and DTM and gas-phase metallicity from z = 0 to 5. They concluded that this is indicative of a balance between the formation and destruction of dust already at z = 5, when the Universe was 1.2-Gyr old. These observational results are consistent with the predictions of the model of Li et al. (2019) finding a little evolution in the DGR-metallicity relationship in the redshift range z = 0 − 6.
At subgalactic scales the specific dust mass is primarily correlated with Σstar, while DGR and DTM are better correlated with fgas though correlations with 12 + log(O/H) and Σstar are nonnegligible and very weak or absent correlations are found for DGR and DTM with ΣSSFR. Global analyses of galaxies at different redshifts show instead that DGR and DTM depend most sensitively on the gas-phase metallicity, and there are important secondary relationships between these ratios and Σstar and fgas and moderate correlations with ΣSSFR (e.g., Rémy-Ruyer et al. 2014; Li et al. 2019). The explored ratios, all involving the dust content, therefore would seem to be set and governed by subgalactic evolutionary processes that then would drive the galaxy evolution as a whole.
8. Conclusions
From the analysis of an unprecedented set of ten pixel-by-pixel SRs between dust, H2, H I, total gas, stars, total baryonic content, SFR, and some ratios of these quantities for 18 dust-resolved DustPedia galaxies at scales between 0.3 and 3.4 kpc, studied within the optical disk and exploring both constant and metallicity-dependent XCO, we draw the following conclusions.
-
All the explored SRs are moderate or strong correlations except the Σdust–ΣHI SR that is negligible or very weak for most galaxies. We do not define universal SRs at scales below 3.4 kpc, in the range 0.3–3.4 kpc, because each galaxy is characterized by distinct SRs, affected by local processes and galaxy peculiarities. For a given galaxy, the slopes and correlation coefficients of the SRs are approximately independent on scale, in the range 0.3–3.4 kpc. The SRs hold, on average, starting from 0.3 kpc, and, if a breaking down scale exists, it is below 0.3 kpc.
-
By studying all galaxies together at the scale of 3.4 kpc, differences due to peculiarities of individual galaxies are cancelled out and the corresponding SRs are compatible with those of whole galaxies. The consistency between subgalactic and global SRs may be compatible with a picture where the main physical processes regulating the properties and evolution of galaxies locally occur. In this perspective, our results are in line with the scenario of self-regulation of the SF.
-
The most striking result emerges from the ISM SRs. The Σdust–Σtot gas SR is a good correlation at all scales, while the Σdust–ΣH2 and Σdust–ΣHI SRs have different behaviors based on scale. The atomic gas is globally a very good tracer of dust within the disk of spiral galaxies, while it is almost always not correlated with dust at subkpc/kpc scales. The H2 gas is globally a good tracer of dust within the disk of spiral galaxies, and the dust–H2 correlation improves further at subkpc/kpc scales.
-
All SRs involving only H2 mass are potentially affected by the assumption on XCO, however the results found under different assumptions are similar, in terms of slopes and strength. SRs involving total (H2 + H I) gas are less dependent on the prescription on XCO.
-
The mean values and the evolution of specific dust mass, DGR, and DTM for nearby galaxies at subgalactic scales are consistent with those derived for whole galaxies from z = 0 to 5, suggesting that also these ratios are mainly set by local processes. We find that DGR depends on metallicity as DGR ∝ (O/H)1.2 − 1.3 and this is consistent with theoretical expectations including dust grain growth. DGR against ΣH2/Σtot gas shows that low DGR values do not depend on the grain growth, and DTM against 12 + log (O/H) that the critical metallicity threshold above which grain growth becomes efficient in the dust production is not crucial in the explored range of metallicity.
Our results underline the importance of focusing on resolved local galaxies in the general picture of galaxy evolution. In this respect, the DustPedia collaboration is planning a set of studies at finer resolution (e.g., Casasola et al., in prep.; Salvestrini et al., in prep.). The newly rediscovered important of H I in the SF process is particularly pertinent with current and incoming facilities devoted also to trace H I emission in galaxies, such as the operative MeerKAT and the future ngVLA and SKA. In one of these incoming papers, we will present the H I properties in nearby galaxies with new high-resolution and high-sensitivity MeerKAT observations. These works provide both new observational constraints for theoretical models on structure, formation, and evolution of galaxies and an updated local benchmark for high-redshift studies.
D25 is the major axis isophote at which the optical surface brightness falls beneath 25 mag arcsec−2 (we also use r25 = D25/2).
The Heterogeneous Evolution Model for Interstellar Solids, http://www.ias.u-psud.fr/themis/index.html
Common Astronomy Software Applications, McMullin et al. (2007).
IRAF is the Image Reduction and Analysis Facility. IRAF is written and supported by the National Optical Astronomy Observatories (NOAO) in Tucson, Arizona. NOAO is operated by the Association of Universities for Research in Astronomy (AURA), Inc. under cooperative agreement with the National Science Foundation.
Typically, if 0 < |R|< 0.3 the correlation is defined weak, if 0.3 < |R|< 0.7 the correlation is defined moderate, if |R|> 0.7 the correlation is defined strong.
Our range of Σdust/Σstar values is consistent with that of De Vis et al. (2017a).
For nearby galaxies typically −0.90 ≲ log(DTM) ≲ −0.40 (e.g., De Looze et al. 2020).
Acknowledgments
This paper is dedicated to the memory of Jonathan Ivor Davies, mentor and leader of the DustPedia collaboration. The presented results have been obtained during the COVID-19 pandemic and this work is also dedicated to all the people who during these hard times continued working in hospitals, pharmacies, grocery stores, transports, and other essential services, allowing us to continue our research work in astronomy. We are grateful to the anonymous referee for the rapidity and pertinence of his/her comments and suggestions improved the quality of this manuscript. DustPedia is a collaborative focused research project supported by the European Union under the Seventh Framework Programme (2007–2013) call (proposal no. 606824). The participating institutions are: Cardiff University, UK; National Observatory of Athens, Greece; Ghent University, Belgium; Université Paris-Sud, France; National Institute for Astrophysics, Italy and CEA (Paris), France. We acknowledge funding from the INAF main stream 2018 program “Gas-DustPedia: A definitive view of the ISM in the Local Universe”. VC, SB, and EC acknowledge the support from grant PRIN MIUR 2017 – 20173ML3WW_s. JF acknowledges financial support from the UNAM-DGAPA-PAPIIT IN111620 grant, México. This paper makes use of the following ALMA data: ADS/JAO.ALMA#2017.1.00886.L and ADS/JAO.ALMA#2017.1.00129.S. ALMA is a partnership of ESO (representing its member states), NSF (USA) and NINS (Japan), together with NRC (Canada), MOST and ASIAA (Taiwan), and KASI (Republic of Korea), in cooperation with the Republic of Chile. The Joint ALMA Observatory is operated by ESO, AUI/NRAO and NAOJ. In addition, publications from NA authors must include the standard NRAO acknowledgement: The National Radio Astronomy Observatory is a facility of the National Science Foundation operated under cooperative agreement by Associated Universities, Inc. This work made use of HERACLES, “The HERA CO-Line Extragalactic Survey” (Leroy et al. 2009). This work made use of THINGS, “The HI Nearby Galaxy Survey” (Walter et al. 2008). This publication made use of data from COMING, CO Multi-line Imaging of Nearby Galaxies, a legacy project of the Nobeyama 45 m radio telescope.
References
- Abdurro’uf, Lin, Y. T., Hirashita, H., et al. 2022, ApJ, 935, 98 [CrossRef] [Google Scholar]
- Alton, P. B., Trewhella, M., Davies, J. I., et al. 1998, A&A, 335, 807 [NASA ADS] [Google Scholar]
- Amorín, R., Muñoz-Tuñón, C., Aguerri, J. A. L., & Planesas, P. 2016, A&A, 588, A23 [NASA ADS] [CrossRef] [EDP Sciences] [Google Scholar]
- Aniano, G., Draine, B. T., Hunt, L. K., et al. 2020, ApJ, 889, 150 [NASA ADS] [CrossRef] [Google Scholar]
- Aoyama, S., Hou, K.-C., Shimizu, I., et al. 2017, MNRAS, 466, 105 [NASA ADS] [CrossRef] [Google Scholar]
- Asano, R. S., Takeuchi, T. T., Hirashita, H., et al. 2013, Earth Planets Space, 65, 213 [NASA ADS] [CrossRef] [Google Scholar]
- Asplund, M., Grevesse, N., Sauval, A. J., & Scott, P. 2009, ARA&A, 47, 481 [NASA ADS] [CrossRef] [Google Scholar]
- Bacchini, C., Fraternali, F., Iorio, G., et al. 2019a, A&A, 622, A64 [NASA ADS] [CrossRef] [EDP Sciences] [Google Scholar]
- Bacchini, C., Fraternali, F., Pezzulli, G., et al. 2019b, A&A, 632, A127 [NASA ADS] [CrossRef] [EDP Sciences] [Google Scholar]
- Baker, W. M., Maiolino, R., Bluck, A. F. L., et al. 2022, MNRAS, 510, 3622 [NASA ADS] [CrossRef] [Google Scholar]
- Barrera-Ballesteros, J. K., Heckman, T. M., Zhu, G. B., et al. 2016, MNRAS, 463, 2513 [NASA ADS] [CrossRef] [Google Scholar]
- Barrera-Ballesteros, J. K., Heckman, T., Sánchez, S. F., et al. 2021, ApJ, 909, 131 [NASA ADS] [CrossRef] [Google Scholar]
- Belfiore, F., Maiolino, R., Tremonti, C., et al. 2017, MNRAS, 469, 151 [Google Scholar]
- Berg, D. A., Skillman, E. D., Croxall, K. V., et al. 2015, ApJ, 806, 16 [NASA ADS] [CrossRef] [Google Scholar]
- Bettoni, D., Galletta, G., & García-Burillo, S. 2003, A&A, 405, 5 [NASA ADS] [CrossRef] [EDP Sciences] [Google Scholar]
- Bianchi, S. 2007, A&A, 471, 765 [NASA ADS] [CrossRef] [EDP Sciences] [Google Scholar]
- Bianchi, S., De Vis, P., Viaene, S., et al. 2018, A&A, 620, A112 [NASA ADS] [CrossRef] [EDP Sciences] [Google Scholar]
- Bigiel, F., Leroy, A., Walter, F., et al. 2008, AJ, 136, 2846 [NASA ADS] [CrossRef] [Google Scholar]
- Bolatto, A. D., Wolfire, M., & Leroy, A. K. 2013, ARA&A, 51, 207 [CrossRef] [Google Scholar]
- Boquien, M., Burgarella, D., Roehlly, Y., et al. 2019, A&A, 622, A103 [NASA ADS] [CrossRef] [EDP Sciences] [Google Scholar]
- Boselli, A., Eales, S., Cortese, L., et al. 2010, PASP, 122, 261 [Google Scholar]
- Boselli, A., Boissier, S., Heinis, S., et al. 2011, A&A, 528, A107 [NASA ADS] [CrossRef] [EDP Sciences] [Google Scholar]
- Boselli, A., Cortese, L., & Boquien, M. 2014, A&A, 564, A65 [NASA ADS] [CrossRef] [EDP Sciences] [Google Scholar]
- Boselli, A., Fossati, M., Ferrarese, L., et al. 2018, A&A, 614, A56 [NASA ADS] [CrossRef] [EDP Sciences] [Google Scholar]
- Bresolin, F., Garnett, D. R., & Kennicutt, R. C. 2004, ApJ, 615, 228 [NASA ADS] [CrossRef] [Google Scholar]
- Brinchmann, J., Charlot, S., White, S. D. M., et al. 2004, MNRAS, 351, 1151 [Google Scholar]
- Brouillet, N., Baudry, A., Combes, F., et al. 1991, A&A, 242, 35 [NASA ADS] [Google Scholar]
- Calura, F., Pipino, A., & Matteucci, F. 2008, A&A, 479, 669 [NASA ADS] [CrossRef] [EDP Sciences] [Google Scholar]
- Calura, F., Pozzi, F., Cresci, G., et al. 2017, MNRAS, 465, 54 [Google Scholar]
- Calzetti, D., Kennicutt, R. C., Engelbracht, C. W., et al. 2007, ApJ, 666, 870 [Google Scholar]
- Camps, P., Trayford, J. W., Baes, M., et al. 2016, MNRAS, 462, 1057 [CrossRef] [Google Scholar]
- Cano-Díaz, M., Sánchez, S. F., Zibetti, S., et al. 2016, ApJ, 821, L26 [Google Scholar]
- Cano-Díaz, M., Ávila-Reese, V., Sánchez, S. F., et al. 2019, MNRAS, 488, 3929 [Google Scholar]
- Casasola, V., Bettoni, D., & Galletta, G. 2004, A&A, 422, 941 [NASA ADS] [CrossRef] [EDP Sciences] [Google Scholar]
- Casasola, V., Combes, F., Bettoni, D., & Galletta, G. 2007, A&A, 473, 771 [NASA ADS] [CrossRef] [EDP Sciences] [Google Scholar]
- Casasola, V., Hunt, L., Combes, F., & García-Burillo, S. 2015, A&A, 577, A135 [NASA ADS] [CrossRef] [EDP Sciences] [Google Scholar]
- Casasola, V., Cassarà, L. P., Bianchi, S., et al. 2017, A&A, 605, A18 [NASA ADS] [CrossRef] [EDP Sciences] [Google Scholar]
- Casasola, V., Bianchi, S., De Vis, P., et al. 2020, A&A, 633, A100 [NASA ADS] [CrossRef] [EDP Sciences] [Google Scholar]
- Catinella, B., Saintonge, A., Janowiecki, S., et al. 2018, MNRAS, 476, 875 [NASA ADS] [CrossRef] [Google Scholar]
- Chiang, I.-D., Sandstrom, K. M., Chastenet, J., et al. 2018, ApJ, 865, 117 [NASA ADS] [CrossRef] [Google Scholar]
- Clark, C. J. R., Dunne, L., Gomez, H. L., et al. 2015, MNRAS, 452, 397 [NASA ADS] [CrossRef] [Google Scholar]
- Clark, C. J. R., De Vis, P., Baes, M., et al. 2019, MNRAS, 489, 5256 [NASA ADS] [CrossRef] [Google Scholar]
- Clemens, M. S., Negrello, M., De Zotti, G., et al. 2013, MNRAS, 433, 695 [NASA ADS] [CrossRef] [Google Scholar]
- Combes, F., Encrenaz, P. J., Lucas, R., et al. 1977, A&A, 55, 311 [NASA ADS] [Google Scholar]
- Combes, F., Prugniel, P., Rampazzo, R., & Sulentic, J. W. 1994, A&A, 281, 725 [NASA ADS] [Google Scholar]
- Corbelli, E., Bianchi, S., Cortese, L., et al. 2012, A&A, 542, A32 [NASA ADS] [CrossRef] [EDP Sciences] [Google Scholar]
- Cortese, L. 2012, A&A, 543, A132 [NASA ADS] [CrossRef] [EDP Sciences] [Google Scholar]
- Cortese, L., Bekki, K., Boselli, A., et al. 2016, MNRAS, 459, 3574 [Google Scholar]
- Cowie, L. L., Songaila, A., Hu, E. M., et al. 1996, AJ, 112, 839 [NASA ADS] [CrossRef] [Google Scholar]
- Croxall, K. V., Pogge, R. W., Berg, D. A., et al. 2015, ApJ, 808, 42 [NASA ADS] [CrossRef] [Google Scholar]
- Croxall, K. V., Pogge, R. W., Berg, D. A., et al. 2016, ApJ, 830, 4 [NASA ADS] [CrossRef] [Google Scholar]
- da Cunha, E., Charlot, S., & Elbaz, D. 2008, MNRAS, 388, 1595 [Google Scholar]
- da Cunha, E., Eminian, C., Charlot, S., et al. 2010, MNRAS, 403, 1894 [NASA ADS] [CrossRef] [Google Scholar]
- Daddi, E., Dickinson, M., Morrison, G., et al. 2007, ApJ, 670, 156 [NASA ADS] [CrossRef] [Google Scholar]
- Davé, R., Oppenheimer, B. D., & Finlator, K. 2011, MNRAS, 415, 11 [Google Scholar]
- Davies, J. I., Baes, M., Bianchi, S., et al. 2017, PASP, 129, 044102 [NASA ADS] [CrossRef] [Google Scholar]
- De Geyter, G., Baes, M., Camps, P., et al. 2014, MNRAS, 441, 869 [CrossRef] [Google Scholar]
- De Looze, I., Lamperti, I., Saintonge, A., et al. 2020, MNRAS, 496, 3668 [NASA ADS] [CrossRef] [Google Scholar]
- den Brok, J. S., Chatzigiannakis, D., Bigiel, F., et al. 2021, MNRAS, 504, 3221 [NASA ADS] [CrossRef] [Google Scholar]
- De Vis, P., Dunne, L., Maddox, S., et al. 2017a, MNRAS, 464, 4680 [NASA ADS] [CrossRef] [Google Scholar]
- De Vis, P., Gomez, H. L., Schofield, S. P., et al. 2017b, MNRAS, 471, 1743 [Google Scholar]
- De Vis, P., Jones, A., Viaene, S., et al. 2019, A&A, 623, A5 [NASA ADS] [CrossRef] [EDP Sciences] [Google Scholar]
- de Vaucouleurs, G., & Freeman, K. C. 1972, Vistas Astron., 14, 163 [Google Scholar]
- Dib, S., Braine, J., Gopinathan, M., et al. 2021, A&A, 655, A101 [NASA ADS] [CrossRef] [EDP Sciences] [Google Scholar]
- Djorgovski, S., & Davis, M. 1987, ApJ, 313, 59 [Google Scholar]
- Draine, B. T., Dale, D. A., Bendo, G., et al. 2007, ApJ, 663, 866 [NASA ADS] [CrossRef] [Google Scholar]
- Dunne, L., Maddox, S. J., Papadopoulos, P. P., et al. 2022, MNRAS, 517, 962 [NASA ADS] [CrossRef] [Google Scholar]
- Elbaz, D., Daddi, E., Le Borgne, D., et al. 2007, A&A, 468, 33 [NASA ADS] [CrossRef] [EDP Sciences] [Google Scholar]
- Ellison, S. L., Lin, L., Thorp, M. D., et al. 2021, MNRAS, 501, 4777 [NASA ADS] [CrossRef] [Google Scholar]
- Elmegreen, B. G., Wilcots, E., & Pisano, D. J. 1998, ApJ, 494, L37 [NASA ADS] [CrossRef] [Google Scholar]
- Enia, A., Rodighiero, G., Morselli, L., et al. 2020, MNRAS, 493, 4107 [NASA ADS] [CrossRef] [Google Scholar]
- Erb, D. K., Shapley, A. E., Pettini, M., et al. 2006, ApJ, 644, 813 [NASA ADS] [CrossRef] [Google Scholar]
- Federrath, C., & Klessen, R. S. 2012, ApJ, 761, 156 [Google Scholar]
- Feldmann, R. 2015, MNRAS, 449, 3274 [NASA ADS] [CrossRef] [Google Scholar]
- Ferland, G. J., Chatzikos, M., Guzmán, F., et al. 2017, Rev. Mex. Astron. Astrofis., 53, 385 [NASA ADS] [Google Scholar]
- Fontanot, F., De Lucia, G., Monaco, P., et al. 2009, MNRAS, 397, 1776 [NASA ADS] [CrossRef] [Google Scholar]
- Galliano, F. 2022, Habilitation Thesis, Université Paris-Saclay, France [Google Scholar]
- Galliano, F., Dwek, E., & Chanial, P. 2008, ApJ, 672, 214 [NASA ADS] [CrossRef] [Google Scholar]
- Galliano, F., Galametz, M., & Jones, A. P. 2018, ARA&A, 56, 673 [Google Scholar]
- Garnett, D. R., & Shields, G. A. 1987, ApJ, 317, 82 [NASA ADS] [CrossRef] [Google Scholar]
- Genzel, R., Tacconi, L. J., Combes, F., et al. 2012, ApJ, 746, 69 [Google Scholar]
- Giannetti, A., Leurini, S., König, C., et al. 2017, A&A, 606, L12 [NASA ADS] [CrossRef] [EDP Sciences] [Google Scholar]
- Ginolfi, M., Hunt, L. K., Tortora, C., et al. 2020, A&A, 638, A4 [NASA ADS] [CrossRef] [EDP Sciences] [Google Scholar]
- Gould, R. J., & Salpeter, E. E. 1963, ApJ, 138, 393 [NASA ADS] [CrossRef] [Google Scholar]
- Guilloteau, S., & Lucas, R. 2000, Imaging at Radio through Submillimeter Wavelengths, 217, 299 [NASA ADS] [Google Scholar]
- Gutermuth, R. A., Pipher, J. L., Megeath, S. T., et al. 2011, ApJ, 739, 84 [Google Scholar]
- Helfer, T. T., Thornley, M. D., Regan, M. W., et al. 2003, ApJS, 145, 259 [NASA ADS] [CrossRef] [Google Scholar]
- Hsieh, B. C., Lin, L., Lin, J. H., et al. 2017, ApJ, 851, L24 [Google Scholar]
- Huang, M.-L., & Kauffmann, G. 2015, MNRAS, 450, 1375 [NASA ADS] [CrossRef] [Google Scholar]
- Hunt, L. K., Draine, B. T., Bianchi, S., et al. 2015, A&A, 576, A33 [NASA ADS] [CrossRef] [EDP Sciences] [Google Scholar]
- Hunt, L. K., Tortora, C., Ginolfi, M., et al. 2020, A&A, 643, A180 [NASA ADS] [CrossRef] [EDP Sciences] [Google Scholar]
- James, A., Dunne, L., Eales, S., & Edmunds, M. G. 2002, MNRAS, 335, 753 [CrossRef] [Google Scholar]
- Jones, A. P., Fanciullo, L., Köhler, M., et al. 2013, A&A, 558, A62 [NASA ADS] [CrossRef] [EDP Sciences] [Google Scholar]
- Jones, A. P., Köhler, M., Ysard, N., et al. 2017, A&A, 602, A46 [NASA ADS] [CrossRef] [EDP Sciences] [Google Scholar]
- Jorgensen, I., Franx, M., & Kjaergaard, P. 1996, MNRAS, 280, 167 [Google Scholar]
- Kennicutt, R. C., Jr 1998a, ARA&A, 36, 189 [NASA ADS] [CrossRef] [Google Scholar]
- Kennicutt, R. C., Jr 1998b, ApJ, 498, 541 [Google Scholar]
- Krumholz, M. R., & McKee, C. F. 2005, ApJ, 630, 250 [Google Scholar]
- Krumholz, M. R., McKee, C. F., & Bland-Hawthorn, J. 2019, ARA&A, 57, 227 [NASA ADS] [CrossRef] [Google Scholar]
- Kruijssen, J. M. D., Schruba, A., Chevance, M., et al. 2019, Nature, 569, 519 [NASA ADS] [CrossRef] [Google Scholar]
- Knapen, J. H., Allen, R. J., Heaton, H. I., et al. 2006, A&A, 455, 897 [NASA ADS] [CrossRef] [EDP Sciences] [Google Scholar]
- Kobulnicky, H. A., & Kewley, L. J. 2004, ApJ, 617, 240 [CrossRef] [Google Scholar]
- Köhler, M., Jones, A., & Ysard, N. 2014, A&A, 565, L9 [NASA ADS] [CrossRef] [EDP Sciences] [Google Scholar]
- Kreckel, K., Ho, I.-T., Blanc, G. A., et al. 2019, ApJ, 887, 80 [NASA ADS] [CrossRef] [Google Scholar]
- Kruk, S. J., Lintott, C. J., Simmons, B. D., et al. 2017, MNRAS, 469, 3363 [NASA ADS] [CrossRef] [Google Scholar]
- Krumholz, M. R., McKee, C. F., & Tumlinson, J. 2009, ApJ, 693, 216 [NASA ADS] [CrossRef] [Google Scholar]
- Kuno, N., Sato, N., Nakanishi, H., et al. 2007, PASJ, 59, 117 [NASA ADS] [Google Scholar]
- Lada, C. J., Lombardi, M., Roman-Zuniga, C., et al. 2013, ApJ, 778, 133 [NASA ADS] [CrossRef] [Google Scholar]
- Lamperti, I., Saintonge, A., De Looze, I., et al. 2019, MNRAS, 489, 4389 [Google Scholar]
- Landsman, W. B. 1993, ASP Conf. Ser., 52, 246 [Google Scholar]
- Leitherer, C., Schaerer, D., Goldader, J. D., et al. 1999, ApJS, 123, 3 [Google Scholar]
- Lequeux, J., Peimbert, M., Rayo, J. F., Serrano, A., & Torres-Peimbert, S. 1979, A&A, 80, 155 [Google Scholar]
- Leroy, A. K., Walter, F., Brinks, E., et al. 2008, AJ, 136, 2782 [Google Scholar]
- Leroy, A. K., Walter, F., Bigiel, F., et al. 2009, AJ, 137, 4670 [Google Scholar]
- Leroy, A. K., Bolatto, A., Gordon, K., et al. 2011, ApJ, 737, 12 [Google Scholar]
- Leroy, A. K., Walter, F., Sandstrom, K., et al. 2013, AJ, 146, 19 [Google Scholar]
- Leroy, A. K., Hughes, A., Liu, D., et al. 2021a, ApJS, 255, 19 [NASA ADS] [CrossRef] [Google Scholar]
- Leroy, A. K., Schinnerer, E., Hughes, A., et al. 2021b, ApJS, 257, 43 [NASA ADS] [CrossRef] [Google Scholar]
- Levine, S. E., & Sparke, L. S. 1998, ApJ, 496, L13 [NASA ADS] [CrossRef] [Google Scholar]
- Li, H., Vogelsberger, M., Marinacci, F., et al. 2019, MNRAS, 487, 364 [NASA ADS] [CrossRef] [Google Scholar]
- Li, Q., Narayanan, D., & Davé, R. 2019, MNRAS, 490, 1425 [CrossRef] [Google Scholar]
- Lin, L., Pan, H.-A., Ellison, S. L., et al. 2019, ApJ, 884, L33 [NASA ADS] [CrossRef] [Google Scholar]
- Lisenfeld, U., Xu, C. K., Gao, Y., et al. 2019, A&A, 627, A107 [NASA ADS] [CrossRef] [EDP Sciences] [Google Scholar]
- Madden, S. C., Rémy-Ruyer, A., Galametz, M., et al. 2013, PASP, 125, 600 [NASA ADS] [CrossRef] [Google Scholar]
- Madden, S. C., Cormier, D., Hony, S., et al. 2020, A&A, 643, A141 [NASA ADS] [CrossRef] [EDP Sciences] [Google Scholar]
- Magrini, L., Bianchi, S., Corbelli, E., et al. 2011, A&A, 535, A13 [NASA ADS] [CrossRef] [EDP Sciences] [Google Scholar]
- Magrini, L., Hunt, L., Galli, D., et al. 2012, MNRAS, 427, 1075 [CrossRef] [Google Scholar]
- Magrini, L., Coccato, L., Stanghellini, L., et al. 2016, A&A, 588, A91 [NASA ADS] [CrossRef] [EDP Sciences] [Google Scholar]
- Maiolino, R., & Mannucci, F. 2019, A&ARv, 27, 3 [Google Scholar]
- Mancillas, B., Combes, F., & Duc, P.-A. 2019, A&A, 630, A112 [NASA ADS] [CrossRef] [EDP Sciences] [Google Scholar]
- McMullin, J. P., Waters, B., Schiebel, D., et al. 2007, Astronomical Data Analysis Software and Systems XVI, 376, 127 [NASA ADS] [Google Scholar]
- McKinnon, R., Vogelsberger, M., Torrey, P., Marinacci, F., & Kannan, R. 2018, MNRAS, 478, 2851 [NASA ADS] [CrossRef] [Google Scholar]
- Meidt, S. E., Schinnerer, E., Knapen, J. H., et al. 2012, ApJ, 744, 17 [NASA ADS] [CrossRef] [Google Scholar]
- Misiriotis, A., Xilouris, E. M., Papamastorakis, J., et al. 2006, A&A, 459, 113 [NASA ADS] [CrossRef] [EDP Sciences] [Google Scholar]
- Morselli, L., Rodighiero, G., Enia, A., et al. 2020, MNRAS, 496, 4606 [NASA ADS] [CrossRef] [Google Scholar]
- Morselli, L., Renzini, A., Enia, A., et al. 2021, MNRAS, 502, L85 [NASA ADS] [CrossRef] [Google Scholar]
- Muñoz-Mateos, J. C., Gil de Paz, A., Boissier, S., et al. 2009, ApJ, 701, 1965 [CrossRef] [Google Scholar]
- Muraoka, K., Sorai, K., Miyamoto, Y., et al. 2019, PASJ, 71, S15 [NASA ADS] [CrossRef] [Google Scholar]
- Narayanan, D., Krumholz, M. R., Ostriker, E. C., & Hernquist, L. 2012, MNRAS, 421, 3127 [NASA ADS] [CrossRef] [Google Scholar]
- Nersesian, A., Xilouris, E. M., Bianchi, S., et al. 2019, A&A, 624, A80 [NASA ADS] [CrossRef] [EDP Sciences] [Google Scholar]
- Noordermeer, E., Sparke, L. S., & Levine, S. E. 2001, MNRAS, 328, 1064 [NASA ADS] [CrossRef] [Google Scholar]
- Orellana, G., Nagar, N. M., Elbaz, D., et al. 2017, A&A, 602, A68 [NASA ADS] [CrossRef] [EDP Sciences] [Google Scholar]
- Ostriker, E. C., McKee, C. F., & Leroy, A. K. 2010, ApJ, 721, 975 [CrossRef] [Google Scholar]
- Padoan, P., Haugbølle, T., & Nordlund, Å. 2012, ApJ, 759, L27 [Google Scholar]
- Pan, H.-A., Lin, L., Hsieh, B.-C., et al. 2018, ApJ, 854, 159 [NASA ADS] [CrossRef] [Google Scholar]
- Peng, C. Y., Ho, L. C., Impey, C. D., et al. 2010, AJ, 139, 2097 [NASA ADS] [CrossRef] [Google Scholar]
- Pessa, I., Schinnerer, E., Belfiore, F., et al. 2021, A&A, 650, A134 [NASA ADS] [CrossRef] [EDP Sciences] [Google Scholar]
- Pettini, M., & Pagel, B. E. J. 2004, MNRAS, 348, L59 [NASA ADS] [CrossRef] [Google Scholar]
- Pilyugin, L. S., & Grebel, E. K. 2016, MNRAS, 457, 3678 [NASA ADS] [CrossRef] [Google Scholar]
- Pisano, D. J., Wilcots, E. M., & Elmegreen, B. G. 1998, AJ, 115, 975 [NASA ADS] [CrossRef] [Google Scholar]
- Pisano, D. J., Wilcots, E. M., & Elmegreen, B. G. 2000, AJ, 120, 763 [NASA ADS] [CrossRef] [Google Scholar]
- Poggianti, B. M., Moretti, A., Gullieuszik, M., et al. 2017, ApJ, 844, 48 [Google Scholar]
- Pokhrel, R., Gutermuth, R. A., Betti, S. K., et al. 2020, ApJ, 896, 60 [NASA ADS] [CrossRef] [Google Scholar]
- Pokhrel, R., Gutermuth, R. A., Krumholz, M. R., et al. 2021, ApJ, 912, L19 [CrossRef] [Google Scholar]
- Popping, G., & Péroux, C. 2022, MNRAS, 513, 1531 [CrossRef] [Google Scholar]
- Popping, G., Somerville, R. S., & Galametz, M. 2017, MNRAS, 471, 3152 [NASA ADS] [CrossRef] [Google Scholar]
- Querejeta, M., Meidt, S. E., Schinnerer, E., et al. 2015, ApJS, 219, 5 [NASA ADS] [CrossRef] [Google Scholar]
- Relaño, M., De Looze, I., Kennicutt, R. C., et al. 2018, A&A, 613, A43 [NASA ADS] [CrossRef] [EDP Sciences] [Google Scholar]
- Relaño, M., De Looze, I., Saintonge, A., et al. 2022, MNRAS, 515, 5306 [CrossRef] [Google Scholar]
- Rémy-Ruyer, A., Madden, S. C., Galliano, F., et al. 2014, A&A, 563, A31 [Google Scholar]
- Rodighiero, G., Renzini, A., Daddi, E., et al. 2014, MNRAS, 443, 19 [Google Scholar]
- Rosolowsky, E., & Simon, J. D. 2008, ApJ, 675, 1213 [NASA ADS] [CrossRef] [Google Scholar]
- Roychowdhury, S., Huang, M.-L., Kauffmann, G., et al. 2015, MNRAS, 449, 3700 [NASA ADS] [CrossRef] [Google Scholar]
- Sage, L. J., & Westpfahl, D. J. 1991, A&A, 242, 371 [NASA ADS] [Google Scholar]
- Saikia, G., Patra, N. N., Roy, N., et al. 2020, MNRAS, 492, 2517 [NASA ADS] [CrossRef] [Google Scholar]
- Sakamoto, K., Fukuda, H., Wada, K., et al. 2001, AJ, 122, 1319 [NASA ADS] [CrossRef] [Google Scholar]
- Saintonge, A., & Catinella, B. 2022, ARA&A, 60, 319 [NASA ADS] [CrossRef] [Google Scholar]
- Saintonge, A., Kauffmann, G., Kramer, C., et al. 2011, MNRAS, 415, 32 [NASA ADS] [CrossRef] [Google Scholar]
- Saintonge, A., Catinella, B., Cortese, L., et al. 2016, MNRAS, 462, 1749 [Google Scholar]
- Sánchez, S. F. 2020, ARA&A, 58, 99 [Google Scholar]
- Sánchez, S. F., Rosales-Ortega, F. F., Iglesias-Páramo, J., et al. 2014, A&A, 563, A49 [CrossRef] [EDP Sciences] [Google Scholar]
- Sánchez, S. F., Avila-Reese, V., Hernandez-Toledo, H., et al. 2018, Rev. Mex. Astron. Astrofis., 54, 217 [Google Scholar]
- Sánchez, S. F., Barrera-Ballesteros, J. K., Colombo, D., et al. 2021, MNRAS, 503, 1615 [CrossRef] [Google Scholar]
- Sánchez-Gallego, J. R., Knapen, J. H., Heiner, J. S., et al. 2011, A&A, 527, A16 [NASA ADS] [CrossRef] [EDP Sciences] [Google Scholar]
- Sanders, N. E., Caldwell, N., McDowell, J., et al. 2012, ApJ, 758, 133 [NASA ADS] [CrossRef] [Google Scholar]
- Santini, P., Fontana, A., Grazian, A., et al. 2009, A&A, 504, 751 [NASA ADS] [CrossRef] [EDP Sciences] [Google Scholar]
- Santini, P., Fontana, A., Castellano, M., et al. 2017, ApJ, 847, 76 [NASA ADS] [CrossRef] [Google Scholar]
- Sandstrom, K. M., Leroy, A. K., Walter, F., et al. 2013, ApJ, 777, 5 [Google Scholar]
- Schmidt, M. 1959, ApJ, 129, 243 [NASA ADS] [CrossRef] [Google Scholar]
- Schmidt, M. 1963, ApJ, 137, 758 [Google Scholar]
- Schreiber, C., Pannella, M., Elbaz, D., et al. 2015, A&A, 575, A74 [NASA ADS] [CrossRef] [EDP Sciences] [Google Scholar]
- Schruba, A., Leroy, A. K., Walter, F., et al. 2011, AJ, 142, 37 [NASA ADS] [CrossRef] [Google Scholar]
- Schruba, A., Leroy, A. K., Walter, F., et al. 2012, AJ, 143, 138 [NASA ADS] [CrossRef] [Google Scholar]
- Silk, J. 1997, ApJ, 481, 703 [CrossRef] [Google Scholar]
- Smith, M. W. L., Eales, S. A., De Looze, I., et al. 2016, MNRAS, 462, 331 [NASA ADS] [CrossRef] [Google Scholar]
- Solomon, P. M., & de Zafra, R. 1975, ApJ, 199, L79 [NASA ADS] [CrossRef] [Google Scholar]
- Solomon, P. M., Rivolo, A. R., Barrett, J., et al. 1987, ApJ, 319, 730 [NASA ADS] [CrossRef] [Google Scholar]
- Sorai, K., Kuno, N., Muraoka, K., et al. 2019, PASJ, 71, S14 [Google Scholar]
- Thorp, M. D., Ellison, S. L., Pan, H.-A., et al. 2022, MNRAS, 516, 1462 [NASA ADS] [CrossRef] [Google Scholar]
- Tomczak, A. R., Quadri, R. F., Tran, K.-V. H., et al. 2016, ApJ, 817, 118 [Google Scholar]
- Tremonti, C. A., Heckman, T. M., Kauffmann, G., et al. 2004, ApJ, 613, 898 [Google Scholar]
- Tully, R. B., & Fisher, J. R. 1977, A&A, 54, 661 [NASA ADS] [Google Scholar]
- Viaene, S., Fritz, J., Baes, M., et al. 2014, A&A, 567, A71 [NASA ADS] [CrossRef] [EDP Sciences] [Google Scholar]
- Vila-Costas, M. B., & Edmunds, M. G. 1992, MNRAS, 259, 121 [NASA ADS] [CrossRef] [Google Scholar]
- Vílchez, J. M., Relaño, M., Kennicutt, R., et al. 2019, MNRAS, 483, 4968 [CrossRef] [Google Scholar]
- Vulcani, B., Poggianti, B. M., Moretti, A., et al. 2019, MNRAS, 488, 1597 [NASA ADS] [CrossRef] [Google Scholar]
- Vutisalchavakul, N., Evans, N. J., & Battersby, C. 2014, ApJ, 797, 77 [NASA ADS] [CrossRef] [Google Scholar]
- Walter, F., Brinks, E., de Blok, W. J. G., et al. 2008, AJ, 136, 2563 [Google Scholar]
- Willis, S., Guzman, A., Marengo, M., et al. 2015, ApJ, 809, 87 [NASA ADS] [CrossRef] [Google Scholar]
- Wolfire, M. G., Hollenbach, D., & McKee, C. F. 2010, ApJ, 716, 1191 [Google Scholar]
- Wong, T., & Blitz, L. 2002, ApJ, 569, 157 [CrossRef] [Google Scholar]
- Wong, T., Xue, R., Bolatto, A. D., et al. 2013, ApJ, 777, L4 [NASA ADS] [CrossRef] [Google Scholar]
- Xilouris, E. M., Byun, Y. I., Kylafis, N. D., et al. 1999, A&A, 344, 868 [NASA ADS] [Google Scholar]
- Yajima, Y., Sorai, K., Miyamoto, Y., et al. 2021, PASJ, 73, 257 [NASA ADS] [CrossRef] [Google Scholar]
- Yates, R. M., Henriques, B. M. B., Fu, J., et al. 2021, MNRAS, 503, 4474 [NASA ADS] [CrossRef] [Google Scholar]
- Ysard, N., Köhler, M., Jones, A., et al. 2015, A&A, 577, A110 [NASA ADS] [CrossRef] [EDP Sciences] [Google Scholar]
- Zaragoza-Cardiel, J., Fritz, J., Aretxaga, I., et al. 2019, MNRAS, 487, L61 [NASA ADS] [CrossRef] [Google Scholar]
- Zaragoza-Cardiel, J., Fritz, J., Aretxaga, I., et al. 2020, MNRAS, 499, 1172 [NASA ADS] [CrossRef] [Google Scholar]
- Zhukovska, S. 2014, A&A, 562, A76 [NASA ADS] [CrossRef] [EDP Sciences] [Google Scholar]
Appendix A: Additional figures – Scaling relations
In this section, we collect figures showing SRs for the entire galaxy sample as done in Fig. 1 for NGC 6946. Main parameters of the linear fits are collected in Table A.1.
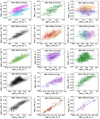 |
Fig. A.1. continued. |
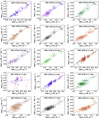 |
Fig. A.1. continued. |
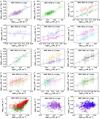 |
Fig. A.1. continued. |
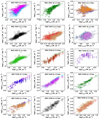 |
Fig. A.1. continued. |
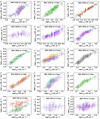 |
Fig. A.1. continued. |
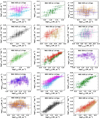 |
Fig. A.1. continued. |
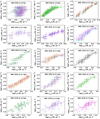 |
Fig. A.1. continued. |
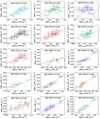 |
Fig. A.1. continued. |
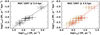 |
Fig. A.1. continued. |
Parameters of the linear fits applied to the pixel-by-pixel SRs for each sample galaxy at the physical scale imposed by the dust map and at 3.4 kpc, for all galaxies evaluated together at the common scale of 3.4 kpc, and the median slopes of the SRs at 3.4 kpc presented in Sect. 5.
Appendix B: Peculiar galaxies in scaling relations
In this section we provide details on galaxies showing different behaviors from most galaxies in terms of SRs. We present these galaxies based on the studied SRs.
B.1. Σdust–ΣH2
NGC 925 and NGC 1097 present the Σdust–ΣH2 SR with linear and sublinear slope, respectively. NGC 925 has a dust-to-H2 mass ratio within r25 approximately consistent within 1σ with the mean value computed for galaxies of the same morphological stage (T = 7, C20). The dust-to-H2 mass ratio of NGC 925 is not therefore able to explain the lower (linear) slope of the Σdust–ΣH2 SR, that is close to the lower limit of the slopes of the other sample galaxies. NGC 1097 has instead a very much lower dust-to-H2 mass ratio than the mean ratio of galaxies of the same morphological stage (T = 3, C20), and this could explain the sublinear slope in the Σdust–ΣH2 SR of NGC 1097.
B.2. Σdust–ΣHI
The Σdust–ΣHI SR is strong for NGC 7793 and NGC 4736 and moderate for NGC 5194, NGC 5055, NGC 3521, and NGC 4725. These galaxies have dust-to-H I mass ratios a factor ∼0.3–0.6 times lower than mean ratios for galaxies of the same morphological stages (C20). This could indicate a peculiar overabundance of H I, with respect to dust, that correlates well with the dust itself, within r25. The pixel-by-pixel SR between dust and H I in NGC 7793 has been recently studied by Saikia et al. (2020) finding a weaker correlation than ours. This discrepancy could be due to a mixture of different factors. Saikia et al. (2020) studied the dust-H I correlation at the angular resolution imposed by the H I map of 15 6 ×10
6 ×10 8 (∼0.3 kpc × 0.2 kpc), higher than ours, and they used different, individually treated, IR tracers of dust (emissions at 8, 24, 70, 100, 160 μm) and not an estimation of the dust mass. They found a trend in the variation of dust-H I SRs with individual IR bands, and this is particularly evident for NGC 7793 where the values of the correlation coefficient increase drastically with an increase in IR emission wavelength.
B.3. Σstar–ΣH2
NGC 925 and NGC 1365 are two outlier cases in the Σstar–ΣH2 SR with slope sublinear and superlinear, respectively. For NGC 925 this SR breaks down under the assumption of metallicity-dependent XCO. We note that NGC 925 is an outlier case also in the Σdust–ΣH2 SR. This galaxy has a star-to-H2 mass ratio within r25 a factor 1.5 times higher than (although consistent within 1σ with) the corresponding mean value for galaxies of the same morphological stage (T = 7, data from DustPedia database). This could explain the particularly low slope of the Σstar–ΣH2 SR in NGC 925. Also, the particularly high slope of NGC 1365 is likely explainable by its star-to-H2 mass ratio, an order of magnitude lower than the corresponding mean value for galaxies of the same morphological stage (T = 3, data from DustPedia database).
B.4. Σstar–Σdust
For NGC 300 the Σstar–Σdust SR could break down for different reasons such as i) the physical scale under analysis, ii) an anomalous distribution of dust mass, iii) a low dust-to-star mass ratio. The physical scale of 0.3 kpc (the smallest of the sample) at which NGC 300 is studied could be too small to observe a spatial correlation between Σstar and Σdust. However, Viaene et al. (2014) found a strong correlation between star and dust, expressed in terms of the relationship between Mdust/Mstar and the stellar mass surface density (indicated with μstar in that paper), for the very nearby (D = 785 kpc) Andromeda galaxy (M 31) at the 0.1 kpc scale. It is also well known that dust is generally distributed in a disk with an exponential decline as a function of radius (see references in Sect. 7), however in C17 we found that Σdust in NGC 300 is flat and it can not be fitted with an exponential curve (this happens only for NGC 300 in the studied sample, see Table 6 and Fig. A.2 in C17). Finally, the dust-to-star mass ratio of NGC 300 is a factor 2 times higher than the corresponding mean value for galaxies of the same morphological stage (T = 7, data from DustPedia database and Table 7 of C20). The reason of a low dust-to-star mass ratio is not therefore viable to explain the breaking down of the Σstar–Σdust SR in NGC 300. All these considerations seem to suggest that Σstar and Σdust are not correlated in NGC 300 because of the anomalous dust mass distribution.
For NGC 3031 studied at 0.6 kpc the weak Σstar–Σdust SR could be explained by its dust-to-star mass ratio, a factor 2 times lower than the corresponding mean value for galaxies of the same morphological stage (T = 2, data from DustPedia database and Table 7 of C20). We recall that NGC 3031 is a kind of prototype of CO-poor galaxies (e.g., Solomon & de Zafra 1975; Combes et al. 1977; Brouillet et al. 1991; Sage & Westpfahl 1991; Sakamoto et al. 2001; Helfer et al. 2003; Knapen et al. 2006; Casasola et al. 2007; Sánchez-Gallego et al. 2011). Since the formation of H2 molecules takes place on the surface of dust grains (Gould & Salpeter 1963), a connection between dust and molecular gas is expected and observed. Therefore, the poor content of molecular gas characterizing NGC 3031 can also explain, at least partially, its low dust content.
B.5. Σstar–Σtot gas
For NGC 2403 and NGC 925 the Σstar–Σtot gas SR is weak. Since Σstar and ΣH2 are well correlated in NGC 2403, it is H I gas that produces the breaking down of the Σstar–Σtot gas SR. NGC 2403 is indeed defined as an H I-dominated galaxy (see Bigiel et al. 2008) with a H2-to-H I mass ratio a factor ∼7 times lower than the corresponding mean value for galaxies of the same morphological stage (T = 6, data from DustPedia database and Table 4 of C20). This overabundance of H I could be due to environmental effects. NGC 2403 is an outlying member of the M 81 Group and it is classified as an interacting galaxy (Casasola et al. 2004). It is known that interactions between galaxies and environment play an important role in determining galaxy structure and properties, and the distribution of gas is expected to reflect the effects of the interaction more strongly than that of stars (e.g., Combes et al. 1994; Casasola et al. 2004; Thorp et al. 2022). Also NGC 925 is an H I-dominated galaxy (see Bigiel et al. 2008) with H2-to-H I mass ratio a factor ∼20 times lower than the corresponding mean value for galaxies of the same morphological stage (T = 7, data from DustPedia database and Table 4 of C20). This should explain why the profile of Σtot gas as a function of radius in NGC 925 is flat and it cannot be fitted with an exponential curve (see Table 6 and Fig. A.2 in C17). In addition, NGC 925 has, together with NGC 2403, the lowest mean metallicity in the sample (see Table 1). These peculiar properties characterizing NGC 925 cannot be attributed to the environment since it is an isolated galaxy (Bettoni et al. 2003). Maybe the presence of the bar in the centre of NGC 925 could have played a role in defining of properties of this galaxy. NGC 925 has been the target of many multiwavelength observational campaigns, with a particular focus on its bar (e.g., Elmegreen et al. 1998; Pisano et al. 1998, 2000). These observations showed that NGC 925 is a galaxy fraught with asymmetries and that the centre of its bar is offset from the dynamical centre of the galaxy by ∼1 kpc. Pisano et al. (2000) suggested that the asymmetries observed in NGC 925 could be related to the presence of H I clouds interacting with the main galaxy. An off-centre bar and asymmetries are typical properties of barred Magellanic galaxies (de Vaucouleurs & Freeman 1972, see in particular the Large Magellanic Cloud) that do not suddenly appear but are long-lasting processes occurring during the life of a galaxy (e.g., Levine & Sparke 1998; Noordermeer et al. 2001; Kruk et al. 2017).
B.6. Σtot gas–ΣSFR
The moderate Σtot gas–ΣSFR SR found for NGC 2403 is likely due to its H I-dominated nature, while the high slope found for NGC 628 and NGC 3521 does not seem linked to peculiar galaxy properties.
Appendix C: Other calibrations of XCO
In this section we show the results obtained by adopting other two calibrations of XCO. One calibration is proposed by Bolatto et al. (2013) and is based on models and observations. It provides a metallicity and surface density dependent XCO (see their Eq. (31)) which can be written as:
 (C.1)
(C.1)
where  is the conversion factor for the Milky Way (2.0 × 1020 cm−2 (K km s−1)−1), Σstar + gas is the total (star+gas) surface density in units of M⊙ pc−2, and γ ≈ 0.5 for Σstar + gas > 100 M⊙ pc−2 and γ = 0 otherwise (see Bolatto et al. 2013, for details). The other calibration of XCO is presented from Madden et al. (2020) and is based on Cloudy models (Ferland et al. 2017) and observations. It provides a CO-to-H2 conversion factor including both the CO-dark and the CO-bright gas and as a function of metallicity (see their Eq. (6)). It can be written as:
 (C.2)
(C.2)
This calibration is based on star-forming low-metallicity galaxies of the Herschel Dwarf Galaxy Survey (Madden et al. 2013) consisting of 50 galaxies ranging from very low metallicity (12 + log(O/H) ∼ 7.1) to moderate metallicity (∼8.4).
Figure C.1 shows the Σdust–ΣH2 SR for NGC 6946 with fits to the data obtained adopting these other two calibrations of XCO. The prescription of Bolatto et al. (2013) depending on Σstar + gas and metallicity provides similar slopes to (or slightly lower than) those found with the assumption of Amorín et al. (2016), while that of Madden et al. (2020) always gives lower slopes maybe due to the lower metallicities characterizing their sample (only partially overlap with the metallicity range of our sample). These other two assumptions of XCO provide slightly lower R (and higher σ) than those obtained under the adopted prescriptions. Since these other two recipes of XCO do no show extremely different results, we have decided not to show them for the all SRs involving molecular gas.
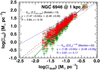 |
Fig. C.1. Σdust–ΣH2 SR for NGC 6946 shown in Fig. 1 with fits to the data obtained adopting the prescription of a Σstar + gas and metallicity-dependent XCO by Bolatto et al. (2013) (dotted black line) and the prescription of a metallicity-dependent XCO by Madden et al. (2020) (dash-dot blue line). Equations of these fits are also given in figure. |
All Tables
Mean values of dust-to-stellar, dust-to-gas, and dust-to-metal ratios for the galaxy sample at 3.4 kpc.
Parameters of the linear fits applied to the pixel-by-pixel SRs for each sample galaxy at the physical scale imposed by the dust map and at 3.4 kpc, for all galaxies evaluated together at the common scale of 3.4 kpc, and the median slopes of the SRs at 3.4 kpc presented in Sect. 5.
All Figures
|
Fig. 1. Resolved SRs for the galaxy NGC 6946 within r25 at the resolution of 1 kpc, in logarithmic scale. From left to right: Σdust–ΣH2, Σdust–ΣHI, Σdust–Σtot gas, Σstar–ΣH2, Σstar–Σdust, Σstar–Σtot gas, Σstar–ΣSFR, ΣH2–ΣSFR, Σtot gas–ΣSFR, Σbar–ΣSFR. Two sets of data are shown when the H2 gas is involved according to the two assumptions on XCO (see the legends). The lines are the linear fits to the data: continuum line for the constant XCO (Bolatto et al. 2013), dashed line for the metallicity-dependent XCO (Amorín et al. 2016). Fit parameters are also given in the figures. |
| In the text | |
|
Fig. 1. continued. |
| In the text | |
|
Fig. 2. Same as Fig. 1 for all sample galaxies evaluated together at the common scale of 3.4 kpc. Only data referring to the assumption of the constant XCO are shown, while the drawn lines refer to the fits under the two assumptions on XCO. Different symbols (and colors) represent different galaxies according to the legend shown in the panel displaying the Σdust–ΣHI SR. |
| In the text | |
|
Fig. 2. continued. |
| In the text | |
|
Fig. 3. Linear fits of the dust-total gas (left panel) and SFMS (right panel) SRs of sample galaxies individually evaluated at the physical scale imposed by the dust map resolution (36″), from 0.3 to 3.4 kpc (see Sect. 5.1). Each colored fit corresponds to a galaxy according to the legend shown in the left panel. The total gas refers to the assumption of the constant XCO (Bolatto et al. 2013). |
| In the text | |
|
Fig. 4. Slopes of the dust-total gas (left panel) and SFMS (right panel) SRs of sample galaxies individually evaluated at 3.4 kpc (see Sect. 5.2). Each colored dot corresponds to a galaxy. The transparent symbols represent the corresponding slopes at the resolution imposed by the dust map (see Sect. 5.1). The light blue band is the median slope with error and the gray star the slope of all galaxies at 3.4 kpc (see Table A.1). The total gas refers to the assumption of the constant XCO (Bolatto et al. 2013). |
| In the text | |
|
Fig. 5. Logarithm of dust-to-stellar mass ratio as a function of logarithm of stellar mass (left panel) and SSFR surface density (right panel). The continuum line is the linear fit to the data (see Table 5). Symbols are same as Fig. 2. |
| In the text | |
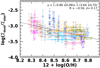 |
Fig. 6. Same as Fig. 5, but as a function of gas-phase metallicity. |
| In the text | |
|
Fig. 7. Logarithm of dust-to-gas mass ratio as a function of logarithm of Σstar (left panel) and ΣSSFR (right panel). Data points refer to the assumption of the constant XCO, fit lines to both prescriptions on XCO (see legend). Symbols are same as Fig. 2. |
| In the text | |
|
Fig. 8. Same as Fig. 7, but as a function of 12 + log (O/H) (left panel) and logarithm of fgas (right panel). |
| In the text | |
|
Fig. 9. Same as Fig. 7, but as a function of ΣH2/Σtot gas (left panel) and logarithm of ΣH2/ΣHI (right panel). In the left panel, the drawn black line is the fit to the data and it only helps to follow the trend (the corresponding equation is not provided). |
| In the text | |
|
Fig. 10. Logarithm of dust-to-metal ratio as a function of logarithm of Σstar (left panel) and of ΣSSFR (right panel). Data points refer to constant XCO, fit lines to both assumptions on XCO (see legend in Fig. 7 and Table 5). Symbols are same as Fig. 2. |
| In the text | |
|
Fig. 11. Same as Fig. 10, but as a function of 12 + log (O/H) (left panel) and logarithmic of fgas (right panel). |
| In the text | |
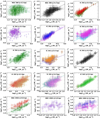 |
Fig. A.1. SRs for the entire sample, except for the galaxy NGC 6946 already shown in Fig. 1. |
| In the text | |
|
Fig. A.1. continued. |
| In the text | |
|
Fig. A.1. continued. |
| In the text | |
|
Fig. A.1. continued. |
| In the text | |
|
Fig. A.1. continued. |
| In the text | |
|
Fig. A.1. continued. |
| In the text | |
|
Fig. A.1. continued. |
| In the text | |
|
Fig. A.1. continued. |
| In the text | |
|
Fig. A.1. continued. |
| In the text | |
|
Fig. A.1. continued. |
| In the text | |
|
Fig. C.1. Σdust–ΣH2 SR for NGC 6946 shown in Fig. 1 with fits to the data obtained adopting the prescription of a Σstar + gas and metallicity-dependent XCO by Bolatto et al. (2013) (dotted black line) and the prescription of a metallicity-dependent XCO by Madden et al. (2020) (dash-dot blue line). Equations of these fits are also given in figure. |
| In the text | |
Current usage metrics show cumulative count of Article Views (full-text article views including HTML views, PDF and ePub downloads, according to the available data) and Abstracts Views on Vision4Press platform.
Data correspond to usage on the plateform after 2015. The current usage metrics is available 48-96 hours after online publication and is updated daily on week days.
Initial download of the metrics may take a while.