Open Access
Fig. 7.
Download original image
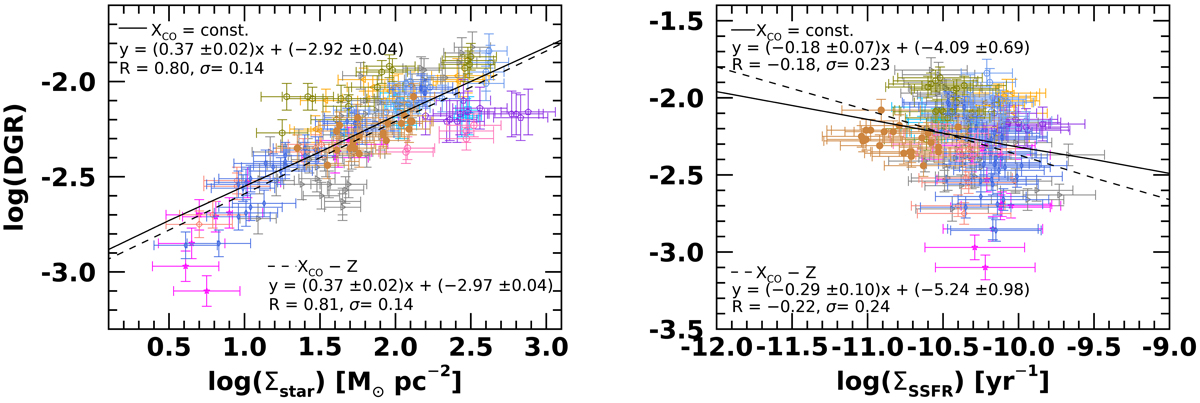
Logarithm of dust-to-gas mass ratio as a function of logarithm of Σstar (left panel) and ΣSSFR (right panel). Data points refer to the assumption of the constant XCO, fit lines to both prescriptions on XCO (see legend). Symbols are same as Fig. 2.
Current usage metrics show cumulative count of Article Views (full-text article views including HTML views, PDF and ePub downloads, according to the available data) and Abstracts Views on Vision4Press platform.
Data correspond to usage on the plateform after 2015. The current usage metrics is available 48-96 hours after online publication and is updated daily on week days.
Initial download of the metrics may take a while.