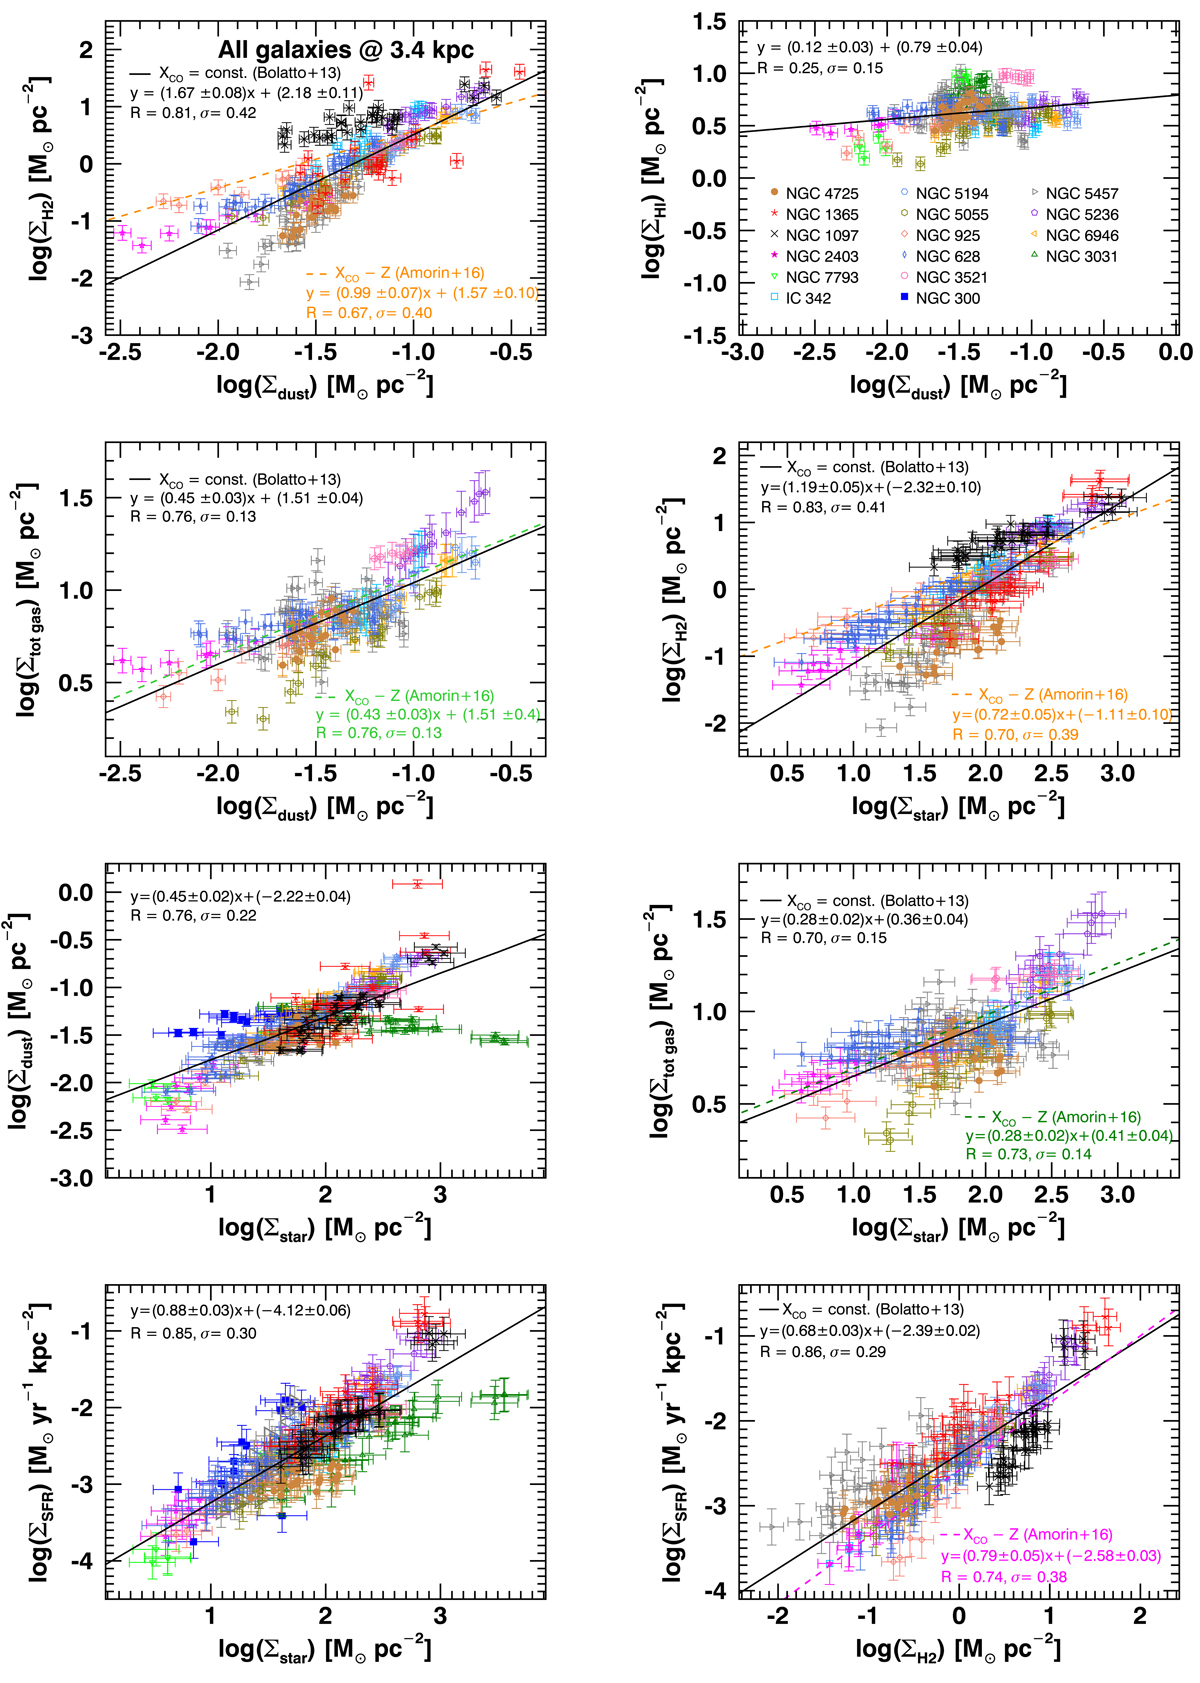
Fig. 2.
Download original image
Same as Fig. 1 for all sample galaxies evaluated together at the common scale of 3.4 kpc. Only data referring to the assumption of the constant XCO are shown, while the drawn lines refer to the fits under the two assumptions on XCO. Different symbols (and colors) represent different galaxies according to the legend shown in the panel displaying the Σdust–ΣHI SR.
Current usage metrics show cumulative count of Article Views (full-text article views including HTML views, PDF and ePub downloads, according to the available data) and Abstracts Views on Vision4Press platform.
Data correspond to usage on the plateform after 2015. The current usage metrics is available 48-96 hours after online publication and is updated daily on week days.
Initial download of the metrics may take a while.