Fig. 4.
Download original image
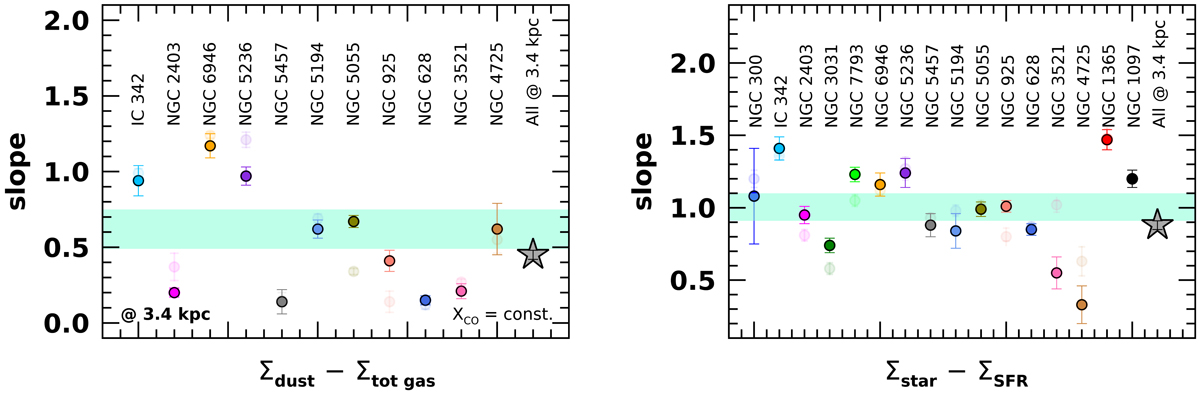
Slopes of the dust-total gas (left panel) and SFMS (right panel) SRs of sample galaxies individually evaluated at 3.4 kpc (see Sect. 5.2). Each colored dot corresponds to a galaxy. The transparent symbols represent the corresponding slopes at the resolution imposed by the dust map (see Sect. 5.1). The light blue band is the median slope with error and the gray star the slope of all galaxies at 3.4 kpc (see Table A.1). The total gas refers to the assumption of the constant XCO (Bolatto et al. 2013).
Current usage metrics show cumulative count of Article Views (full-text article views including HTML views, PDF and ePub downloads, according to the available data) and Abstracts Views on Vision4Press platform.
Data correspond to usage on the plateform after 2015. The current usage metrics is available 48-96 hours after online publication and is updated daily on week days.
Initial download of the metrics may take a while.