Open Access
Fig. 9.
Download original image
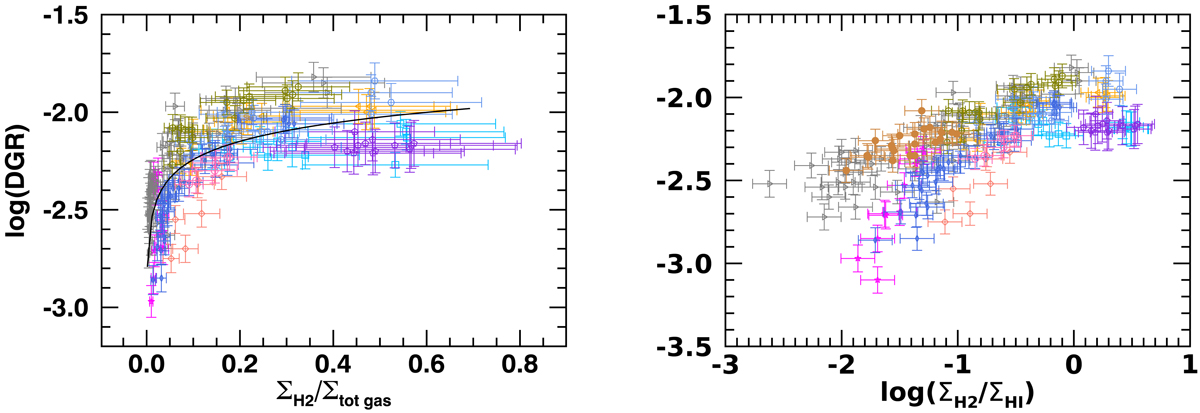
Same as Fig. 7, but as a function of ΣH2/Σtot gas (left panel) and logarithm of ΣH2/ΣHI (right panel). In the left panel, the drawn black line is the fit to the data and it only helps to follow the trend (the corresponding equation is not provided).
Current usage metrics show cumulative count of Article Views (full-text article views including HTML views, PDF and ePub downloads, according to the available data) and Abstracts Views on Vision4Press platform.
Data correspond to usage on the plateform after 2015. The current usage metrics is available 48-96 hours after online publication and is updated daily on week days.
Initial download of the metrics may take a while.