| Issue |
A&A
Volume 666, October 2022
|
|
|---|---|---|
| Article Number | A103 | |
| Number of page(s) | 9 | |
| Section | Extragalactic astronomy | |
| DOI | https://doi.org/10.1051/0004-6361/202141435 | |
| Published online | 12 October 2022 | |
Shape of the outer stellar warp in the Large Magellanic Cloud disk
1
Indian Institute of Astrophysics, Koramangala II Block, Bangalore 560034, India
e-mail: saroonsasi19@gmail.com; smitha.subramanian@iiap.res.in
2
Amrita Vishwa Vidhyapeetham, Amritapuri, Kollam, Kerala 690525, India
Received:
31
May
2021
Accepted:
2
June
2022
Warps are vertical distortions of the stellar or gaseous disks of galaxies. One of the proposed scenarios for the formation of warps involves tidal interactions among galaxies. A recent study identified a stellar warp in the outer regions of the south-western (SW) disk of the Large Magellanic Cloud (LMC) and suggested that it might have originated due to the tidal interaction between the LMC and the Small Magellanic Cloud (SMC). Due to the limited spatial coverage of the data, the authors could not investigate the counterpart of this warp in the north-eastern (NE) region, which is essential to understanding the global shape, nature, and origin of the outer LMC warp. In this work, we study the structure of the LMC disk using data on red clump stars from the Gaia Early Data Release 3 (EDR3), which cover the entire Magellanic system. We detected a warp in the NE outer LMC disk which is deviated from the disk plane in the same direction as that of the SW outer warp, but with a lower amplitude. This suggests that the outer LMC disk has an asymmetric stellar warp, which is likely to be a U-shaped warp. Our result provides an observational constraint to the theoretical models of the Magellanic system aimed at improving the understanding the LMC-SMC interaction history.
Key words: galaxies: interactions / Magellanic Clouds / galaxies: dwarf / galaxies: structure
© S. Saroon and S. Subramanian 2022
 Open Access article, published by EDP Sciences, under the terms of the Creative Commons Attribution License (https://creativecommons.org/licenses/by/4.0), which permits unrestricted use, distribution, and reproduction in any medium, provided the original work is properly cited.
This article is published in open access under the Subscribe-to-Open model. Subscribe to A&A to support open access publication.
1. Introduction
The outer parts of most of the disk galaxies (∼60%, Sánchez-Saavedra et al. 2003) are distorted with respect to the inner disk plane forming warps (vertical distortions), which are easily identifiable in an edge-on view. Although warps are mostly found in the atomic hydrogen gas disks (Sancisi 1976; Bosma 1978), stellar warps are also observed (van der Kruit & Searle 1981). Different observed types of warps include: S-shaped (integral-shaped) warps in which both sides are warped but in opposite directions; asymmetric warps with significantly different amplitudes on both sides; U-shaped warps in which both sides are warped in the same direction; and one-sided warps, also known as L-shaped warps (Sánchez-Saavedra et al. 1990, 2003; Reshetnikov & Combes 1998; Ann & Park 2006). The Milky Way, with its integral-shaped warp, was the first ever warped galaxy discovered (Burke 1957; Kerr 1957), based on 21 cm hydrogen (HI)-line observations. The subtle stellar warp of the Milky Way was also recently observed by various stellar surveys (Schönrich & Dehnen 2018; Chen et al. 2019; Romero-Gómez et al. 2019; Skowron et al. 2019). Stellar warps have smaller amplitudes compared to HI-warps (van der Kruit 1979; Sandage & Humphreys 1980; Sasaki 1987) and 70% of the stellar warps are (integral) S shaped (Ann & Park 2006). Many of the observed S-shaped warps are also found to be asymmetric (García-Ruiz et al. 2002). Even U-shaped and one-sided or L-shaped warps have also been observed (Sánchez-Saavedra et al. 2003).
Theoretically, there are many mechanisms proposed for the formation and evolution of warps. Different scenarios include the misalignment of the galactic disk with the angular momentum of the halo (Debattista & Sellwood 1999), accretion of the intergalactic medium into the galactic disk (Shen & Sellwood 2006), and cosmic in-fall causing the outer parts of the halos to reorient (Jiang & Binney 1999; Ostriker & Binney 1989). Tidal interactions by nearby companions (Schwarzkopf & Dettmar 2001; Kollatschny & Dietrich 1990) and fly-by encounters (Vesperini & Weinberg 2000; Kim et al. 2014) have also been suggested to be responsible for the formation of warps. Reshetnikov & Combes (1998) showed that massive galaxies are less likely to warp and the most interacting galaxies show measurable warps, emphasising the role of gravitational interaction.
In this context, it is an interesting task to study the disk structure of one of the nearest interacting low-mass disk galaxies, namely, the Large Magellanic Cloud (LMC). The LMC is a disk galaxy with a planar geometry and is located at a distance of 50 ± 2 kpc (de Grijs et al. 2014). It is interacting with its neighbour, the Small Magellanic Cloud (SMC). Previously, various authors (van der Marel & Cioni 2001; Olsen & Salyk 2002; Nikolaev et al. 2004; Koerwer 2009; Subramanian & Subramaniam 2010, 2013; Inno et al. 2016 and references therein) had estimated the orientation parameters of the LMC disk using different tracers. Some studies (Olsen & Salyk 2002; Subramaniam 2003; Subramanian & Subramaniam 2010, 2013; Balbinot et al. 2015) have also identified warped and flared structures. As the LMC covers a large area in the sky, most of these studies were limited by the spatial coverage of the data and hence restricted mainly to the inner LMC disk.
A recent study by (Choi et al. 2018) used the optical data of red clump (RC) stars from the Survey of the Magellanic Stellar History (SMASH, Nidever et al. 2017), which covers a larger area of the LMC than the previous studies, and found a prominent warp on the south-western (SW) region of the outer LMC disk. The study suggested that this feature might have formed due to the direct collision of the LMC and the SMC in the recent past. But due to the limited spatial coverage of the SMASH data, they could not study the entire LMC disk, especially the north-eastern (NE) part of the outer LMC disk to find the counter-part of the SW outer warp. They also suggested that the earlier identified extra-planar features are just part of the rippled inner disk and the derived global shape of the entire LMC disk is highly dependent on the spatial coverage of the analysed data. Using the science verification data of the Dark Energy Survey, Balbinot et al. (2015) suggested that the LMC disk is warped in the outer regions north of the LMC centre. But the spatial coverage of their data covers more of northern LMC and does not cover the entire NE LMC disk, where we expect to see a counterpart of the outer SW warp.
In this study, we use the Gaia Early Data Release 3 (EDR3, Gaia Collaboration 2021) data, which covers the entire Magellanic System, to estimate the orientation parameters of the LMC disk and to find extra-planar features. The goal is mainly to look for the presence (absence) of a warp in the unexplored NE part of the outer LMC disk to get a deeper understanding of the global shape, nature, and origin of the outer warp of the LMC disk. For this study, we use the RC stars as tracers. The RC stars are more massive and metal-rich counterparts of the horizontal-branch stars, with an age and mass range of 2–9 Gyr and 1–2.2 M⊙, respectively (Girardi & Salaris 2001; Girardi 2016; Subramanian et al. 2017). They start their core helium-burning phase at an almost-fixed core mass. Hence, they have fixed absolute magnitudes and serve as useful tracers to study the three dimensional (3D) structure of their host galaxies.
2. Data
We used photometric data from the Gaia EDR3 (Riello et al. 2021) for our study. The left panel of Fig. 1, centred on the photometric centre of the LMC,  , (van der Marel & Cioni 2001; van der Marel & Kallivayalil 2014) and having an area of ∼380 deg2 of the LMC is taken for our analysis. This covers almost the entire LMC region with high stellar density, especially the unexplored NE part of the disk. The outline of the region studied by Choi et al. (2018) is shown by the red polygon on the left and middle panels of Fig. 1.
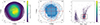 |
Fig. 1. Spatial distribution of the LMC sources, the sub-regions analysed and the Hess diagram representing the stellar density in the observed CMD of an outer sub-region are shown. Left-hand panel: Cartesian plot with the sources from the Early Data Release 3 (EDR3) for an area of ∼380 deg2 of the LMC. The colour bar from blue to yellow represents the increase in stellar density (number of stars per bin of size 8.3 arcmin2, in units of arcmin−2) Middle panel: binning of the analysed LMC region into sub-regions based on the stellar number density. The X and Y are defined as in van der Marel & Cioni (2001) with origin as LMC’s photometric centre ( |

A set of selection criteria are used to select the most probable LMC sources. To remove the foreground stars that lie below 5 kpc, a cut in parallax ( ≤ 0.2) is given. A 5-sigma deduction in flux over errors (G, GBP and GRP) is applied to select only those sources with uncertainty ≤20% and applied a cut on colour excess factor as, 1.0 + 0.015(GBP − GRP)2 < phot_bp_rp_excess_factor < 1.3 + 0.06(GBP − GRP)2. In addition, we selected sources with astrometric excess noise ≤1.3 mas and re-normalised unit weight error (RUWE) value of < 1.2. Finally, we applied a cut to the proper motion values based on the stellar density in the proper motion space (1 mas yr−1 ≤ μα ≤ 2.5 mas yr−1 and −0.8 mas yr−1 ≤ μδ ≤ +1.5 mas yr−1). This cut-off applied to the proper motion values further reduces the Milky Way contamination in the data.
The analysed region of the LMC covers the entire area where the RC feature can be easily detected in the colour magnitude diagram (CMD). The 380 deg2 LMC region, consisting of about 6 million stars after the application of the selection criteria, is divided into 3626 sub-regions. The size of the sub-region is decided based on the visual identification of the RC region in the Hess diagram. We identified that a minimum of 150 stars in the RC selection box allows a clear identification of the RC region in the HESS diagram. Again, the RC region in the CMD has contamination from the red giant branch (RGB) stars. Typical contamination from the RGB stars in the peak RC magnitude range is ∼20–30%. Thus a minimum number of 150 stars in the RC selection box suggests only ∼120–100 most probable RC stars, which sets a minimum of ∼10σ detection of most probable RC stars in each sub-region. To obtain a minimum of 150 stars in the RC selection box, we used a bin size of 10 × 10 arcmin2 in the central parts of the LMC (upto 4°) and in the outer regions, it varied from 20′×20′ to 120 × 120 arcmin2 and is illustrated in the middle panel of Fig. 1. We note that at the LMC distance, the largest sub-region has a size of ∼1.7 × 1.7 kpc2. This is relatively large to identify stellar sub-structures that span a smaller area. But these larger sub-regions are mostly in the south-eastern part of the LMC where the stellar density is less. The NE part of the LMC, which is of main interest in this study, has higher stellar density and most of the sub-regions in the outer NE part have sizes of ∼0.28 × 0.28 kpc2 (20 × 20 arcmin2) and 0.43 × 0.43 kpc2 (30 × 30 arcmin2). This can be seen in the middle panel of Fig. 1. However, the effect of the size of sub-regions on our final results are discussed in Sect. 5.
3. Analysis
3.1. HESS diagram and selection of RC stars
We constructed HESS diagrams (stellar density plots) of the G vs. (GBP − GRP) CMD for all sub-regions, with bin sizes of ∼0.01 and 0.03 mag in (GBP − GRP) and in G, respectively. The right panel of Fig. 1 shows the Hess diagram of a sub-region in the LMC disk. The RC stars in the sub-region are initially identified using the black rectangular box shown in the HESS diagram. The red rectangular box shows the re-defined or final RC selection box, as explained in Sect. 3.2. The colour bar from blue to yellow represents the increase in the number density of stars. Similar HESS diagrams for all the 3626 sub-regions are plotted and the RC stars in each sub-region are selected. The initial RC selection box is defined based on the visual identification of the RC region in the CMD of each sub-region. On average, in every sub-region, the RC stars lie within a range of 0.8−1.6 mag in (GBP − GRP) and 18.2−19.8 mag in G.
3.2. Median RC magnitudes
Initially, the median magnitude and colour, along with their standard deviation (σ) of RC stars (inside the initial RC selection box) in each sub-region were calculated. Based on these values, we redefined the RC selection box of all the sub-region. The size of this box is defined as median magnitude-colour ± 2σ magnitude-colour and is indicated by the red box in the right panel of Fig. 1. This helps to obtain a more accurate RC selection. The median magnitude and the associated standard error of the RC stars inside the redefined selection box are obtained for all the 3626 sub-regions.
3.3. Extinction correction
The median RC magnitude of each sub-region has to be corrected for the effect of interstellar extinction before we use it for the estimation of the LMC disk parameters. We used the reddening map of the LMC provided by Skowron et al. (2021) to correct for the extinction effect. The map provides reddening information for different sub-regions in the LMC covering a total area of ∼180 deg2. For the sub-regions in our study, which are within 6 deg from the LMC centre, we assigned an E(V − I) value of the nearest sub-region in the reddening map. For the sub-regions that are not covered in their study and those which lie beyond 6 deg from the LMC centre, we used the extinction values from Schlegel et al. (1998), applying the calibrations given by Schlafly & Finkbeiner (2011). The extinction in visual band, (Av) is calculated as, Av = 2.352 × E(V − I) as defined by Górski et al. (2020) and converted to AG using a factor of 0.8596, provided by Chen et al. (2019), which was derived using the extinction law from Cardelli et al. (1989). The observed median RC magnitude of each sub-region is corrected for extinction.
3.4. Distance to each sub-region
The difference between the extinction corrected RC peak magnitude, G0 mag of each sub-region, and the extinction corrected peak magnitude of the LMC centre is the relative distance modulus (μ) between the LMC centre and each sub-region; μ is defined as μ = G0 of each sub-region −G0 at the LMC centre. The relative distance modulus between the LMC centre and each sub-region can then be used to estimate the line of sight distance to each sub-region as: D = D0 × 10μ/5, where D0 is the distance to the centre of the LMC which is taken from Pietrzyński et al. (2019), as 49.59 ± 0.54 kpc. The extinction corrected magnitude (G0) of the LMC centre (central 10 × 10 arcmin2 sub-region) is 18.76 mag. In the estimation of the relative distance modulus between each sub-region and the LMC centre, we have assumed a constant intrinsic magnitude for the RC stars across the LMC. However, the intrinsic magnitude of the RC stars across the LMC can vary due to stellar population effects (Girardi 2016). The effect of variation of the intrinsic magnitude of RC stars, due to population effects, on our results are discussed in detail in Sect. 5.
3.5. Plane fit
The distance (D) and the central coordinates (RA, Dec) of each sub-region are converted to Cartesian coordinates (X, Y, Z) using the transformation equations given in van der Marel & Cioni (2001) and taking the photometric centre of the LMC  as the origin. The X-axis is anti-parallel to the right ascension axis, the Y-axis is parallel to the declination axis, and the Z-axis is towards the observer. We fit a plane to the (X, Y, Z) positions of all the sub-regions by minimising their distances to the plane using an optimisation algorithm (Terlouw & Vogelaar 2015), where the equation of the plane is defined as Z = AX + BY + C. The best-fit parameters corresponding to the LMC disk plane and the associated errors are calculated. The typical error associated with the z values is ∼0.03 kpc.
The best-fit plane parameters are (A, B, C)=(−0.405 ± 0.007, 0.144 ± 0.006, 0.946 ± 0.017). We derived the inclination (i) and the position angle of the line of nodes (θ) using the following equations:
The uncertainties in i and θ are calculated by propagating the errors of the fit parameters. For the entire data of ∼380 deg2 of the LMC disk, the best-fit plane parameters are:  and
and  . These values are comparable with the measurements from previous studies (Choi et al. 2018 and references therein).
3.6. Radial dependence of the orientation parameters
The variation of the LMC disk parameters (i and θ ) as a function of radius (using the data in different circular and annular regions) is shown in Fig. 2. Eight annular regions from 2° − 11° radius from the LMC centre are defined. The first seven annular regions have a width of 1° and the last annular region has a width of 2° to have enough sub-regions in the annular region to obtain a reliable estimate of the disk parameters. The sub-regions enclosed in the circular region corresponding to the outer radius of each annulus are used to estimate the disk parameters corresponding to each circular region. The figure shows that i and θ have a strong radial dependence as observed in earlier studies (van der Marel & Cioni 2001; Choi et al. 2018). In the case of measurements based on the sub-regions enclosed in a circular area, i decreases from the centre to the outer 4° radius and then remains almost constant. On the other hand, θ remains nearly constant from the inner to the outer region. In the case of measurements based on fit using sub-regions in different annuli, i shows a similar trend as that of measurements based on circular region till ∼4°. Then i increases from  at 5° radius to 27
 3 at 8° and then shows a steep decrease as we move towards the outskirts. A difference in the inclination for the inner and outer disk could be due to the presence of bar in the inner region. This indicates that the bar has a higher inclination than the disk. The value of θ shows a steep decrease from 163
 1 at 5° radius to 150° at 8° and steep increase beyond 8°, reaching up to a value of ∼172° at 11° radius. The sudden variation of i and θ at 8–9° annular region can be considered as a real variation, since the same variation is seen in the analysis of smaller sub-regions (Sect. 5.1). The variation indicates that the outer LMC disk is disturbed and might be due to interactions. Although a similarly strong radial dependence of the disk parameters has been observed in previous studies (Choi et al. 2018, 2022), the trends are not exactly the same. This could be due to differences in the spatial coverage of the data, especially in the outer LMC. The effect of the size of the sub-region, and hence the number of sub-regions in each annular region, on the radial variation is discussed in Sect. 5.1.
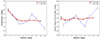 |
Fig. 2. Radial dependence of the measured inclination (left) and position angle of the line of nodes (right). The red solid line shows the variation of parameters with each circular radius and the blue dash-dot line corresponds to the variations with each annular radius. The black and grey vertical lines represent the error bars associated with each point. |
4. Possibility of an asymmetric U-shaped stellar warp in the LMC outer disk
To identify the extra-planar features, the distance to each sub-region is plotted (top left panel of Fig. 3) as a function of the axis of maximum distance gradient (axis perpendicular to the line of nodes). The LMC disk is inclined with respect to the sky plane in such a way that the NE part is closer to us and the SW part is away from the observer. The red solid line in Fig. 3 shows the median offset of the sub-regions from the best-fit plane, denoted as red dashed line. It shows that some regions of the LMC disk are deviant from the plane. In this study, we are mainly interested in the outer regions of the LMC disk. As the inner bar region is found to have a different inclination than the outer disk, we excluded the sub-regions in the central 3° radius region and looked for extra-planar features. The bottom left panel of Fig. 3 is the same as that of the top-left panel of Fig. 3, but excluding the sub-regions in the central 3° radius region. The outer regions clearly show deviations from the best-fit plane. Both the NE and the SW parts of the outer LMC disk are warped away from the observer.
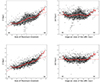 |
Fig. 3. 3D RC distribution along the maximum line-of-sight depth gradient, which is perpendicular to the line of nodes (left panels). A positive Z value denotes closer to the observer and a negative value says farther away from the observer (NE is closer and SW farther away from us). Right panels are the edge-on-view of the LMC, where the Y-axis is the distance from the galactic disk plane. In both the panels, the red dashed line denotes the LMC disk plane and the red solid line traces the median offset from the plane. Bottom panel: are the same as the top panel plots, but excluding the sub-regions in the central 3° radius. |
The right panels of Fig. 3 show the edge-on view of the LMC disk, where the Y-axis is the distance of the sub-region from the best-fit plane (a positive value denotes closer to the observer and negative values mean away from the observer). The figures show a new warp in the unexplored NE part of the LMC outer disk. The disk starts deviating away from the LMC best-fit plane at about ∼5.0 kpc from the centre. The amplitude of the deviation from the best-fit disk plane (as shown by the median offset line in red) is ∼1.2 kpc. The figure also shows the SW warp (first identified by Choi et al. 2018) which is warped in a direction away from us and extends to ∼2.4 kpc away from the best-fit plane, which is lower in amplitude than the findings by (Choi et al. 2018). From Fig. 3, we can see that both the SW and the NE warps start from ∼5.0 kpc on either side of the centre and the SW is observed till ∼9.5 kpc from the centre, whereas the NE warp is seen only till ∼7.0 kpc from the centre. The NE and the SW warps, together, suggest a probable asymmetric U-shaped warp in the outer LMC disk.
The decrease in the amplitude of the SW warp identified in our study compared to that found by Choi et al. (2018) could be due to multiple factors. One reason could be the difference in the best-fit (i, θ) values between our study and Choi et al. (2018), which can result in different edge-on view and make the appearance of the stellar warp different. Furthermore, unless the NE and SW warps are perfectly symmetric, a particular edge-on view does not guarantee to show the maximum amplitudes of both warps at the same time. As suggested by Choi et al. (2018) and the references therein, the structural parameters of the LMC disk are highly dependent on the spatial coverage of the data used in the analysis. In the present study we use the data from Gaia, which covers the entire LMC disk and, hence, the parameters obtained from this analysis provide a better representation of the LMC disk than in previous studies. The difference in terms of the completeness of the two data sets can also contribute to the observed difference, with SMASH survey being more complete than the Gaia data at RC magnitude range. However, the completeness of sources fainter than 18 mag in G band has significantly improved in the Gaia EDR3 Gaia Collaboration (2021). Another reason for the lower amplitude of the SW warp could be our choice of larger area sub-regions in the outskirts, 60 × 60 arcmin2 or more, compared to 10 × 10 arcmin2 constant area sub-regions considered by Choi et al. (2018). We chose larger sub-regions in the sparsely populated (due to the applied selection criteria; see Sect. 2) LMC outskirts to have at least 100–150 stars in the initial RC selection box. Due to the large area sub-regions used, the distances might have averaged out and also the number of data points in the outskirts decreased. The effect of size of the sub-regions and spatial resolution on the newly identified NE warp is discussed in Sect. 5.1.
5. Discussion
5.1. Effect of the size of sub-regions on the stellar warps
As described in Sect. 2, the outer regions of the LMC are binned with a larger area, 60 × 60 and 120 × 120 arcmin2. Hence, we have a lower number of sub-regions in the region where the stellar warps are identified. To include more sub-regions in our analysis, we binned the entire 11 deg with a bin size of 15 × 15 arcmin2 and considered only those sub-regions which have at least 25 stars in the redefined RC selection box. A minimum number of 25 stars in the re-defined RC selection box provides detection of probable RC stars with 5σ detection. With this criteria, we could get only sub-regions up to 9 deg for further analysis. We performed the same steps and analysis as described in Sect. 3 to obtain the structural parameters of the LMC disk and to understand the radial dependence of the parameters. We obtained very similar parameters as given in Sect. 3.5,  , and radial dependence as in Fig. 2.
To identify the warps, we plotted the distance to each sub-region as a function of the axis of the maximum gradient in Fig. 4. The top panel of Fig. 4 shows the entire 9 deg circular region of the LMC from the photometric centre with each point representing a sub-region of 15 × 15 arcmin2. The bottom panel is the same as the top panel, excluding the central 3° region of the LMC, containing the bar. The warps in the SW and NE regions are clearly identified as in the top-left and bottom-left panels of Fig. 3. As in Fig. 3, the NE and the SW warps have an amplitude of ∼1.2 kpc and 2.5 kpc, respectively, above the plane and away from the observer. These values are very similar to those obtained in Sect. 4, from the analysis of sub-regions with different sizes. This result suggests that the size of the sub-region does not significantly affect the estimation of the structural parameters and extra-planar features of the LMC disk. However, we note that there is large scatter in Fig. 4 compared to Fig. 3 and that could be due to the presence of larger number of sub-regions with a smaller size.
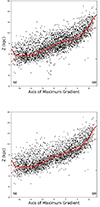 |
Fig. 4. 3D RC distribution along the maximum line-of-sight depth gradient, which is perpendicular to the line of nodes. A positive Z value denotes closer to the observer and a negative value says farther away from the observer (NE is closer and SW farther away from us). Same as the left panels of Fig. 3, but all of the LMC sub-regions are binned with a bin size of 15 × 15 arcmin2. In the bottom panel, the sub-regions in the central 3° radius are excluded. |
5.2. Stellar population effects on intrinsic RC magnitude
In our analysis, we assumed a constant intrinsic RC magnitude across the LMC disk. We note that the intrinsic magnitude of RC stars can vary as a function of age and metallicity (Girardi 2016) and, hence, it can vary across the LMC disk. Here, we discuss the effect of population effects on our estimated parameters and the nature of the outer warp. Choi et al. (2018) obtained the radial profiles (between 2 7 and 8
 5 from the LMC centre) of the intrinsic colour and magnitude of the RC stars in the LMC. These authors calculated the model predicted RC magnitudes for a given age and metallicity for three radial bins: 2
 7–4°, 4°–7°, and 7°–8
 5, between 2
 7 and 8
 5. The age and metallicity corresponding to each radial bin was adopted based on the reported metallicity gradient and age–metallicity relation for the LMC disk (Carrera et al. 2008, 2011; Piatti & Geisler 2013; Pieres et al. 2016). The adopted metallicity ([Fe/H]) for the three radial bins were −0.5, −0.7, and −0.8. Corresponding ages were 1.6 Gyr, 5.6 Gyr, and 6.3 Gyr, respectively.
We computed the mean absolute G band magnitude of core He-burning stars in these three radial bins using PARSEC isochrones of the corresponding age and metallicity given above, and using Eqs. (3) and (4) from Girardi & Salaris (2001). The computed absolute RC magnitude values in the G band for the radial bins, 2 7–4°, 4°–7°, and 7°–8
 5 are 18.668, 18.696, and 18.693 mag, respectively. The magnitude in the radial bin 2
 7–4° is found to be 0.028 mag brighter than the value in 4°–7° bin. The computed RC magnitudes for the radial bins 4°–7° and 7°–8
 5 are very similar. The same behaviour was found by Choi et al. (2018) for RC magnitudes in i band. We adopted a gradient of 0.021 mag deg−1 between 2
 7 and 4° intrinsic RC magnitude and a constant value between 4° and 8
 5. For regions inner to 2
 7 radius and outer to 8
 5 radius, we adopted the absolute RC magnitude at 2
 7 and 8
 5, respectively. Using the above radial variation for the intrinsic RC magnitude in our analysis, we obtained the inclination and position angle of line of nodes as 23
 and 159
 respectively. The variation of line of sight distance of different sub-regions across the axis of maximum gradient and the edge-on view of the LMC are shown in Fig. 5. The plots are same as in Fig. 3, but including the radial variation in the intrinsic RC magnitude due to population effects. The structural parameters and the amplitude of the warps in the NE and SW are very similar to that obtained when the constant intrinsic RC magnitude is used. As observed in Fig. 3, the NE warp is better seen when the sub-regions in the inner 3 deg radius are excluded from the analysis.
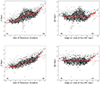 |
Fig. 5. 3D RC distribution along the maximum line-of-sight depth gradient, which is perpendicular to the line of nodes. A positive Z value denotes closer to the observer and a negative value says farther away from the observer (NE is closer and SW farther away from us). Same as Fig. 3, but including the radial variation of the intrinsic RC magnitude as discussed in Choi et al. (2018). |
As Choi et al. (2018) could not find the complete radial profile of the intrinsic RC magnitude (inside of 2 7 and outside of 8
 5 radius), these authors included a gradient for the intrinsic RC magnitude outside 8
 5 radius to understand the effect of a lower metallicity and older age RC (considering a [Fe/H] value of −0.9 and an age of 10 Gyr at 10
 5 radius) population in the outskirts compared to the 7°–8
 5 bin. We computed the absolute G band magnitude corresponding to a [Fe/H] value of −0.9 and an age of 10 Gyr and found it to be 18.798 mag. Including a magnitude gradient of 0.053 mag deg−1 in the 8
 5–10
5–10 5 radial bin did not change the structural parameters and the overall U-shape of the outer warp remains the same.
In nutshell, the above analysis shows that our results on the presence of warp in the NE with a lower amplitude compared to the SW warp and the overall U-shape of the outer LMC warp are not affected significantly by the variation of the intrinsic RC magnitude across the LMC. A recent study by Mazzi et al. (2021) on the spatially resolved star formation history of the LMC disk using data from VISTA Survey of the Magellanic Clouds (VMC) Cioni et al. (2011), provides a 2D map of the residual of the best-fit plane (left panel of their Fig. 13). They consider stars in many other evolutionary stages in their analysis and also their method naturally takes into account the intrinsic variations in the RC absolute magnitude as a function of population age and metallicity. Though the spatial coverage of the VMC is less compared to our study, their figure clearly shows that the outer NE regions are behind the best-fit plane which is consistent with our results. In future, spectroscopic studies of RC stars in the location of the suggested warps will provide more understanding of the effect of stellar population effects on the global shape of the LMC outer warp.
5.3. Origin of the LMC outer stellar warp
Comparing with the modified version of the edge-on view of the LMC stellar density map from the simulations by Besla et al. (2012; Fig. 15 in Choi et al. 2018); Choi et al. (2018) suggested that the observed SW outer warp matches with the simulations. As the SW warp is in the direction towards the SMC, they suggested that the warp might have formed due to the direct collision of the LMC and SMC in the recent past. The simulation plot shows a warp in the NE disk, but in a direction towards the observer and with a lower amplitude. Thus an “integral” shaped (S-type) asymmetric warp was expected in the NE outer disk of the LMC. The NE warp has a lower amplitude than the SW warp. But in contrary to what is expected, we find a warp in the NE LMC disk which is also bent in the same direction as that of its counterpart in the SW, forming a “U-shaped” asymmetric warp.
U-shaped warps are formed mainly due to the super-positions of two or more non-symmetric S-shaped warps (Saha & Jog 2006). They are caused by multiple fly-bys with different incident angles (Kim et al. 2014). The observed U-shaped warp in the outer LMC disk could have formed due to the multiple interactions between the LMC and the SMC. In the simulations by Besla et al. (2012), the SMC is placed on an eccentric orbit (eccentricity of 0.7) about the LMC and higher orbital eccentricities for the SMC result in fly-by encounters between the MCs. However, this simulation does not show a deviation away from the observer in the NE and instead shows a mild deviation towards the observer. Considering the top-right panel of Fig. 3, we see that the median offset line first deviates in the direction towards the observer and then turns away from the observer. Thus, the NE warp launches from below the best-fit plane. This could be the effect of the inclusion of the bar with a different inclination in the estimation of disk structural parameters. In the bottom-right panel of Fig. 3, where the sub-regions in the inner 3° are removed, the NE warp is better seen and it launches from the best-fit plane. Thus the presence of bar maybe hiding the real shape of the LMC disk. Besla et al. (2012) also indicates that the simulations are not able to fully reproduce all the observed properties of the Magellanic System. As multiple interactions with proper incident angles are required to form U-shaped warps, only a minority of the warps observed are U-shaped warps than the frequently observed S-shaped warps. Thus the observed U-shaped asymmetric warp in the outer LMC disk provides an observational constraint to the theoretical models of the Magellanic system which tries to understand the LMC-SMC interaction history. We note that other mechanisms like instabilities due to spiral arms can also trigger warp formation. The locations of the warps and the spiral arm of the LMC are shown in Fig. 6 for reference.
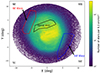 |
Fig. 6. Cartesian plot with the sources from the Early Data Release 3 (EDR3) for an area of ∼380 deg2 of the LMC. The colour bar from blue to yellow represents the increase in stellar density (number of stars per bin of size 8.3 arcmin2, in units of arcmin−2). The X and Y are defined as in van der Marel & Cioni (2001) with origin as LMC’s photometric centre ( |

6. Summary
Warps are vertical distortions of stellar or gaseous disks of galaxies that are most prominent in less massive galaxies. One of the proposed scenarios for the formation of warps involves tidal interactions among galaxies. In this context, we study the structure of the nearest interacting low-mass disk galaxy, the LMC. A recent study by Choi et al. (2018) identified a stellar warp in the outer regions of the SW disk of the LMC. However, due to the limited spatial coverage of the data, these authors could not investigate the counterpart of this warp in the NE region, which is essential to understanding the global shape, nature, and origin of the outer LMC warp. In this study, we used the photometric data from Gaia EDR3, which covers the entire Magellanic System and we analysed the data of RC stars in the ∼380 deg2 of the LMC. The Gaia EDR3 data cover the entire LMC disk, including the very outskirts of the galaxy. The entire data were binned into a total of 3626 sub-regions having enough stellar density to visually identify the RC stars. The extinction corrected peak RC magnitude were used to estimate the orientation parameters of the LMC disk plane. For the 11° radial region the LMC disk, the inclination (i), and position angle of the line of nodes (θ) are found to be,  , and
, and  and our results are consistent with the previously estimated values. For the first time, we detected a warp in the NE outer disk of the LMC with an amplitude ∼1.2 kpc in a direction away from us. We also detected the warp identified by Choi et al. (2018) in the SW part. Both warps are bent in the same direction, suggesting an asymmetric U-shaped warp. Our result provides an observational constraint to the theoretical models of the Magellanic system, which are aimed at attaining an understanding of the LMC-SMC1 interaction history.
Acknowledgments
Saroon S acknowledges support from the Indian Institute of Astrophysics through the Visiting Students Programme. Smitha Subramanian acknowledges support from the Science and Engineering Research Board of India through a Ramanujan Fellowship. This work has made use of data from the European Space Agency (ESA) space mission Gaia (https://www.cosmos.esa.int/gaia). Gaia data are being processed by the Gaia Data Processing and Analysis Consortium (DPAC). Funding for the DPAC is provided by national institutions, in particular the institutions participating in the Gaia MultiLateral Agreement (MLA). This research made use of numpy (van der Walt et al. 2011), scipy (Virtanen et al. 2020), matplotlib (Hunter 2007), lmfit (Newville et al. 2016), kmpfit (Terlouw & Vogelaar 2015) and astropy, a community-developed core Python package for Astronomy (Astropy Collaboration 2013, 2018). Finally, it is a pleasure to thank the referee for a constructive report.
References
- Ann, H. B., & Park, J. C. 2006, New Astron., 11, 293 [NASA ADS] [CrossRef] [Google Scholar]
- Astropy Collaboration (Robitaille, T. P., et al.) 2013, A&A, 558, A33 [NASA ADS] [CrossRef] [EDP Sciences] [Google Scholar]
- Astropy Collaboration (Price-Whelan, A. M., et al.) 2018, AJ, 156, 123 [Google Scholar]
- Balbinot, E., Santiago, B. X., Girardi, L., et al. 2015, MNRAS, 449, 1129 [CrossRef] [Google Scholar]
- Besla, G., Kallivayalil, N., Hernquist, L., et al. 2012, MNRAS, 421, 2109 [Google Scholar]
- Bosma, A. 1978, PhD Thesis, University of Groningen [Google Scholar]
- Burke, B. F. 1957, AJ, 62, 90 [Google Scholar]
- Cardelli, J. A., Clayton, G. C., & Mathis, J. S. 1989, ApJ, 345, 245 [Google Scholar]
- Carrera, R., Gallart, C., Aparicio, A., et al. 2008, Proc. Int. Astron. Union, 4, 275 [CrossRef] [Google Scholar]
- Carrera, R., Gallart, C., Aparicio, A., & Hardy, E. 2011, AJ, 142, 61 [Google Scholar]
- Chen, B., Huang, Y., Yuan, H., et al. 2019, MNRAS, 483, 4277 [NASA ADS] [CrossRef] [Google Scholar]
- Chen, X., Wang, S., Deng, L., et al. 2019, Nat. Astron., 3, 320 [NASA ADS] [CrossRef] [Google Scholar]
- Choi, Y., Nidever, D. L., Olsen, K., et al. 2018, ApJ, 866, 90 [Google Scholar]
- Choi, Y., Olsen, K. A. G., Besla, G., et al. 2022, ApJ, 927, 153 [NASA ADS] [CrossRef] [Google Scholar]
- Cioni, M. R. L., Clementini, G., Girardi, L., et al. 2011, A&A, 527, A116 [CrossRef] [EDP Sciences] [Google Scholar]
- de Grijs, R., Wicker, J. E., & Bono, G. 2014, AJ, 147, 122 [Google Scholar]
- Debattista, V. P., & Sellwood, J. A. 1999, ApJ, 513, L107 [NASA ADS] [CrossRef] [Google Scholar]
- Gaia Collaboration (Brown, A. G. A., et al.) 2021, A&A, 649, A1 [NASA ADS] [CrossRef] [EDP Sciences] [Google Scholar]
- García-Ruiz, I., Sancisi, R., & Kuijken, K. 2002, A&A, 394, 769 [NASA ADS] [CrossRef] [EDP Sciences] [Google Scholar]
- Girardi, L. 2016, ARA&A, 54, 95 [Google Scholar]
- Girardi, L., & Salaris, M. 2001, MNRAS, 323, 109 [Google Scholar]
- Górski, M., Zgirski, B., Pietrzyński, G., et al. 2020, ApJ, 889, 179 [Google Scholar]
- Hunter, J. D. 2007, Comput. Sci. Eng., 9, 90 [NASA ADS] [CrossRef] [Google Scholar]
- Inno, L., Bono, G., Matsunaga, N., et al. 2016, ApJ, 832, 176 [Google Scholar]
- Jiang, I.-G., & Binney, J. 1999, MNRAS, 303, L7 [NASA ADS] [CrossRef] [Google Scholar]
- Kerr, F. J. 1957, AJ, 62, 93 [NASA ADS] [CrossRef] [Google Scholar]
- Kim, J. H., Peirani, S., Kim, S., et al. 2014, ApJ, 789, 90 [NASA ADS] [CrossRef] [Google Scholar]
- Koerwer, J. F. 2009, AJ, 138, 1 [NASA ADS] [CrossRef] [Google Scholar]
- Kollatschny, W., & Dietrich, M. 1990, A&A, 233, 333 [NASA ADS] [Google Scholar]
- Mazzi, A., Girardi, L., Zaggia, S., et al. 2021, MNRAS, 508, 245 [NASA ADS] [CrossRef] [Google Scholar]
- Newville, M., Stensitzki, T., Allen, D. B., et al. 2016, Astrophysics Source Code Library [record ascl:1606.014] [Google Scholar]
- Nidever, D. L., Olsen, K., Walker, A. R., et al. 2017, AJ, 154, 199 [Google Scholar]
- Nikolaev, S., Drake, A. J., Keller, S. C., et al. 2004, ApJ, 601, 260 [NASA ADS] [CrossRef] [Google Scholar]
- Olsen, K. A. G., & Salyk, C. 2002, AJ, 124, 2045 [NASA ADS] [CrossRef] [Google Scholar]
- Ostriker, E. C., & Binney, J. J. 1989, MNRAS, 237, 785 [NASA ADS] [CrossRef] [Google Scholar]
- Piatti, A. E., & Geisler, D. 2013, AJ, 145, 17 [Google Scholar]
- Pieres, A., Santiago, B., Balbinot, E., et al. 2016, MNRAS, 461, 519 [NASA ADS] [CrossRef] [Google Scholar]
- Pietrzyński, G., Graczyk, D., Gallenne, A., et al. 2019, Nature, 567, 200 [Google Scholar]
- Reshetnikov, V., & Combes, F. 1998, A&A, 337, 9 [NASA ADS] [Google Scholar]
- Riello, M., De Angeli, F., Evans, D. W., et al. 2021, A&A, 649, A3 [NASA ADS] [CrossRef] [EDP Sciences] [Google Scholar]
- Romero-Gómez, M., Mateu, C., Aguilar, L., Figueras, F., & Castro-Ginard, A. 2019, A&A, 627, A150 [NASA ADS] [CrossRef] [EDP Sciences] [Google Scholar]
- Saha, K., & Jog, C. J. 2006, A&A, 446, 897 [NASA ADS] [CrossRef] [EDP Sciences] [Google Scholar]
- Sánchez-Saavedra, M. L., Battaner, E., & Florido, E. 1990, MNRAS, 246, 458 [Google Scholar]
- Sánchez-Saavedra, M. L., Battaner, E., Guijarro, A., López-Corredoira, M., & Castro-Rodríguez, N. 2003, A&A, 399, 457 [NASA ADS] [CrossRef] [EDP Sciences] [Google Scholar]
- Sancisi, R. 1976, A&A, 53, 159 [NASA ADS] [Google Scholar]
- Sandage, A., & Humphreys, R. M. 1980, ApJ, 236, L1 [NASA ADS] [CrossRef] [Google Scholar]
- Sasaki, T. 1987, PASJ, 39, 849 [NASA ADS] [Google Scholar]
- Schlafly, E. F., & Finkbeiner, D. P. 2011, ApJ, 737, 103 [Google Scholar]
- Schlegel, D. J., Finkbeiner, D. P., & Davis, M. 1998, ApJ, 500, 525 [Google Scholar]
- Schönrich, R., & Dehnen, W. 2018, MNRAS, 478, 3809 [Google Scholar]
- Schwarzkopf, U., & Dettmar, R. J. 2001, A&A, 373, 402 [NASA ADS] [CrossRef] [EDP Sciences] [Google Scholar]
- Shen, J., & Sellwood, J. A. 2006, MNRAS, 370, 2 [NASA ADS] [CrossRef] [Google Scholar]
- Skowron, D. M., Skowron, J., Mróz, P., et al. 2019, Science, 365, 478 [Google Scholar]
- Skowron, D. M., Skowron, J., Udalski, A., et al. 2021, ApJS, 252, 23 [Google Scholar]
- Subramaniam, A. 2003, ApJ, 598, L19 [NASA ADS] [CrossRef] [Google Scholar]
- Subramanian, S., & Subramaniam, A. 2010, A&A, 520, A24 [NASA ADS] [CrossRef] [EDP Sciences] [Google Scholar]
- Subramanian, S., & Subramaniam, A. 2013, A&A, 552, A144 [NASA ADS] [CrossRef] [EDP Sciences] [Google Scholar]
- Subramanian, S., Marengo, M., Bhardwaj, A., et al. 2017, Space Sci. Rev., 212, 1817 [NASA ADS] [CrossRef] [Google Scholar]
- Terlouw, J. P., & Vogelaar, M. G. R. 2015, Kapteyn Package, version 2.3b6 (Groningen: Kapteyn Astronomical Institute), http://www.astro.rug.nl/software/kapteyn/ [Google Scholar]
- van der Kruit, P. C. 1979, A&AS, 38, 15 [NASA ADS] [Google Scholar]
- van der Kruit, P. C., & Searle, L. 1981, A&A, 95, 105 [NASA ADS] [Google Scholar]
- van der Marel, R. P., & Cioni, M.-R. L. 2001, AJ, 122, 1807 [Google Scholar]
- van der Marel, R. P., & Kallivayalil, N. 2014, ApJ, 781, 121 [Google Scholar]
- van der Walt, S., Colbert, S. C., & Varoquaux, G. 2011, Comput. Sci. Eng., 13, 22 [Google Scholar]
- Vesperini, E., & Weinberg, M. D. 2000, ApJ, 534, 598 [NASA ADS] [CrossRef] [Google Scholar]
- Virtanen, P., Gommers, R., Oliphant, T. E., et al. 2020, Nat. Methods, 17, 261 [Google Scholar]
All Figures
|
Fig. 1. Spatial distribution of the LMC sources, the sub-regions analysed and the Hess diagram representing the stellar density in the observed CMD of an outer sub-region are shown. Left-hand panel: Cartesian plot with the sources from the Early Data Release 3 (EDR3) for an area of ∼380 deg2 of the LMC. The colour bar from blue to yellow represents the increase in stellar density (number of stars per bin of size 8.3 arcmin2, in units of arcmin−2) Middle panel: binning of the analysed LMC region into sub-regions based on the stellar number density. The X and Y are defined as in van der Marel & Cioni (2001) with origin as LMC’s photometric centre ( |
| In the text | |
|
Fig. 2. Radial dependence of the measured inclination (left) and position angle of the line of nodes (right). The red solid line shows the variation of parameters with each circular radius and the blue dash-dot line corresponds to the variations with each annular radius. The black and grey vertical lines represent the error bars associated with each point. |
| In the text | |
|
Fig. 3. 3D RC distribution along the maximum line-of-sight depth gradient, which is perpendicular to the line of nodes (left panels). A positive Z value denotes closer to the observer and a negative value says farther away from the observer (NE is closer and SW farther away from us). Right panels are the edge-on-view of the LMC, where the Y-axis is the distance from the galactic disk plane. In both the panels, the red dashed line denotes the LMC disk plane and the red solid line traces the median offset from the plane. Bottom panel: are the same as the top panel plots, but excluding the sub-regions in the central 3° radius. |
| In the text | |
|
Fig. 4. 3D RC distribution along the maximum line-of-sight depth gradient, which is perpendicular to the line of nodes. A positive Z value denotes closer to the observer and a negative value says farther away from the observer (NE is closer and SW farther away from us). Same as the left panels of Fig. 3, but all of the LMC sub-regions are binned with a bin size of 15 × 15 arcmin2. In the bottom panel, the sub-regions in the central 3° radius are excluded. |
| In the text | |
|
Fig. 5. 3D RC distribution along the maximum line-of-sight depth gradient, which is perpendicular to the line of nodes. A positive Z value denotes closer to the observer and a negative value says farther away from the observer (NE is closer and SW farther away from us). Same as Fig. 3, but including the radial variation of the intrinsic RC magnitude as discussed in Choi et al. (2018). |
| In the text | |
|
Fig. 6. Cartesian plot with the sources from the Early Data Release 3 (EDR3) for an area of ∼380 deg2 of the LMC. The colour bar from blue to yellow represents the increase in stellar density (number of stars per bin of size 8.3 arcmin2, in units of arcmin−2). The X and Y are defined as in van der Marel & Cioni (2001) with origin as LMC’s photometric centre ( |
| In the text | |
Current usage metrics show cumulative count of Article Views (full-text article views including HTML views, PDF and ePub downloads, according to the available data) and Abstracts Views on Vision4Press platform.
Data correspond to usage on the plateform after 2015. The current usage metrics is available 48-96 hours after online publication and is updated daily on week days.
Initial download of the metrics may take a while.