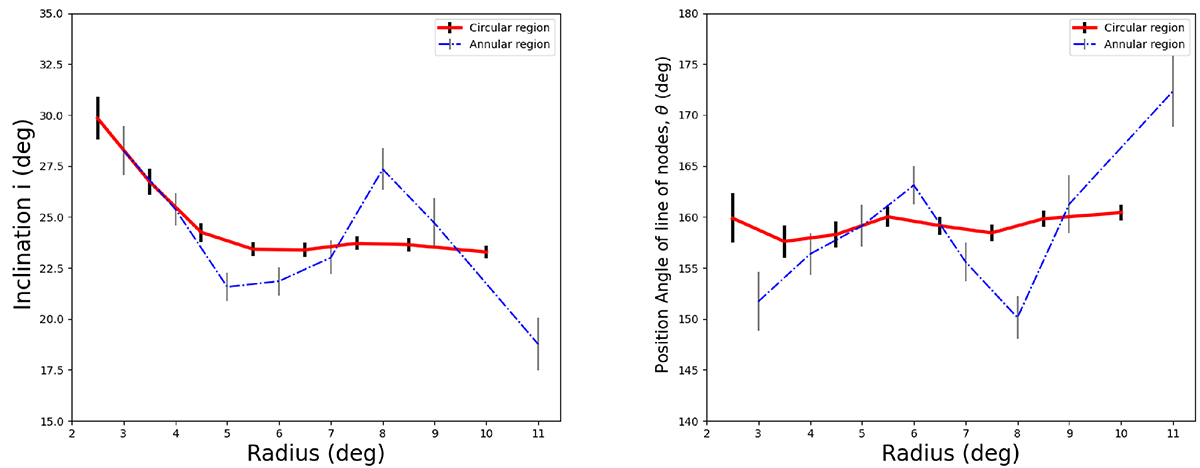
Fig. 2.
Download original image
Radial dependence of the measured inclination (left) and position angle of the line of nodes (right). The red solid line shows the variation of parameters with each circular radius and the blue dash-dot line corresponds to the variations with each annular radius. The black and grey vertical lines represent the error bars associated with each point.
Current usage metrics show cumulative count of Article Views (full-text article views including HTML views, PDF and ePub downloads, according to the available data) and Abstracts Views on Vision4Press platform.
Data correspond to usage on the plateform after 2015. The current usage metrics is available 48-96 hours after online publication and is updated daily on week days.
Initial download of the metrics may take a while.