Fig. 6.
Download original image
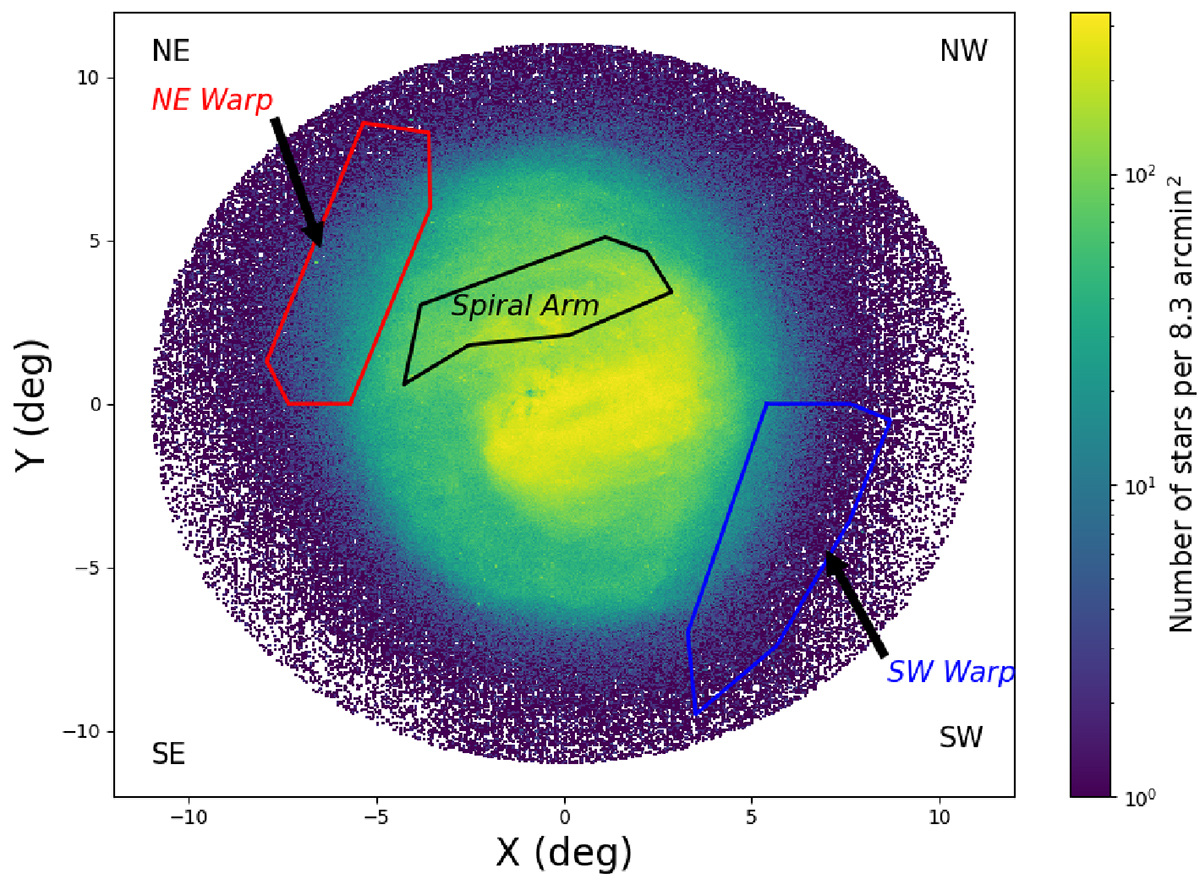
Cartesian plot with the sources from the Early Data Release 3 (EDR3) for an area of ∼380 deg2 of the LMC. The colour bar from blue to yellow represents the increase in stellar density (number of stars per bin of size 8.3 arcmin2, in units of arcmin−2). The X and Y are defined as in van der Marel & Cioni (2001) with origin as LMC’s photometric centre (![]() ); van der Marel & Kallivayalil (2014). The east and north are towards left and up, respectively. The approximate locations of the spiral arm (black), north-eastern warp (red), and south-western warp (blue) marked.
); van der Marel & Kallivayalil (2014). The east and north are towards left and up, respectively. The approximate locations of the spiral arm (black), north-eastern warp (red), and south-western warp (blue) marked.
Current usage metrics show cumulative count of Article Views (full-text article views including HTML views, PDF and ePub downloads, according to the available data) and Abstracts Views on Vision4Press platform.
Data correspond to usage on the plateform after 2015. The current usage metrics is available 48-96 hours after online publication and is updated daily on week days.
Initial download of the metrics may take a while.