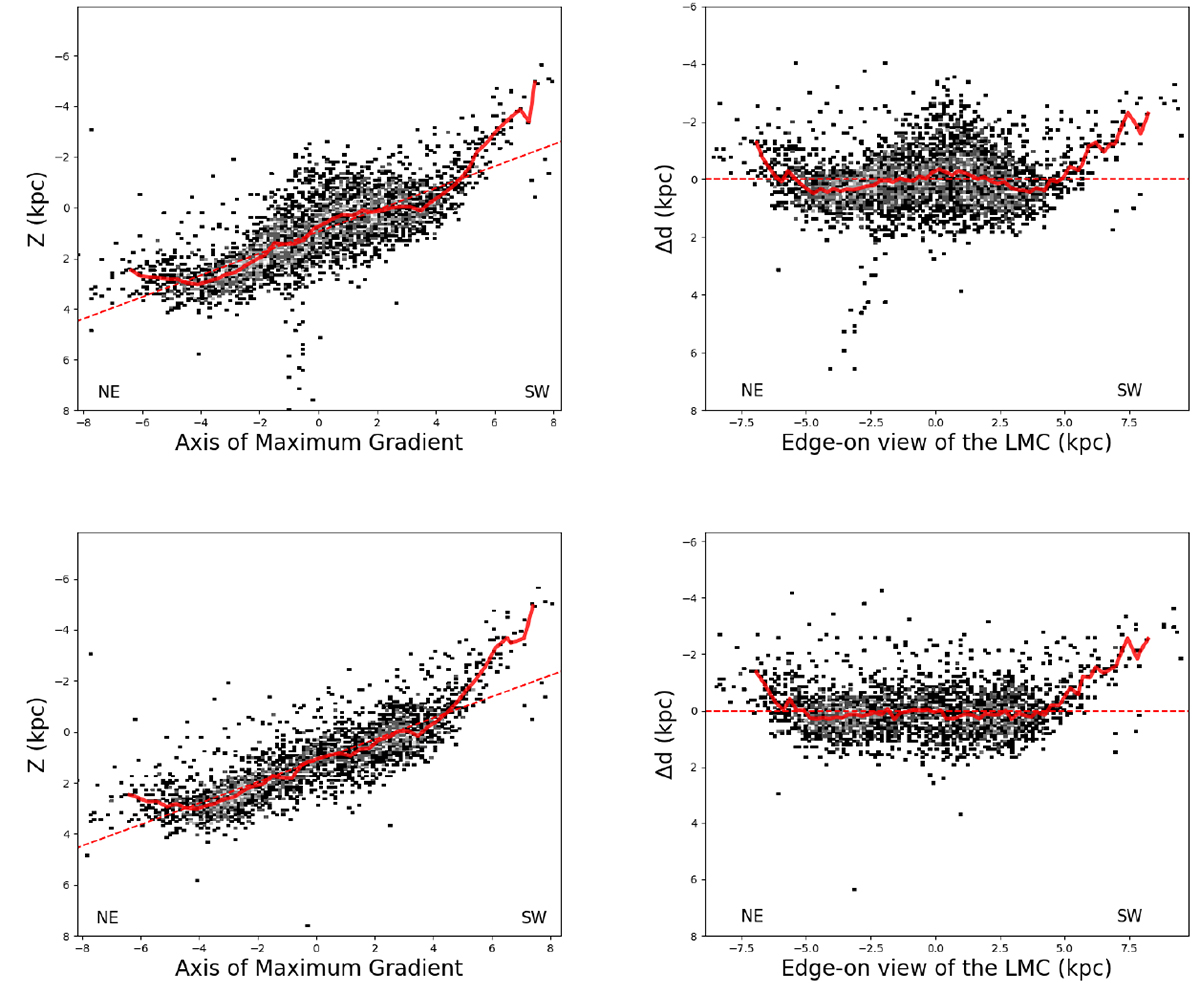
Fig. 3.
Download original image
3D RC distribution along the maximum line-of-sight depth gradient, which is perpendicular to the line of nodes (left panels). A positive Z value denotes closer to the observer and a negative value says farther away from the observer (NE is closer and SW farther away from us). Right panels are the edge-on-view of the LMC, where the Y-axis is the distance from the galactic disk plane. In both the panels, the red dashed line denotes the LMC disk plane and the red solid line traces the median offset from the plane. Bottom panel: are the same as the top panel plots, but excluding the sub-regions in the central 3° radius.
Current usage metrics show cumulative count of Article Views (full-text article views including HTML views, PDF and ePub downloads, according to the available data) and Abstracts Views on Vision4Press platform.
Data correspond to usage on the plateform after 2015. The current usage metrics is available 48-96 hours after online publication and is updated daily on week days.
Initial download of the metrics may take a while.