Fig. 1.
Download original image
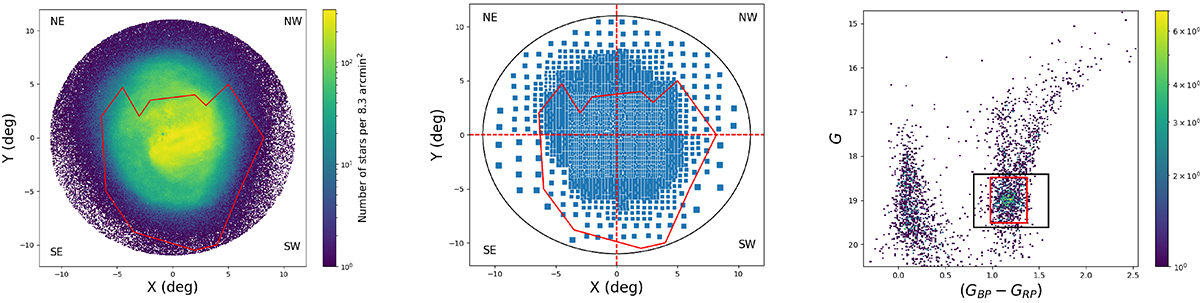
Spatial distribution of the LMC sources, the sub-regions analysed and the Hess diagram representing the stellar density in the observed CMD of an outer sub-region are shown. Left-hand panel: Cartesian plot with the sources from the Early Data Release 3 (EDR3) for an area of ∼380 deg2 of the LMC. The colour bar from blue to yellow represents the increase in stellar density (number of stars per bin of size 8.3 arcmin2, in units of arcmin−2) Middle panel: binning of the analysed LMC region into sub-regions based on the stellar number density. The X and Y are defined as in van der Marel & Cioni (2001) with origin as LMC’s photometric centre (![]() ); van der Marel & Kallivayalil (2014). The east and north are towards left and up, respectively. The red dashed lines show the division of NE, NW, SE, and SW sub-regions. The blue squares show each sub-region represented by their central coordinates and the size of the square illustrates the increase in bin-size with the drop in stellar number density as we move towards the outskirts of the LMC disk. The outline of the region studied by Choi et al. (2018) is shown by the red polygon in the left and middle panels. Right-hand panel: HESS diagram representing the stellar density in the observed CMD of Gaia EDR3 sources enclosed in one of the outer sub-regions. The black rectangular box shows the initial RC selection box and the red rectangular box is the redefined RC region.
); van der Marel & Kallivayalil (2014). The east and north are towards left and up, respectively. The red dashed lines show the division of NE, NW, SE, and SW sub-regions. The blue squares show each sub-region represented by their central coordinates and the size of the square illustrates the increase in bin-size with the drop in stellar number density as we move towards the outskirts of the LMC disk. The outline of the region studied by Choi et al. (2018) is shown by the red polygon in the left and middle panels. Right-hand panel: HESS diagram representing the stellar density in the observed CMD of Gaia EDR3 sources enclosed in one of the outer sub-regions. The black rectangular box shows the initial RC selection box and the red rectangular box is the redefined RC region.
Current usage metrics show cumulative count of Article Views (full-text article views including HTML views, PDF and ePub downloads, according to the available data) and Abstracts Views on Vision4Press platform.
Data correspond to usage on the plateform after 2015. The current usage metrics is available 48-96 hours after online publication and is updated daily on week days.
Initial download of the metrics may take a while.