Fig. 5.
Download original image
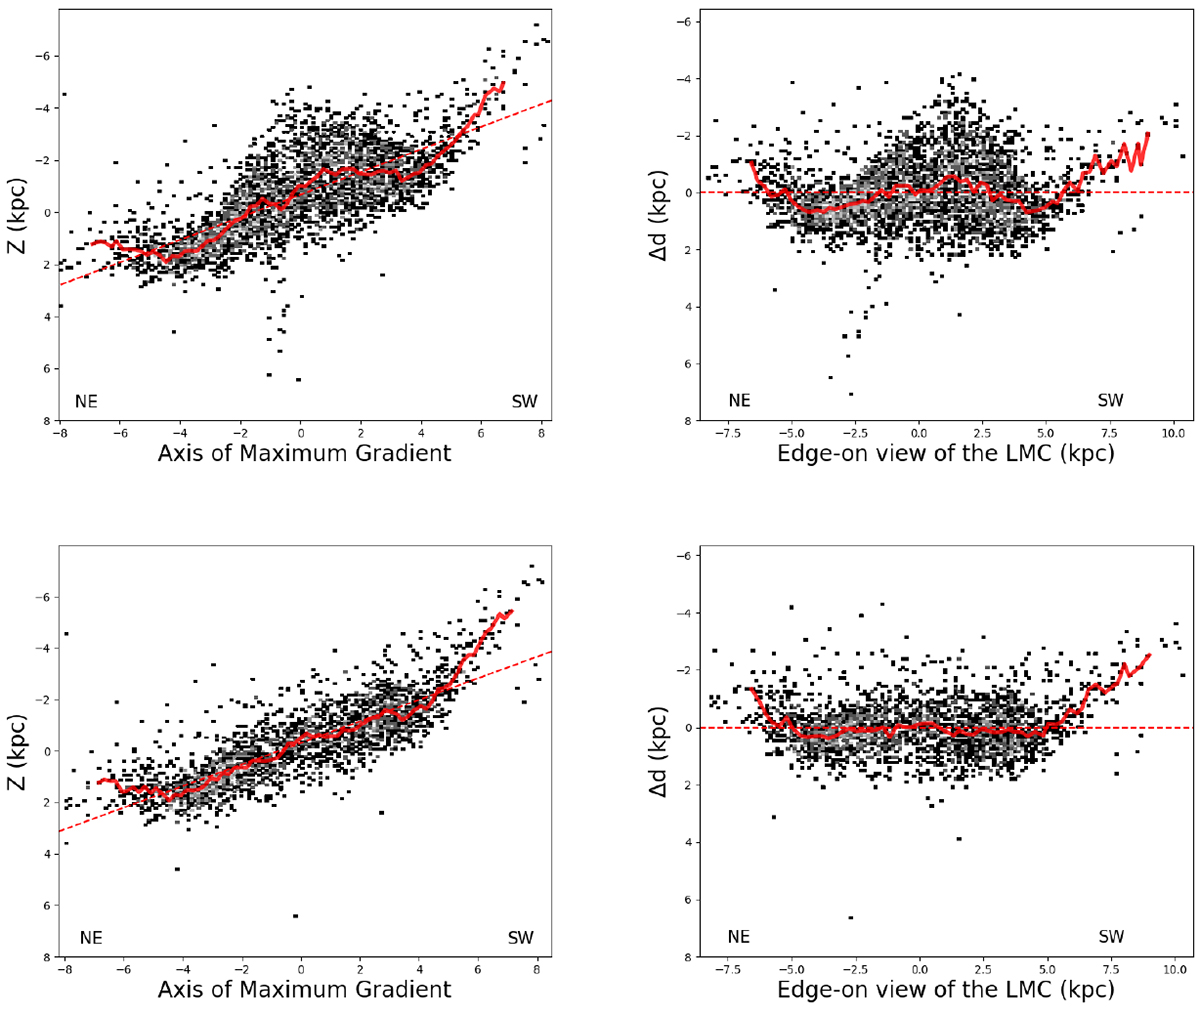
3D RC distribution along the maximum line-of-sight depth gradient, which is perpendicular to the line of nodes. A positive Z value denotes closer to the observer and a negative value says farther away from the observer (NE is closer and SW farther away from us). Same as Fig. 3, but including the radial variation of the intrinsic RC magnitude as discussed in Choi et al. (2018).
Current usage metrics show cumulative count of Article Views (full-text article views including HTML views, PDF and ePub downloads, according to the available data) and Abstracts Views on Vision4Press platform.
Data correspond to usage on the plateform after 2015. The current usage metrics is available 48-96 hours after online publication and is updated daily on week days.
Initial download of the metrics may take a while.