| Issue |
A&A
Volume 662, June 2022
|
|
|---|---|---|
| Article Number | A52 | |
| Number of page(s) | 29 | |
| Section | Interstellar and circumstellar matter | |
| DOI | https://doi.org/10.1051/0004-6361/202142936 | |
| Published online | 15 June 2022 | |
Gas phase Elemental abundances in Molecular cloudS (GEMS)
VI. A sulphur journey across star-forming regions: study of thioformaldehyde emission
1
Observatorio Astronómico Nacional (OAN),
Alfonso XII, 3,
28014
Madrid,
Spain
e-mail: g.esplugues@oan.es
2
School of Earth and Planetary Sciences, National Institute of Science Education and Research,
Jatni
752050
Odisha,
India
3
Homi Bhabha National Institute, Training School Complex,
Anushaktinagar,
Mumbai
400094,
India
4
Max-Planck-Institut für extraterrestrische Physik,
85748
Garching,
Germany
5
Laboratoire d’astrophysique de Bordeaux, Univ. Bordeaux, CNRS,
B18N, allée Geoffroy Saint-Hilaire,
33615
Pessac,
France
6
LERMA, Observatoire de Paris, PSL Research University, CNRS, Sorbonne Université,
92190
Meudon,
France
7
Center for Astrophysics – Harvard & Smithsonian,
60 Garden St.,
Cambridge,
MA
02138,
USA
8
Centro de Astrobiología, INTA-CSIC,
Torrejón de Ardoz,
28850
Madrid,
Spain
Received:
17
December
2021
Accepted:
17
March
2022
Context. In the context of the IRAM 30 m Large Program Gas phase Elemental abundances in Molecular CloudS (GEMS), we present a study of thioformaldehyde (H2CS) and its deuterated versions (HDCS and D2CS) in several starless cores located in a selected set of star-forming filaments of Taurus, Perseus, and Orion. These regions have different star formation activities and, therefore, distinct physical and chemical conditions.
Aims. Our goal is to investigate the influence of the environmental conditions on the abundances of these molecules in the cores, as well as the effect of time evolution.
Methods. We have modelled the observed lines of H2CS, HDCS, and D2CS using the radiative transfer code RADEX. We have also used the chemical code Nautilus to model the evolution of these species depending on the characteristics of the starless cores.
Results. We derive column densities and abundances for all the cores. We also derive deuterium fractionation ratios, Dfrac, which allow us to determine and compare the evolutionary stage between different parts of each star-forming region. Our results indicate that the north region of the B 213 filament in Taurus is more evolved than the south, while the north-eastern part of Perseus presents an earlier evolutionary stage than the south-western zone. Model results also show that Dfrac decreases with the cosmic-ray ionisation rate, while it increases with density and with the degree of sulphur depletion. In particular, we can only reproduce the observations when the initial sulphur depletion in the starless cores is at least one order of magnitude lower than the solar elemental sulphur abundance.
Conclusions. The progressive increase in HDCS/H2CS and D2CS/H2CS with time makes these ratios powerful tools for deriving the chemical evolutionary stage of starless cores. However, they cannot be used to derive the temperature of these regions, since both ratios present a similar evolution at two different temperature ranges (~7–11 K and ~ 15–19 K). Regarding chemistry, (deuterated) thioformaldehyde is mainly formed through gas-phase reactions (double-replacement and neutral-neutral displacement reactions), while surface chemistry plays an important role as a destruction mechanism.
Key words: astrochemistry / ISM: abundances / ISM: molecules / ISM: clouds / stars: formation
© ESO 2022
1 Introduction
Molecular clouds are known to be the birthplaces of stars. Observations of different star-forming regions at several wavelengths suggest molecular clouds have complex morphologies, with the dust and gas arranged mostly along elongated and filamentary structures (e.g., Hartmann 2002; Myers 2009). These filaments appear to be key structures that are required to reach the densities necessary for star formation according to Spitzer and Herschel observations, from sub-parsec scales in nearby star-forming regions (André et al. 2010) to tens-of-parsecs scales along spiral arms (Molinari et al. 2010). In particular, filaments are where the initial conditions for star formation are set since they funnel interstellar gas and dust into increasingly denser concentrations that will contract and fragment, leading to gravitationally bound starless cores that will eventually form stars.
Dust and gas properties are key to determining the evolution of starless cores within filaments. In dense regions, grains are covered by icy mantles, which may affect grain coagulation (e.g., Kimura et al. 2020), and the presence of a dust size distribution, which in turn influences the grain emissivity. Moreover, grain coagulation may affect the charge balance in the gas phase, hence modifying the coupling of the gas with the magnetic field. In addition, grain surface chemistry plays an important role in the formation of the molecules that are key to the chemical network (e.g. H2 and H2O) and in the freeze-out process of molecules in the cold interiors of starless cores (e.g. CO).
One way to understand the dynamics of starless cores is through the study of molecule deuteration since the deuterium fraction, Dfrac, defined as the abundance ratio between a deuterated molecule and its hydrogenated counterpart, changes with their evolution (e.g., Sakai et al. 2012). In particular, Dfrac is predicted to increase when a core evolves towards the onset of gravitational collapse as the core density profile becomes more and more centrally peaked (Crapsi et al. 2005). Then, Dfrac drops when the young stellar object (YSO) formed at the core centre begins to heat its surroundings (e.g., Emprechtinger et al. 2009).
In molecular clouds (T ~ 10 K), as neutral-neutral reactions often have activation barriers, the dominant reactions are those involving ions,  being the first molecular ion formed as a product of the cosmic-ray (CR) ionisation of H2 and H (Ceccarelli et al. 2014). This ion is the main one that initiates the deuterium enrichment process through an exothermic reaction with HD (e.g., Millar et al. 1989), and it forms H2D+, D2H+, and
  . The collision of all these multi-deuterated forms of
  with neutral species produces deuterated molecules, such as N2D+ and DCO+. On the other hand, their dissociative electronic recombination increases the D/H atomic ratio by several orders of magnitude with respect to the D cosmic abundance (Caselli et al. 2019), thus allowing the deuteration of molecules (e.g. methanol) on the surface of dust grains. In cold environments, HD can also react with
  and
and  , leading to large enhancements of deuterated ions as well, such as CH2D+ and C2HD+, since the back reactions are inhibited (Millar 2005). All these newly formed deuterated ions react in turn with other molecules and atoms, transferring the D atoms to all the other species.
In pre-stellar cores (characterised by low temperatures, T ≲ 10 K; Ceccarelli et al. 2014), CO and O freeze-out onto dust grains, which implies fewer destruction events for  and its deuterated forms. This leads to an increase in H2D+, D2H+, and
  (Dalgarno & Lepp 1984; Roberts et al. 2003; Walmsley et al. 2004), favouring deuteration processes in the presence of high-density gas (e.g., Roberts & Millar 2000; Caselli et al. 2002; Bacmann et al. 2003; Crapsi et al. 2005). Therefore, in dense and cold cores, the deuterated fraction is expected to be much higher than the average [D/H] interstellar abundance ratio (of the order of 10−5; Oliveira et al. 2003; Linsky et al. 2006).
Evolution of starless cores can also be studied through molecule depletion. At temperatures of roughly 10 K and densities above 104 cm−3, several molecules, such as CO and CS, condense out onto dust grain surfaces (e.g., Caselli et al. 1999; Crapsi et al. 2005), and the amount of depletion increases with time (e.g., Bergin & Langer 1997; Aikawa et al. 2003). Therefore, depletion can be used as a time marker since evolved cores should be more depleted of certain species than younger cores. Apart from core evolution, the study of depletion is of paramount importance because of its effects on molecular clouds; depletion causes variations in the deuterium fractionation and the degree of ionisation (Dalgarno & Lepp 1984; Caselli et al. 1998), which is one of the fundamental parameters regulating the star formation rate (e.g., Shu et al. 1987). It also affects the gas-phase chemical composition, leading to chemical variations between similar types of clouds. In addition, the thermal balance of clouds may also be affected by the depletion of major gas coolants, such as CO (e.g., Goldsmith & Langer 1978).
Although sulphur is one of the most abundant species in the Universe (S/H ~ 1.5 × 10⁻⁵; Asplund et al. 2009) and plays a crucial role in biological systems on Earth (e.g., Leustek 2002; Francioso et al. 2020), S-bearing molecules are not as abundant as expected in the interstellar medium (ISM). In fact, one needs to assume a significant sulphur depletion to reproduce observations not only in cold starless cores, but also in hot corinos and hot cores (Esplugues et al. 2014; Crockett et al. 2014). In particular, it is thought that sulphur is depleted by a factor of up to 1000 compared to its estimated cosmic abundance (Ruffle et al. 1999; Wakelam et al. 2004). Several studies have been carried out to shed light on the sulphur reservoir in molecular clouds and the sulphur depletion issue (e.g., Martín-Doménech et al. 2016; Navarro-Almaida et al. 2020). Chemical models predict that, in the dense ISM, atomic sulphur would stick on grains and be mostly hydrogenated to form H2S (Hatchell et al. 1998; Garrod et al. 2007; Esplugues et al. 2014), which is thought to be the main sulphur reservoir in the ice (Vidal et al. 2017; Navarro-Almaida et al. 2020). In fact, according to Druard & Wakelam (2012), the lower the (gas and dust) temperature (<20 K), the greater the H2S abundance on the grain surfaces. However, H2S has never been detected in interstellar ices, and its abundance has been estimated to be smaller than 5 × 10⁻⁸ (/H) (Jiménez-Escobar & Muñoz Caro 2011). Other solid species have been proposed as possible sulphur reservoirs, such as OCS, SO2, H2S2, CS2, and S8 (e.g., Palumbo et al. 1997; Druard & Wakelam 2012; Laas & Caselli 2019; Shingledecker et al. 2020; Cazaux et al. 2022), OCS being the only S-bearing molecule unambiguously detected in ice mantles in the infrared (Geballe et al. 1985; Palumbo et al. 1995) along with, tentatively, SO2 (Boogert et al. 1997; Zasowski et al. 2009).
Gas phase Elemental abundances in Molecular CloudS (GEMS) is an Institut de Radioastronomie Millimétric (IRAM) 30 m Large Program, which aims to estimate S, C, N, and O depletions and the gas ionisation fraction, X(e−), as a function of visual extinction in a selected set of prototypical star-forming filaments (Fuente et al. 2019). To achieve this goal, it is first necessary to determine the abundances of the main reservoirs of the elements in the gas phase by selecting a sample of filaments located in several clouds, covering different types of star formation activity. Here we focus on a sample of starless cores of the nearby star-forming regions Taurus, Perseus, and Orion. These molecular cloud complexes were previously observed with Herschel and SCUBA as part of the Gould Belt Survey (André et al. 2010), and accurate visual extinction (AV) and dust temperature (Td) maps are available (Malinen et al. 2012; Hatchell et al. 2005; Lombardi et al. 2014; Zari et al. 2016). These regions each have different types of star formation activity and therefore different levels of external illumination, allowing us to investigate the influence of UV radiation on the gas composition. In particular, observing several starless cores within each filament will allow us to investigate the effect of time evolution on the chemistry of these cores, while comparing cores in different regions will let us explore the effect of the environment on the chemistry therein. To carry out the present study, we selected the species H2CS and its deuterated counterparts (HDCS and D2CS). Several studies (e.g., Drozdovskaya et al. 2018) confirm that H2CS is expected to be involved in many grain-surface reactions and that it plays a key role in the synthesis of larger sulphur-bearing species, such as CH3SH (in an analogous process to the sequential hydrogenation of CO that leads to CH3OH through H2CO). H2CS can be directly formed from the hydrogenation of HCS, which, in turn, is formed through a neutral-neutral reaction between atomic carbon and H2S. Recent results also demonstrate that H2CS can be formed via the reaction between CH and H2S (Doddipatla et al. 2020), as well as via the irradiation of CO:H2S ice (Jiménez-Escobar & Muñoz Caro 2011). In any case, these reactions are limited by the available amount of H2S within the ices. Nevertheless, as previously mentioned, H2S is considered the main sulphur reservoir in ices, which would facilitate the formation of H2CS. In this way, theoretical studies (e.g., Laas & Caselli 2019) also conclude that, at high densities, H2CS, in addition to being present at a significant level in the gas phase, might also be an abundant C-bearing sulphur species in the ice. All this makes H2CS and its deuterated counterparts good candidates for characterising starless cores and studying their evolution.
In this paper the observations of H2CS, HDCS, and D2CS are described in Sect. 2, and the considered source sample in Sect. 3. In Sect. 4 we present the data and use the non-local thermodynamic equilibrium radiative transfer code RADEX to derive column densities and abundances. A discussion about fractional abundance differences between the sources of the sample is presented in Sect. 5. In that section, we also use the Nautilus time-dependent chemical code to analyse the deuterium fraction evolution and to study the CR impact on this fraction. Section 5 also provides a comparison between theoretical and observational results, as well as an analysis of the main chemical formation and destruction routes of (deuterated) thioformaldehyde. Finally, we summarise our conclusions in Sect. 6.
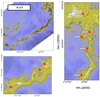 |
Fig. 1 B 213 molecular hydrogen column density maps as derived by Palmeirim et al. (2013), reconstructed at an angular resolution of 18.2″. A general view of the region is shown in the top-right panel, and main regions of interest are enlarged. Contours are (3, 6, 9, 12, 15, 20, and 25) × 1021 cm−2. Positions observed by GEMS with the 30 m telescope are indicated with white triangles. Red circles represent the position of the starless cores. Labels in red indicate the cut IDs. See Table 1 for further details. |
2 Observations
The data used in this work are taken from the GEMS project. A detailed description of the observations is given by Fuente et al. (2019) and Rodríguez-Baras et al. (2021). For clarity, the main observational parameters are summarised below. The 3 mm and 2 mm observations (covering the frequency range 85–172 GHz) were carried out using the IRAM 30 m telescope at Pico Veleta (Spain) during three observing periods in July 2017, August 2017, and February 2018. The observational parameters are listed in Table A.1 with the beam size varying with the frequency as HPBW(″) = 2460/v where v is in GHz. The observing mode was frequency switching with a frequency throw of 6 MHz well adapted to removing standing waves between the secondary mirror and the receivers. The Eight MIxer Receivers (EMIR) and the fast Fourier transform spectrometers with a spectral resolution of 49 kHz (equivalent to 0.165 and 0.087 km s−1 for frequencies at 89 and 168 GHz, respectively) were used for these observations. The achieved rms was ~ 10–20 mK for v < 150 GHz and ~20–30 mK for v > 150 GHz.
The intensity scale is TMB, which is related to  by
by
 (1)
(1)
where Feff is the telescope forward efficiency and Beff is the main beam efficiency1. The difference between  and TMB is ~17% at 86 GHz and ~27% at 145 GHz.
Calibration errors are estimated to be ~10%. The data were reduced and processed using the CLASS and GREG packages from IRAM GILDAS software2, developed by IRAM.
3 Source sample
GEMS considers the molecular cloud complexes Taurus, Perseus, and Orion. In particular, observations include several cuts roughly perpendicular to selected filaments, where the separation between one position and another in a given cut is selected to sample the visual extinction range in regular intervals of AV. In this project, we only focus on the starless cores within filaments of these regions (see Figs. 1–3). In the following, we describe the observed positions in more detail.
The Taurus (L 1495/B 213) molecular cloud, with a total mass of about 1.5 × 10⁴ M⊙ derived from CO data analysis (Pineda et al. 2010), is one of the closest regions of star formation, at a distance of about 145 pc (Qian et al. 2015; Yan et al. 2019), and is known to contain more than 250 YSOs. Taurus is considered an archetypal low-mass star-forming region. Multiple studies, using different ground-based and space telescopes, have been carried out to analyse its evolution and structure. For instance, Palla & Stahler (2002) found a young population inside the filaments and a more dispersed and older population outside them, concluding the presence of an age spread in the region. Goldsmith et al. (2008) showed a very complex and highly structured cloud morphology including filaments, cavities, and rings, while Goodman et al. (1992) studied the presence and orientation of magnetic fields with respect to several filaments within the Taurus cloud. We also highlight the Herschel observations of Taurus obtained in the context of the Gould Belt survey (Kirk et al. 2013; Palmeirim et al. 2013), where a large-scale continuum map of this complex was obtained (Schmalzl et al. 2010), and the recent astrometric studies carried out with Gaia (e.g., Zari et al. 2018; Roccatagliata et al. 2020).
One of the main filaments in Taurus is known as the Lynds Dark Nebula 1495 (L 1495). L 1495 contains several Barnard Dark Nebulae, which are dust-filled regions. Dark nebulae are extremely dense regions of dust that obscure visible light. The central region is known as B 10, with B 211 and B 213 stretching out from the centre. The L 1495/B 213 nebula is a clear example of a star-forming region where the magnetic field lines are perpendicular to the main filament (Soler 2019). It has been extensively studied by Hacar et al. (2013) in high-density tracers, such as C18O, N2H+, and SO, and by Hacar et al. (2016) in the three main isotopologues of 12CO, 13CO, and C18O, deducing the presence of several dense cores embedded in B213 (Benson & Myers 1989; Onishi et al. 2002; Tatematsu et al. 2004; Punanova et al. 2018). Some of these dense cores are starless, while others are associated with YSOs of different ages, with a density of stars decreasing from north to south (Davis et al. 2010). This suggests a different dynamical and chemical age along the filament. Here, we consider the eight (Table 1, Fig. 1) starless cores #1, #2, #5, #6, #7, #10, #12, and #16 (core numbers from the catalogue of Hacar et al. 2013).
The Perseus molecular cloud (L 1448, NGC 1333, Barnard 5, IC 348) is one of the most active nearby star-forming regions, extending ~10 pc on the sky (Bachiller & Cernicharo 1986). According to recent Gaia parallaxes and photometric data, it is located at a distance ranging from 234 to 331 pc (Zucker et al. 2020). The infrared survey of (Ladd et al. 1993) suggests that Perseus is intermediate in its star-forming properties between the Taurus complex, with stars predominantly forming in relative isolation (YSO surface density ~10 pc−2), and the Orion complex, with large clusters with densities of 100 pc−2 as the main stage for the star formation.
The Perseus complex contains six regions with starformation activity -L 1448, L 1455, NGC 1333, Barnard 1 (B1), IC 348, and Barnard 5 (B 5) – (Bachiller & Cernicharo 1986; Ladd et al. 1994) as well as more than 400 YSOs, and ~100 dense cores (Hatchell et al. 2005; Dunham et al. 2013). Most of the protostars in Perseus are associated with IC 348 and NGC 1333 (Yang et al. 2021), with the latter having many active outflows that may regulate the ongoing star formation (Bachiller & Cernicharo 1990; Knee & Sandell 2000; Davis et al. 2008; Curtis et al. 2010; Plunkett et al. 2013). B1, with a high deuterium enrichment (Marcelino et al. 2005), has been studied in different wavelengths (e.g., Walawender et al. 2005), revealing the presence of 10 protostars, multiple molecular outflows, and Herbig-Haro objects. All this suggests that the surrounding region of B1 is very actively forming stars. An energetic outflow can also be found in B5 (Langer et al. 1996) driving into the surrounding cloud material. B5 presents a morphology, with multiple filaments within the velocity coherent region of the core (Pineda et al. 2011). The starless cores from Perseus considered in this paper are listed in Table 1 (see also Fig. 2). All the cores were classified as starless cores by Hatchell et al. (2007), except #60 (1333-C3-14) that is a young Class 0 object.
The Orion molecular cloud (Orion A), located at ~428 pc (Zucker et al. 2019), is the nearest region with a presence of recent OB star formation (e.g., Brown et al. 1995; Lombardi et al. 2014). From CO maps (Maddalena et al. 1986), two big molecular regions are distinguished, the north molecular complex (Orion B) and the south molecular complex (Orion A). Orion B is an extensive CO emission region associated with the dark cloud L 1630 (Lynds 1962). This emission is spread over a region of 4 degrees in the north-south direction from the Horsehead nebula, NGC 2023, and NGC 2024 to the reflection nebulae NGC 2068 and NGC 2071. On the other hand, Orion A is associated with the dark clouds L 1640, L 1641, and L 1647, with emission extending 6 degrees south from the Orion Nebula. The molecular emission of this southern complex is subdivided into three clouds of neutral material: OMC 1, OMC 2, and OMC 3. OMC 1, which is located behind the HII M 42 region, is identified as a dense gas directly associated with Orion KL (Wilson et al. 1970). OMC 2 is related to the HII M 43 region (Gatley et al. 1974), and OMC 3 is located approximately 16’ north of OMC 2 (Kutner et al. 1976). These clouds structured as an integral-shaped filament of molecular gas (Bally et al. 1987) present concentrations of sub-millimetre continuum emission in the southern part of the filament, which are referred to as OMC 4 (Johnstone & Bally 1999) and OMC 5 (Johnstone & Bally 2006).
In GEMS, we have considered three cuts, along OMC 2 (ORI-C3), OMC 3 (ORI-C1), and OMC 4 (ORI-C2) (see Table 1 and Fig. 3). The cuts avoid protostars and stars in these active star-forming regions and represent distinct environments because of their different distances from the Orion nebula. We selected the visual extinction peaks along each cut for this study.
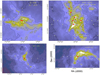 |
Fig. 2 Perseus filament (from right to left and top to bottom: NGC 1333, IC 348, L 1448, and B 5) dust opacity maps at 850 µm by Zari et al. (2016), convolved at an angular resolution of 36″. Contours are (0.056, 0.13, 0.24, 0.56, 1.01, and 1.6) × 1021 cm−2, which, according to Eq. (7) from Zari et al. (2016), corresponds to visual extinctions of ~5, 7.5, 10, 15, 20, and 25 mag, respectively. Positions observed with the 30 m telescope are indicated with white triangles. Red circles represent the positions of the starless cores. |
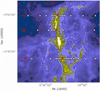 |
Fig. 3 Orion dust opacity map at 850 µm by Lombardi et al. (2014), convolved at an angular resolution of 36″. Contours are (0.056, 0.24, 0.56, 1.36, and 1.61) × 1021 cm−2, which, according to Lombardi et al. (2014), correspond to visual extinctions of ~1.3, 5.6, 13.2, 23.8, and 38 mag. Positions observed with the 30m telescope are indicated with white triangles. Red circles represent the positions of the starless cores. Labels in red indicate the cut IDs (see Table 1). |
4 Data analysis and results
Interstellar thioformaldehyde (H2CS) is a slightly asymmetric rotor with two interchangeable hydrogen nuclei; therefore, its rotational levels are grouped into ortho (Ka odd) and para (Ka even), with statistical weights 3:1. The ortho ground state lies 14.9 K above the para ground state, and its dipole moment is µa = 1.647 D (Fabricant et al. 1977). An advantage of the spectrum of a slightly asymmetric rotor molecule is that lines arising between levels of different energies lie nearby in the spectrum.
H2CS was first detected in the observation of the K-doublet 21,1–21,2 transition at 3 GHz in absorption towards Sgr B2 (Sinclair et al. 1973). Subsequently, this molecule has been observed towards several interstellar sources, such as interstellar clouds (e.g., Cummins et al. 1986; Blake et al. 1987; Minh et al. 1991; Wootten & Mangum 2009), including cold dark clouds (e.g. Irvine et al. 1989; Vastel et al. 2018), in circumstellar envelopes (e.g., Agúndez et al. 2008), in presence of shocked gas (e.g., Bachiller & Pérez Gutiérrez 1997), and in regions dominated by UV photons (e.g., Cuadrado et al. 2017; Rivière-Marichalar et al. 2019).
Regarding the deuterated versions of thioformaldehyde, HDCS was first detected in TMC-1 through a spectral survey (Ohishi & Kaifu 1998; Kaifu et al. 2004), using the frequencies calculated in the laboratory by Minowa et al. (1997). Twice deuterated thioformaldehyde (D2CS) was observed for the first time in a radio astronomical source (the dark cloud Barnard 1) by Marcelino et al. (2005).
4.1 Line profiles
Figures A.1–A.13 show the lines of H2CS, HDCS, and D2CS observed with the IRAM 30 m telescope. We have detected two transitions (31,3–212 and 41,4–31,3) of o-H2CS, two transitions (40,4–30,3 and 50,5–40,4) of p-H2CS, two transitions (31,3–21,2 and 30,3–20,2) of HDCS, one transition (30,3–20,2) of o-D2CS, and one transition (51,5–41,4) of p-D2CS (Tables A.2–A.4). These transitions span an energy range of Eup = 8.1–24.7 K.
We first fitted the observed lines with Gaussian profiles using the CLASS software to derive the radial velocity (VLSR), the line-width, and the intensity for each line. Results are shown in Tables A.2–A.4. The contribution to the intensity arises from one narrow velocity component in all the cases. Line widths for H2CS, HDCS, and D2CS vary between 0.18 and ~1.20 km s−1, with the widest line profiles found in the starless core 1333-C4-1 (Perseus). All the detected lines present TMB ≥ 35 mK, with H2CS having Tmb < 0.8 K, Tmb < 0.5 K for HDCS, and D2CS with TMB < 0.3 K.
4.2 Radiative transfer code
In order to derive column densities and abundances, we carried out a more advanced analysis of the emission of H2CS, HDCS, and D2CS using the molecular excitation and radiative transfer code RADEX (van der Tak et al. 2007). RADEX is a one-dimensional non-local thermodynamic equilibrium radiative transfer code, that uses the escape probability formulation assuming an isothermal and homogeneous medium without large-scale velocity fields.
The collisional rates have been scaled from the (ortho- and para-) H2CO rates derived by Wiesenfeld & Faure (2013), which were calculated including energy levels up to about 180 cm−1 for collisions with H2. For deuterated thioformaldehyde, we also used the same collision rates as for H2CS, with a correction for the reduced mass of HDCS. To obtain the fit that better reproduces the observed line profiles, we let temperature (Tk) and gas density ( ) vary as free parameters. However, several good fits can be obtained for different combinations of
  and Tk. In order to avoid this degeneracy, we let the gas temperature to vary in a small range around the dust temperature3, TK = Td ± 5 K, and let the density and the H2CS column density to vary to constrain accurately the physical conditions and reproduce the observed intensities. The best fit model is obtained by finding the minimum root mean square (rms) value of log10(Iobs/Imod), following Neufeld et al. (2014). This is defined as
 (2)
(2)
where n is the number of observed lines,  is the observed line intensity calculated from Gaussian fits (Sect. 4.1 and Tables A.2–A.4), and
  is the model line intensity using RADEX. The values obtained for the H2 volume density of the cores in the best fit models are in the same order of magnitude that the ones obtained by Rodríguez-Baras et al. (2021) using the species CS to derive the densities. In particular, the differences between both cases are within a factor of ~3. Column densities for HDCS and D2CS were derived assuming physical conditions obtained for H2CS in each core.
Apart from calibration, given that lines are optically thin, one of the main sources of uncertainty to consider is the low angular resolution of the telescope (between ~14″ and ~29″ depending on frequency), which implies that the emission from the inner region of the pre-stellar core is blended with the outer cold envelope. This mainly affects Orion and Perseus cores at low frequencies. Also, the possible volume density gradients along the line of sight may influence the results as well. Taking this into account, the uncertainties in the obtained column densities are estimated to be 20% for H2CS, and 25% for HDCS and D2CS (higher uncertainty for the deuterated versions of H2CS because their lines are weaker). The derived column densities for H2CS, HDCS, and D2CS are shown in Table A.5.
We also calculated the fractional abundances, X, of H2CS, HDCS, and D2CS with respect to total H nuclei using visual extinction data for the cores (Rodríguez-Baras et al. 2021) and the relation between extinction and hydrogen column density in the Galaxy (Güver & Özel 2009)4. The visual extinction data were calculated for B213 from the  values provided by Palmeirim et al. (2013). In the Orion case, we used dust opacity maps at 850 µm (Lombardi et al. 2014) and the expression AV = AK/0.112, where the K-band extinction Ak = 2640 × τ850 + 0.012 (see Rodriguez-Baras et al. 2021 for more details). In Perseus, we also used the dust opacity at 850 µm (τ850) and Eq. (7) from Zari et al. (2016). We have therefore assumed an uncertainty of 30% for X(H2CS) and of 35% for X(HDCS) and X(D2CS) due to the uncertainty introduced by the visual extinction values. Fractional abundance results are listed in Table 2.
4.2.1 Thioformaldehyde
Figures A.1–A.6 show our best fit models for the detected rotational lines of o-H2CS andp-H2CS in B 213, L 1448, NGC 1333, Barnard 5, IC 348, and Orion A, respectively.
For the cores located in the Taurus complex, we find the highest H2CS column density, N(H2CS) = (7 ± 1) × 1012 cm−2 (Table A.5), in the core C5. This core can be found in a region located to the north of the filament L 1495/B 213 (Fig. 1), which is characterised by the presence of Class I/Flat objects, but whose stellar population is dominated by more evolved objects. In fact, the region hosting C5 has the largest number of Class III objects (7 out of 25 YSOs; Hacar et al. 2013). The starless core C16, located towards the south-west of B 213, presents the second highest H2CS column density (Table A.5). This core is in a region that has recently started to form stars and represents a younger active region compared to C5. Other cores of the sample, such as C1, C2, and C6, which are located north of B 213, although slightly more south from C5 (see maps shown in Figs. 1 and 2 in Hacar et al. 2013), present H2CS column densities up to three times lower than C5.
Regarding Perseus, the lowest H2CS column densities (<2 × 1012 cm−2) are found in the cores C5, C6, and C7 of NGC 1333, and in IC 348, which is located in the eastern part of the Perseus molecular cloud and associated with a cluster containing a pre-main-sequence star with an age of 0.5–3.5 Myr (Luhman et al. 2003). By contrast, the highest value of N(H2CS), (11 ± 2) × 1012 cm−2, is found in L 1448 situated to the west of the complex. The core 79-C1-1 (in Barnard5, north-east of Perseus) presents an intermediate H2CS column density (5 ± 1 × 1012 cm−2).
In Orion A, we obtain N(H2CS) = (2.5–5) × 1012 cm−2 for the three cores (Table A.5), which are very similar column densities considering their uncertainty values (Table A.5). Nevertheless, the highest value is found in ORI-C1 (located in OMC-3, one of the most active regions of the sample, with the presence of several 3.6 cm free–free emission sources, nine embedded mid-infrared sources, and a molecular outflow, Johnstone & Bally 1999; Shimajiri et al. 2015).
In our analysis, we treated o-H2CS and p-H2CS separately, which allows us to derive the ortho-to-para ratio (OPR) for the different regions. We found that the values of the OPR(H2CS) range from 1.8 to 5.0 with an average value of 2.4 ± 0.9, without any clear trend with the gas temperature and/or the environment when taking the uncertainties into account.
Fractional abundances for H2CS, HDCS, and D2CS.
4.2.2 Deuterated thioformaldehyde
Figures A.7–A.13 show our best fit models for the detected rotational lines of HDCS, o-D2CS, and p-D2CS in the sample of starless cores. As for H2CS, we observe that, although most of the line profiles are very well reproduced by the model, there are a few cases where the best fits underestimate the observed spectra. The presence of residuals may be mainly due to the noise added to the data, which is especially important in the cases where the line intensities are very weak (<0.1 K). This is, for instance, the case for the transition 31,3–21,2 of HDCS in B213-C2-1, B213-C5-1, and B213-C7-1. The underestimation of the observed spectra by the fits can be also due to the presence of blended species, or simply due to a limited model, since, depending on the physical structure of each source, emission can arise from different possible source components that are not considered in the model.
In the Taurus complex, we detected the deuterated species HDCS in all the starless cores of B213, except in B213-C12 (located in the south part of L 1495/B 213, Fig. 1) for which we provide an upper limit of N(HDCS) < (2.2 ± 0.5) × 1011 cm−2. In fact, the lowest column densities of HDCS, (2.1–8) × 1011 cm−2 (Table A.5), are also found in this central part of the B 213 filament, in particular in B 213-C10 and B 213-C16. By contrast, the highest values are found in B 213-C1, C6, and C7, located all of them in the north of the filament, suggesting a higher deuterium fraction in the north of this complex than in the south region.
Similar results are found for D2CS, with the lowest column density values (3.0 × 1011 cm−2) in the south part of the B213 filament (core C-12), and the highest ones in cores (C1 and C6) of the north. In particular, we detect o-D2CS in all the cores, except in one (B 213-C10) for which we provide an upper limit. On the other hand, p-D2CS is only detected in B 213-C1 with a column density of (4 ± 1) × 1011 cm−2. For the rest of the cores, we calculated the column density of p-D2CS from o-D2CS and assuming OPR = 2.0 ± 1.0. This OPR(D2CS) is obtained by averaging the OPRs from the cores B 213-C1-1 and L 1448-1, since only in these two cores we observe o-D2CS and p-D2CS. If there is no detection of o-D2CS, we just provide an upper limit for p-D2CS (as for B 213-C10) in Table A.5.
In the Perseus complex, we find the highest HDCS column density, (3.5 ± 0.9) × 1012 cm−2, in L 1448 and NGC 1333-C4 like in the case of H2CS. Non-detection of HDCS nor D2CS is, however, found in IC 348, which is immersed in a more active environment compared to the one where L 1448 is located (Knee & Sandell 2000; Plunkett et al. 2013). Values for N(HDCS) in 79-C1 and in most of the starless cores of NGC 1333 are found to be lower than in L 1448, with N(HDCS) < 3 × 1012 cm−2. Regarding D2CS, this double deuterated species is only detected in its two versions (o-D2CS and p-D2CS) in L 1448, while in the rest of the cores we provide upper limits or calculate the column density of p-D2CS where o-D2CS has been detected by assuming an OPR = 2.0 ± 1.0 as previously mentioned.
In the three starless cores observed in Orion A, we only detect HDCS, with N =(3.7 ± 0.9) × 1011 cm−2, in ORI-C2, which is located in OMC-4. The OMC-4 region is less luminous and turbulent than OMC-2 and OMC-3 (where the cores ORI-C3 and ORI-C1 are located, respectively), and it does not show evidence of outflow activity (Johnstone & Bally 1999). It suggests that OMC-4 might be in a pre-collapse phase of protostar evolution with colder temperatures, explaining thus the presence of deuterated thioformaldehyde. Regarding doubly deuterated thioformaldehyde, we do not detect its presence in any of the sampled starless cores, but we also provide upper limits in Table A.5.
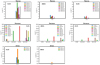 |
Fig. 4 Fractional abundances of H2CS, HDCS, and D2CS with respect to total H nuclei for the core sample. |
5 Discussion
5.1 Fractional abundances
Figure 4 shows the H2CS, HDCS, and D2CS fractional abundances, X, with respect to total H nuclei in the core sample (see also Table 2).
In the Taurus cloud, we find the highest H2CS fractional abundance (1.4 × 10⁻¹⁰) in the starless core B213-C5. The rest of cores present fractional abundances up to ten times lower than C5. As previously mentioned, the region hosting C5 is characterised by the presence of several YSOs, some of them being Class III (Hacar et al. 2013). This implies that the core B 213-C5 may be affected by nearby star formation activity and, therefore, by the presence of winds and outflows that could excavate molecular material, leading to a more efficient penetration of the interstellar radiation field into the molecular cloud. The presence of low-mass stars nearby can also accelerate energetic particles and increase the local CR flux and ionisation rate (see discussion in Spezzano et al. 2022), leading to an increase in the H2CS abundance as also found in our model results (see Fig. A.15). For deuterated thioformaldehyde, we find fractional abundances for HDCS and D2CS in Taurus in the range (0.5–3) × 10−11 (Table 2). In Fig. 4, we observe that the highest deuterium fractional abundances are found in the cores located in the north of B 213 (e.g. C1, C6, and C7), while in cores located in the south part of the filament (C10, C12, and C16), X(HDCS) and X(D2CS) are lower than in the north or simply not detected.
In Perseus complex, we find X(H2CS) in the range (1.4–18) × 10−11, similar to the range found in Taurus, with the highest value in L 1448, which hosts a few young stars associated with extremely long outflows (of up to ~240 arcsec; Curtis et al. 2010). By contrast, some of the lowest X(H2CS) values are found in the starless cores of IC 348, a young region where only <0.05% of its mass is contained in outflows (Curtis et al. 2010). The highest X(HDCS) value in the Perseus sample is also found in L 1448, while we do not detect it in IC 348, and the values obtained for most of the cores of NGC 1333 (which is the most active star-forming region site in the whole Perseus cloud, Pineda et al. 2008) are low (0.4–2.5 × 10⁻¹¹). Regarding D2CS, its obtained fractional abundances are between 1 and 4 × 10⁻¹¹, with one of the highest values also found in L 1448.
In Orion A, the highest X(H2CS) is (3.0 ± 0.9) × 10−11, and it is found in ORI-C2-3. This value is more than double those found in the other cores of the Orion sample. The fractional abundance of HDCS in ORI-C2-3 is (0.3 ± 0.1) × 10−11, which is ten times lower than X(H2CS).
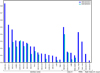 |
Fig. 5 Deuterium fractionation ratios in different interstellar sources. References are (Minowa et al. 1997) for TMC-1, (Irvine et al. 1989) for L183, (Marcelino et al. 2005 for Barnard 1, (Agúndez et al. 2019) for L 483, (Drozdovskaya et al. 2018) for IRAS 16293-2422, (Rivière-Marichalar et al. 2019) for the Horeshead PDR, and (Minh et al. 2018) for G33.92+0.11. |
Deuterium fractionation ratios.
5.2 Deuterium fractionation
Deuterium was formed at the birth of the Universe with an abundance D/H estimated to be 1.6 × 10⁻⁵ and is destroyed in the interiors of stars at T ~ 0.5 × 10⁶ K (Molinari & Ricci 1986; Tsujimoto & Bland-Hawthorn 2010; Moscoso et al. 2021). The deuterium fractionation ratio, defined as the ratio of the column density of a deuterated molecule to its hydrogen counterpart, is found to increase greatly in some sources. This is, for instance, the case of cold (Tg ~ 10 K) dark clouds, where the increase is a few orders of magnitude compared to the cosmic D/H ratio (e.g. Roueff & Gerin 2003; Ceccarelli et al. 2007; Herbst & van Dishoeck 2009).
Table 3 shows the deuterium fractionation ratios obtained in our starless core sample. Figure 5 shows a comparison between these results and the ones obtained for other starless cores from the literature, as well as a comparison with other type of interstellar sources, such as Class 0 objects and photodissociation regions (PDRs). The HDCS/H2CS ratios obtained in our sample of starless cores are in the range ~0.1–0.8, with Orion showing the lowest value (HDCS/H2CS = 0.10 ± 0.04) compared to those obtained in Taurus and Perseus. The obtained HDCS/H2CS ratios are up to ~4 orders of magnitude higher than the cosmic D/H ratio, but they are similar to those found in other starless cores (see Fig. 5), such as TMC-1 and L 183 (e.g. Irvine et al. 1989; Minowa et al. 1997; Marcelino et al. 2005), where the low (~7–13 K) temperatures of these regions, as well as the large fraction of neutral heavy species freeze-out onto dust grains, favour the formation and enhancement of deuterated species (Millar et al. 1989; Ceccarelli et al. 2014). In particular, the deuterium enrichment in cold regions occurs through the reaction between the molecular ion  with HD to form H2D+, which reacts with other molecules and atoms transferring deuterium to other species (e.g. Howe & Millar 1993). Nevertheless, in Fig. 5, we also observe that similar HDCS/H2CS ratios (~0.1–0.5) are found as well in interstellar regions characterised by higher temperatures than those found in starless cores, such as Class 0 protostar (e.g. L 483 and IRAS 16293-2422: Agúndez et al. 2019; Drozdovskaya et al. 2018), high-mass star-forming clouds (e.g. G33.92+0.11: Minh et al. 2018), and PDRs (e.g. Horsehead PDR: Rivière-Marichalar et al. 2019). A rich deuterium chemistry is observed in PDRs, such as the Orion Bar (Parise et al. 2009) and Monoceros R2 (Treviño-Morales et al. 2014). In the regions characterised by warm gas temperatures (30 ≲ T ≲ 100 K), the deuterium fractionation is driven through a chemistry that is different to that from cold regions. In particular, the D atoms are transferred to molecules by CH2D+, whose activation barrier when reacting with H2 is larger than that of H2D+ (Roberts & Millar 2000; Roueff et al. 2007). In the case of single-dish observations of dense cores around Class 0 protostars, the origin of the deuterated compounds emission could be in the cold and dense region of the core that still remains unaffected by the heating produced by the recently born star (Agúndez et al. 2019). In hot corinos, with temperatures T > 100 K, the ice mantles evaporate releasing deuterated compounds formed in the gas and/or the ice during the cold phase (Drozdovskaya et al. 2018).
The derived fractionation ratio for the double deuterated thioformaldehyde, D2CS/H2CS, is in the range ~0.05–0.4 (Table 3 and Fig. 5) for the starless cores in Taurus and Perseus, while only upper limits are reported for those in Orion, where D2CS has not been detected. For the cases where D2CS is detected, the double deuterated ratio is on average a factor ~1.9 lower than the single deuterated ratio (HDCS/H2CS). This is a similar range to that found for Class 0 objects, such as Barnard 1 and L483, where D2CS/H2CS is ~1.3 and ~3 times lower than HDCS/H2CS, respectively (Marcelino et al. 2005; Agúndez et al. 2019). For the case of Orion where only upper limits are provided (i.e. cores ORI-C1-2 and ORI-C3-1), we obtain HDCS/H2CS values of <0.02 and <0.07, respectively, which are about ~10 times lower than those found in Taurus and Perseus. In the case of D2CS/H2CS, we also observe this difference between the Orion cores and the cores in Taurus and Perseus. Only in 1333-C3-1 and B213-C5-1 (affected by the presence of nearby star formation activity as ORI-C3-1; see Sects. 4.2.1 and 5.1), we derive a deuterium fractionation ratio similar to the ones obtained in Orion. In regions characterised by more extreme environments and higher temperatures, such as PDRs, D2CS has not been detected either.
Our results, therefore, make it evident that the deuterium fractionation is higher in the pre-stellar cores of Taurus and Perseus than those of Orion. Nevertheless, we should also take the different distances of the studied regions (Taurus, Perseus, and Orion) into account. In particular, typical pre-stellar core sizes are of about ~10 000 AU (Ceccarelli et al. 2014, and references therein), which it is equivalent to ~0.05 pc or ~24″ at a distance of d ~ 428 pc (average distance to Orion). In the case of Perseus (d ~ 300 pc) and Taurus (d ~ 145 pc), the angular sizes would be ~30″ and ~71″, respectively. These angular sizes are significantly larger than the telescope beam (up to ~29″). However, in the Orion case, the angular size is smaller than the beam for the lowest frequencies. This implies that in the nearest regions (in particular in Taurus), the observed emission may be limited to the high-density central region of the cores, while, in the Orion case, we are not able to distinguish the emission coming from the densest zone from that coming from the envelope. This could cause the observed trend in the deuterium fractionation, which shows the lowest values in the Orion cores and the highest values in Taurus. In particular, the D/H values obtained in Orion are a factor of ~10 lower than those obtained in Taurus. This suggests that the D/H ratio in the envelope of the Orion cores should be (much) lower than a factor of 10 with respect to the D/H in the high-density central regions. We would need observations at higher frequencies or interferometry to resolve the emission from the pre-stellar cores in Orion.
Abundances with respect to total hydrogen nuclei (the initial H2 OPR is 3).
5.3 Deuterium fractionation evolution
Apart from temperature, deuterium fractionation is also thought to vary along the dynamical evolutionary stages of starless cores. In particular, when starless cores evolve towards star formation, the deuterium fraction of molecules formed in the gas phase increases, reaching their maximum at the onset of star formation (Crapsi et al. 2005; Hirota & Yamamoto 2006; Emprechtinger et al. 2009; Feng et al. 2019), while after the star birth, the deuterium fraction decreases (Fontani et al. 2011; Sakai et al. 2012; Gerner et al. 2015). Deuterium fractionation ratios can therefore be used as evolutionary tracers.
In order to study the evolution of the HDCS/H2CS and D2CS/H2CS ratios in starless cores, we used the Nautilus gasgrain chemical code (Ruaud et al. 2016). Nautilus is a three-phase model in which gas, grain surface, grain mantle phases, and their interactions are considered. Nautilus solves the kinetic equations for both the gas phase and the surface of interstellar dust grains and computes the evolution with time of chemical abundances for a given physical structure. We use the chemical network presented by Majumdar et al. (2017), which considers multiple deuterated molecules and includes the spin chemistry in Nautilus. Moreover, we used this state-of-the-art chemical model to explore the influence that poorly known parameters, such as the sulphur elemental abundance and the CR ionisation rate for H2 molecules, would have on the H2CS deuterium fractionation.
In particular, we calculated the evolution of HDCS/H2CS and D2CS/H2CS as a function of time (considering a time range of 103–107 yr) and the core temperature (ranging from 7 to 20 K). We also considered a visual extinction AV = 15 mag, a UV field strength χUV = 1 (in Draine units), different volume densities (105, 106, and 107 cm−3), and also different initial sulphur abundances (1.5 × 10⁻⁵, 1.5 × 10⁻⁶, and 1.5 × 10⁻⁷; see Table 4). We considered different initial sulphur abundances since the value of elemental sulphur abundance is uncertain. In particular, while the observed gaseous sulphur accounts for its total cosmic abundance in the primeval diffuse clouds and HII regions (Neufeld et al. 2015; Goicoechea & Cuadrado 2021), there is an unexpected paucity of S-bearing molecules within dense molecular clouds (see e.g. Agúndez & Wakelam 2013). In starless cores (i.e. the cold and dense cores where stars are formed), the sulphur atoms locked within the observed molecules constitute only <1% of the expected amount (see e.g. Vastel et al. 2018). One could think that most of the sulphur is locked on the icy mantles that cover dust grains but, surprisingly, a similar trend is encountered within the solid phase. Nowadays, solid OCS and tentatively solid SO2, are the unique sulphur compounds observed, while only upper limits to the solid H2S abundance have been derived (Palumbo et al. 1995, 1997; Boogert et al. 1997; Jiménez-Escobar & Munoz Caro 2011). According to these measurements, the abundances of the icy species could account for <5% of the total sulphur. It has been suggested that this so-called depleted sulphur may be locked as refractory material (in particular as S8, Shingledecker et al. 2020; Cazaux et al. 2022), claiming sulphur depletion of more than two orders of magnitude. Intense observational and theoretical work has been carried out in the last decade to constrain the value of sulphur depletion, and there is increasing evidence for a moderate factor of 1–20 of sulphur depletion in cold and warm clouds (Esplugues et al. 2013, 2014; Fuente et al. 2019; Navarro-Almaida et al. 2020, 2021; Bulut et al. 2021; Codella et al. 2021). For that, we consider in our models the un-depleted case (1.5 × 10⁻⁵), as well as sulphur depletions of a factor of 10 and 100 (Table 4).
Figures 6 and 7 show the evolution of HDCS/H2CS and D2CS/H2CS, respectively. For the case of HDCS/H2CS, when the number density is nH = 105 cm−3, its maximum reached value at any time is ~0.2. However, for higher densities, HDCS/H2CS increases up to ~0.5 at Tgas < 12 K. Nevertheless, this maximum value is reached with a difference of about 5 million years depending on if the considered density is nH = 106 cm−3 or 107 cm−3 (the smaller the density, the longer the evolution time). Apart from density, we also observe in Fig. 6 a variation in the deuterated ratio with sulphur fractional abundance in such a way that the lower the initial X(S), the higher the HDCS/H2CS ratio, especially at low temperatures. Similar trend is also observed in Fig. 7 for D2CS/HDCS. In particular, we find that decreasing the sulphur initial fractional abundance from 1.5 × 10⁻⁵ (which corresponds to the Solar value, Asplund et al. 2009) to 1.5 × 10⁻⁷, leads to an increase by a factor of up to ~1.5 and ~2.5 in the maximum values of the HDCS/H2CS and D2CS/H2CS ratios, respectively.
From Figs. 6 and 7, we also obtain a strong dependence of HDCS/H2CS and D2CS/H2CS with time, since their values progressively increase with the evolution of the starless cores. These ratios, therefore, can be used as powerful tools to derive the evolutionary stage of starless cores. However, they cannot be used to derive the temperature of the starless cores since their evolution presents a double peak in two ranges of temperature (Tgas ~ 7–11 and ~15–19 K).
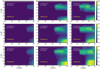 |
Fig. 6 Evolution of the HDCS/H2CS ratio (colour bar) as a function of time and temperature for a CR ionisation rate ξ = 1.3 × 10⁻¹⁷ s−1, a hydrogen number density nH = 105, 106, and 107 cm−3, and an initial sulphur abundance S+ = 1.5 × 10⁻⁵, 1.5 × 10⁻⁶, and 1.5 × 10⁻⁷. |
5.4 Cosmic-ray impact on deuterium fractionation
Another important parameter regulating deuterium fractionation in the cold phases of the ISM is the ubiquitous presence of CRs, since in the denser regions where UV photons are efficiently absorbed and cannot penetrate, CRs become the main ionising agent of the gas. In fact, its interaction with H2 produces  , which rapidly reacts with another hydrogen molecule leading to
  . This ion is the starting point for reactions between charged and neutral species, producing several other key molecules, such as HCO+ and H2D+ (Dalgarno & Lepp 1984). In spite of its role in deuterium chemistry, the CR ionisation rate is still uncertain and spreads over a range of values. While van der Tak & van Dishoeck (2000) determined a CR ionisation rate of ~3 × 10⁻¹⁷ s−1 in dense clouds, Indriolo & McCall (2012) obtained a range (1.7–10.6) × 10−16 s−1 of values considering a sample of diffuse clouds, and Neufeld & Wolfire (2017) derived a CR ionisation rate of the order of a few 10−16 s−1 in the Galactic disc. A very recent study of the pre-stellar core L 1544 shows that observations are better reproduced with a CR ionisation rate ζ = 3 × 10⁻¹⁷ s−1 than with ζ = 1.3 × 10⁻¹⁷ s−1 (Redaelli et al. 2021).
In the same line, Fuente et al. (2019) derived a CR ionisation rate of ζ = (0.5–1.8) × 10−16 s−1 in the translucent phase of TMC1, probing that high CR ionisation rate is found in the outer regions of molecular clouds. A lower value of ζ = 1.3 × 10⁻¹⁷ s−1 was derived by Navarro-Almaida et al. (2021) in the dense cores TMC1 (C) and TMC1 (CP), in qualitative agreement with the expected behaviour of ζ decreasing with visual extinction along the molecular cloud (Padovani et al. 2013; Ivlev et al. 2018, 2021).
In Fig. 8, we show the impact of varying the CR ionisation rate (from ζ = 10−16 s−1 to ζ = 1.3 × 10⁻¹⁷ s−1, which is considered as the standard CR rate for dense cores) on the deuterium fractionation for the HDCS/H2CS and D2CS/H2CS ratios along 107 yr. We obtain that, for both models with different ζ, the evolutionary trend is similar for each deuterium fractionation ratio, with them progressively increasing with time and showing two peaks at the range temperatures previously mentioned. Nevertheless, for HDCS/H2CS, we also observe that, although the maximum reached value is the same (~0.54) independently on the considered ζ, in the model with the higher CR ionisation rate the maximum HDCS/H2CS ratio is reached about 3 million years later than in the model with the low CR ionisation rate. For D2CS/H2CS, we also obtain lower values for the higher ζ in each evolution time with respect to the model with the low CR ionisation rate. These results indicate that the main effect on the deuterium fractionation when increasing by one order of magnitude the CR ionisation rate is to slow down its evolution by a few million years.
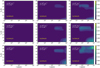 |
Fig. 7 Evolution of the D2CS/H2CS ratio (colour bar) as a function of time and temperature for a CR ionisation rate ξ =1.3 × 10⁻¹⁷ s−1, a hydrogen number density nH = 105, 106, and 107 cm−3, and an initial sulphur abundance S+ = 1.5 × 10⁻⁵, 1.5 × 10⁻⁶, and 1.5 × 10⁻⁷. |
5.5 Comparison with observations
In the Taurus complex, we find the highest HDCS/H2CS ratios (~0.3–0.5, Table 3) in the starless cores located in the north of the B213 filament (C1, C2, and C6). Models shown in Fig. 6 reproduce these values at t ≳ 5 × 10⁵ yr, densities nH > 105 cm−3, and with a high sulphur initial depletion. In fact, the highest deuterium ratio (HDCS/H2CS = 0.5) from the starless core B 213-C1-1 is only reproduced when the sulphur fractional abundance is as low as 1.5 × 10⁻⁷ and for a long evolution time of 1–5 Myr. Regarding the double deuterated ratio, the starless cores C1, C2, and C6 also present the highest values (~0.2–0.3) obtained observationally. These D2CS/H2CS ratios are reproduced by a model with high density, t ≳ 106 yr, and also with a low sulphur initial fractional abundance (≤1.5 × 10⁻⁶; see Fig. 7). By contrast, the cores C10 and C16 located in the south part of the B 213 filament present low HDCS/H2CS and D2CS/H2CS ratios (≲0.14). These values are reproduced at earlier times (t < 106 yr) than those for the cores C1, C2, and C6, indicating that cores located in the south part of B 213 are less chemically evolved than the ones located in the north of the filament. In any case, we should also consider the uncertainties associated with the D/H ratios of these cores (except for the core C1 with the highest D/H even considering its uncertainty; Table 3), which makes it difficult to clearly determine the evolutionary stages of the cores since some of these uncertainties represent up to the 50% of the D/H value. Nevertheless, comparing with results from other authors, we find that our results are in agreement with the ones found by Hacar et al. (2013) through observations of CO and N2H+. In particular, they found that the region harbouring the cores C1, C2, and C6 is weak in C18O and has a number of N2H+-bright dense cores, which suggests that some CO depletion has already taken place, and that this region must therefore be more chemically evolved than other regions located more to the south, such as the one hosting C7, which is more bright in C18O. In fact, we obtain a low deuterium ratio in C7 (0.2 ± 0.1). Table 5 summarises the evolutionary stages of our core sample obtained by comparing the observations and the model results.
In Perseus, the starless core NGC 1333-C7 presents HDCS/H2CS and D2CS/H2CS ratios as high as 0.5 and 0.2, respectively. As we observe in Figs. 6 and 7, we reproduce these values for a model with a density >105 cm−3, a TK < 12 K, a sulphur fractional abundance of at least 1.5 × 10⁻⁶, and an evolutionary time between 1 and 5 Myr. This is a slightly older age than that derived (0.5–1.5 Myr) by Lada et al. (1996) and Wilking et al. (2004) for NGC 1333. For the cores NGC 1333-C4 and L 1448-1, located in the south-western part of the Perseus complex like NGC 1333-C7, we also obtain high ratios of HDCS/H2CS (0.3) and, in particular, of D2CS/H2CS (0.3 and 0.2, respectively). We reproduce them for a chemical age of ~2Myr for L 1448-1, and of ~5 Myr for NGC 1333-C4 (Fig. 7). On the other hand, the core 79-C1-1, which is located farthest north-east of the Perseus molecular cloud, presents low deuterium ratios (0.2 and 0.16 for HDCS and D2CS, respectively). For the core IC 348 (also situated in the north-east region), we do not detect emission of HDCS nor D2CS. All this suggests that, in general terms, the north-eastern part of Perseus is in an earlier chemical evolutionary stage (< 1 Myr) than the south-western part (≥1–5 Myr; see Table 5). In any case, Perseus observations are reproduced considering a sulphur initial fractional abundance ≤ 1.5 × 10⁻⁶ as in the case of Taurus.
Regarding Orion, we detect H2CS in the three cores of the sample (N = 1.9–3.6 × 1012 cm−2, Table A.5), but we only detect HDCS in ORI-C2-3. This is probably due to the more quiescent properties of OMC-4 (where ORI-C2 is located) compared to the other two regions harbouring the cores ORI-C1 and ORI-C3, as mentioned in Sect. 4.2.2. The deuterium fractionation in ORI-C2-3 is as low as 0.1, which, for a high-density (nH ≥ 106 cm−3) model characteristic of the Orion region, is reproduced at t ≲ 0.5 Myr.
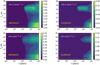 |
Fig. 8 Evolution of the HDCS/H2CS (left) and D2CS ratio (right) as a function of time and temperature for an initial sulphur fractional abundance S+ = 1.5 × 10⁻⁷, a hydrogen number density nH = 106 cm−3, and a CR ionisation rate ζ = 1 × 10⁻¹⁶ (bottom row) and 1.3 × 10⁻¹⁷ s−1 (top row). |
Classification of the core sample according to the evolutionary stage.
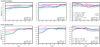 |
Fig. 9 Main chemical reaction rates forming (top) and destroying (bottom) H2CS. |
5.6 Thioformaldehyde formation and destruction
Out of more than 200 molecules detected in space, about 10% contain sulphur. In spite of the use of astronomical observations coupled with laboratory experiments and astrochemical modelling to study interstellar sulphur chemistry, results have been unsuccessful in predicting fractional abundances of species, such as carbonyl monosulfide (CS), falling short by up to two orders of magnitude compared to astronomical observations (e.g. Esplugues et al. 2014; Laas & Caselli 2019). In this way, the analysis of formation mechanisms of (organo)sulphur molecules in different astrochemical environments is key to shed light on the origin and evolution of sulphur in our Galaxy.
Figures 9–11 show chemical rates for the main chemical reactions forming and destroying H2CS, HDCS, and D2CS calculated with the Nautilus code, considering a sulphur fractional abundance of 1.5 × 10⁻⁷, core temperatures of 10 and 20 K, and densities ranging from 105 to 107 cm−3. In the case of H2CS (Fig. 9), the main gas-phase routes (i.e. the reactions with the highest reaction rates) forming this species at any evolutionary time are
 (3)
(3)

in agreement with Prasad & Huntress (1982) and Laas & Caselli (2019). Nevertheless, we note that while the ion H3CS+ is mainly formed through the reaction between CH4 and S+ at t < 104 yr, for longer times H3CS+ is formed in turn through H2CS. In the case of a very high-density (107 cm−3) starless core (right top panel) and Tg = 20 K (dashed lines), the surface reactions
 (5)
(5)

also become dominant at 5 × 10⁴ ≲ t ≲ 5 × 10⁵ yr. These chemical and thermal desorption reactions barely influence instead the formation of H2CS when the density of the core is ≤106 cm−3. Regarding destruction, H2CS is mainly destroyed through its reaction with C+ during the early timescales (t ≲ 104, ≲103, and ≲102 yr for nH = 105, 106, and 107 cm−3, respectively). For longer times, H2CS depletion becomes one of the main destruction routes, especially at very high densities, together with the reaction between H2CS and H+.
Formation and destruction reaction rates for HDCS are shown in Fig. 10. HDCS is mainly formed in all the considered cases by the reactions
 (7)
(7)

Nevertheless, in the low temperature case (10 K), the chemical desorption
 (9)
(9)
also plays an important role in forming HDCS at t < 103 yr. Regarding HDCS destruction, its reaction with C+ represents the main destroying mechanism for t ≲ 104 yr with n ≤ 106 cm−3. At longer times, HDCS is mainly destroyed by H+. In a very high-density core (right bottom panel), depletion of HDCS becomes also important removing this deuterated species from the gas phase.
With respect to the double deuterated thioformaldehyde, for an early time (t ≲ 103 yr) and a cold core (Tg = 10 K), D2CS is efficiently formed both on dust grains (through chemical desorption from the reaction between JD and JDCS) and through the gas-phase reaction
 (10)
(10)
while for a warmer core (Tg = 20 K) the chemical desorption becomes less efficient in forming D2CS, in favour of the neutral–neutral gas-phase reaction
 (11)
(11)
At late timescales (>105 yr), D2CS is mainly formed in the gas phase through the reactions
 (12)
(12)
 (13)
(13)

By contrast, surface reactions are irrelevant forming D2CS at long times (>105 yr), independently on the temperature and density of the starless core. Regarding D2CS destruction, as in the case of HDCS and H2CS, the ions C+ and H+ are the main destroyers of D2CS. D2CS depletion has also an important role, especially in cores with very high density, where it becomes the main D2CS destroying mechanism during a period of ~104 yr.
All these results show that (deuterated) thioformaldehyde is mainly formed through gas-phase reactions, where the ions H3CS+, H2DCS+, and HD2CS+ (formed in turn from H2D+ and D2H+), as well as the neutral precursors CH3, CH2D, and CHD2, have a key role in the formation of H2CS, HDCS, and D2CS, respectively.
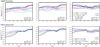 |
Fig. 10 Main chemical reaction rates forming (top) and destroying (bottom) HDCS. |
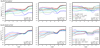 |
Fig. 11 Main chemical reaction rates forming (top) and destroying (bottom) D2CS. |
6 Summary and conclusions
Within the IRAM 30 m Large Program GEMS, we have carried out a comprehensive observational and theoretical study of thioformaldehyde and its deuterated counterparts in a sample of starless cores in filaments of the nearby star-forming regions Taurus, Perseus, and Orion. These regions have different degrees of star formation activity, and therefore different physical conditions, providing a possibility to explore the effect of environment on gas chemistry.
Using the molecular excitation and radiative transfer code RADEX, we have obtained column densities and fractional abundances for H2CS, HDCS, and D2CS in each core of the sample, also providing upper limits for cases where these species were not detected. We have also derived deuterium fractionation ratios for both single and double deuterated thioformaldehyde. The obtained ratios are up to four orders of magnitude higher than the cosmic D/H ratio. This result is similar to the ones obtained in other starless cores, such as L 183, and it is due to the low temperatures of these regions, as well as the large fraction of neutral heavy species that freeze-out onto dust grains, favouring the formation of deuterated species. We have also found that the HDCS/H2CS ratio is similar to that found in regions characterised by higher temperatures, such as Class 0 objects, high-mass star-forming clouds, and PDRs. In these warm regions, the deuterium fractionation is driven by a chemistry different from that of cold regions, with D atoms being transferred to molecules by CH2D+ instead of H2D+.
Since the deuterium fractionation ratio can be considered as an evolutionary tracer, we have also used it to derive the chemical evolution stage of the starless core sample through the Nautilus gas-grain chemical code, which computes the evolution of chemical abundances as a function of time. The comparison of model results with observations reveals that the north region of the B 213 filament in Taurus, harbouring cores such as C1, C2, and C6, is more chemically evolved (t ≳ 1 Myr) than other regions located more to the south of the filament (t < 1 Myr), where we find the cores C7, C10, and C16. In Perseus, the results indicate that the north-eastern part presents an earlier chemical evolutionary stage (t < 1 Myr) than the south-western part (t ≥ 1–5 Myr). In Orion, for the only core where deuterated thioformaldehyde is detected, we have obtained a chemical age of t ≲ 0.5 Myr.
The theoretical study of deuterium fractionation (Dfrac) evolution has not only allowed us to analyse how the ratios HDCS/H2CS and D2CS/H2CS vary with time, but also with other parameters, such as density, temperature, initial sulphur depletion, and the CR ionisation rate. Our results confirm a strong dependence of Dfrac with time since it progressively increases with the evolution of the starless cores. This makes HDCS/H2CS and D2CS/H2CS powerful tools for deriving the chemical evolution of these regions. However, they cannot be used to derive the temperature of the starless cores since their value presents a double peak in two temperature ranges (Tgas ~ 7–11 K and Tgas ~ 15–19 K). On the other hand, our results also show that both deuterium fractionation ratios increase with the density of the region and with the degree of sulphur depletion. In particular, we find that decreasing the sulphur initial abundance from 1.5 × 10⁻⁵ (the solar elemental sulphur fractional abundance) to 1.5 × 10⁻⁷ leads to an increase by a factor of up to ~1.5 and ~2.5 in the maximum values of the HDCS/H2CS and D2CS/H2CS ratios, respectively. In any case, the comparison with the observations of the starless cores of our sample reveals that they are reproduced when the initial sulphur fractional abundance is as low as ≤1.5 × 10⁻⁶ (i.e. at least one order of magnitude lower than the solar elemental sulphur abundance), in agreement with previous GEMS results (e.g. Bulut et al. 2021; Navarro-Almaida et al. 2021). Regarding the CR ionisation rate, we find that its increase by one order of magnitude slows down the deuterium fraction evolution by a few million years.
Finally, we have also studied the main formation and destruction mechanisms of H2CS, HDCS, and D2CS using the Nautilus code. We have obtained that they are mainly formed through gas-phase reactions (double-replacement reactions and neutral–neutral displacement reactions). By contrast, grain chemistry (depletion) has an important role in the destruction of these species, especially at t > 104 yr.
We finally stress that this work has allowed the sulphur chemistry in cold regions to be studied in detail through thioformaldehyde observations. We have also demonstrated the power of using its deuterated counterparts for the analysis of the properties and chemical evolution of starless cores.
Acknowledgements
We thank the Spanish MICINN for funding support from PID2019-106235GB-I00. L.M. acknowledges the financial support of DAE and DST-SERB research grants (SRG/2021/002116 and MTR/2021/000864) of the Government of India.
Appendix A Tables and figures
Observational parameters.
H2CS parameters from Gaussian fits.
HDCS parameters from Gaussian fits.
D2CS parameters from Gaussian fits.
Column densities, N, for H2CS, HDCS, and D2CS and the OPR obtained from H2CS.
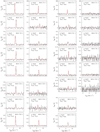 |
Fig. A.1 Observed lines of o-H2CS and p-H2CS in B 213-C1, C2, C5, C6, C7, C10, C12, and C16 (black), and the best fit (red). |
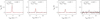 |
Fig. A.2 Observed lines of o-H2CS and p-H2CS in L 1448 (black), and the best fit (red). |
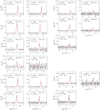 |
Fig. A.3 Observed lines of o-H2CS and p-H2CS in the core sample of NGC 1333 (black) and the best fit (red). |
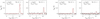 |
Fig. A.4 Observed lines of o-H2CS and p-H2CS in Barnard 5 (black) and the best fit (red). |
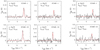 |
Fig. A.5 Observed lines of o-H2CS and p-H2CS in the core sample of IC 348 (black) and the best fit (red). |
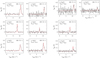 |
Fig. A.6 Observed lines of o-H2CS and p-H2CS in the core sample of Orion A (black) and the best fit (red). |
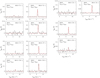 |
Fig. A.7 Observed lines of HDCS in B 213-C1, C2, C5, C6, C7, C10, and C16 (black) and the best fit (red). |
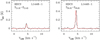 |
Fig. A.8 Observed lines of HDCS in L1448 (black) and the best fit (red). |
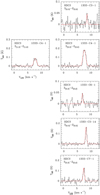 |
Fig. A.9 Observed lines of HDCS in the core sample of NGC 1333 (black) and the best fit (red). |
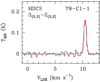 |
Fig. A.10 Observed line of HDCS in Barnard 5 (black) and the best fit (red). |
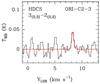 |
Fig. A.11 Observed line of HDCS in Orion A (black) and the best fit (red). |
 |
Fig. A.12 Observed lines of o-D2CS and p-D2CS in L1448 (black) and the best fit (red). |
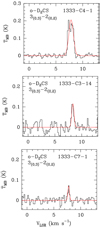 |
Fig. A.13 Observed lines of o-D2CS in the core sample of NGC 1333 (black) and the best fit (red). |
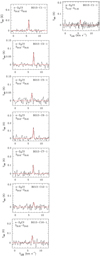 |
Fig. A.14 Observed lines of o-H2CS and p-H2CS in B 213-C1, C2, C5, C6, C7, C12, and C16 (black) and the best fit (red). |
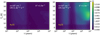 |
Fig. A.15 Evolution of the H2CS fractional abundance as a function of time for an initial sulphur abundance S+=1.5×10⁻⁷, a hydrogen number density nH=105 cm−3, and a CR ionisation rate ζ=1.3×10⁻¹⁷ s−1 (left) and ζ=1.3×10⁻¹⁶ s−1 (right). |
References
- Agúndez, M., & Wakelam, V. 2013, Chem. Rev., 113, 8710 [Google Scholar]
- Agúndez, M., Fonfria, J. P., Cernicharo, J., Pardo, J. R., & Guélin, M. 2008, A&A, 479, 493 [NASA ADS] [CrossRef] [EDP Sciences] [Google Scholar]
- Agúndez, M., Marcelino, N., Cernicharo, J., Roueff, E., & Tafalla, M. 2019, A&A, 625, A147 [Google Scholar]
- Aikawa, Y., Ohashi, N., & Herbst, E. 2003, ApJ, 593, 906 [NASA ADS] [CrossRef] [Google Scholar]
- André, P., Men'shchikov, A., Bontemps, S., et al. 2010, A&A, 518, L102 [CrossRef] [EDP Sciences] [Google Scholar]
- Asplund, M., Grevesse, N., Sauval, A. J., & Scott, P. 2009, ARA&A, 47, 481 [NASA ADS] [CrossRef] [Google Scholar]
- Bachiller, R., & Cernicharo, J. 1986, A&A, 166, 283 [NASA ADS] [Google Scholar]
- Bachiller, R., & Cernicharo, J. 1990, A&A, 239, 276 [NASA ADS] [Google Scholar]
- Bachiller, R., & Pérez Gutiérrez, M. 1997, ApJ, 487, L93 [Google Scholar]
- Bacmann, A., Lefloch, B., Ceccarelli, C., et al. 2003, ApJ, 585, L55 [NASA ADS] [CrossRef] [Google Scholar]
- Bally, J., Langer, W. D., Stark, A. A., & Wilson, R. W. 1987, ApJ, 312, L45 [NASA ADS] [CrossRef] [Google Scholar]
- Benson, P. J., & Myers, P. C. 1989, ApJS, 71, 89 [Google Scholar]
- Bergin, E. A., & Langer, W. D. 1997, ApJ, 486, 316 [Google Scholar]
- Bernard, J. P., Paradis, D., Marshall, D. J., et al. 2010, A&A, 518, L88 [NASA ADS] [CrossRef] [EDP Sciences] [Google Scholar]
- Blake, G. A., Sutton, E. C., Masson, C. R., & Phillips, T. G. 1987, ApJ, 315, 621 [Google Scholar]
- Boogert, A. C. A., Schutte, W. A., Helmich, F. P., Tielens, A. G. G. M., & Wooden, D. H. 1997, A&A, 317, 929 [NASA ADS] [Google Scholar]
- Brown, A. G. A., Hartmann, D., & Burton, W. B. 1995, A&A, 300, 903 [NASA ADS] [Google Scholar]
- Bulut, N., Roncero, O., Aguado, A., et al. 2021, A&A, 646, A5 [NASA ADS] [CrossRef] [EDP Sciences] [Google Scholar]
- Caselli, P., Walmsley, C. M., Terzieva, R., & Herbst, E. 1998, ApJ, 499, 234 [Google Scholar]
- Caselli, P., Walmsley, C. M., Tafalla, M., Dore, L., & Myers, P. C. 1999, ApJ, 523, L165 [Google Scholar]
- Caselli, P., Walmsley, C. M., Zucconi, A., et al. 2002, ApJ, 565, 331 [NASA ADS] [CrossRef] [Google Scholar]
- Caselli, P., Sipilä, O., & Harju, J. 2019, Phil. Trans. A R. Soc., 377, 20180401 [CrossRef] [Google Scholar]
- Cazaux, S., Carrascosa, H., Munoz Caro, G. M., et al. 2022, A&A, 657, A100 [NASA ADS] [CrossRef] [EDP Sciences] [Google Scholar]
- Ceccarelli, C., Caselli, P., Herbst, E., Tielens, A. G. G. M., & Caux, E. 2007, in Protostars and Planets V, eds. B. Reipurth, D. Jewitt, & K. Keil (Tucson: University of Arizona Press), 47 [Google Scholar]
- Ceccarelli, C., Caselli, P., Bockelée-Morvan, D., et al. 2014, in Protostars and Planets VI, eds. H. Beuther, R.S. Klessen, C.P. Dullemond, & T. Henning (Tucson: University of Arizona Press), 859 [Google Scholar]
- Codella, C., Bianchi, E., Podio, L., et al. 2021, A&A, 654, A52 [NASA ADS] [CrossRef] [EDP Sciences] [Google Scholar]
- Crapsi, A., Caselli, P., Walmsley, C. M., et al. 2005, ApJ, 619, 379 [Google Scholar]
- Crockett, N. R., Bergin, E. A., Neill, J. L., et al. 2014, ApJ, 781, 114 [NASA ADS] [CrossRef] [Google Scholar]
- Cuadrado, S., Goicoechea, J. R., Cernicharo, J., et al. 2017, A&A, 603, A124 [NASA ADS] [CrossRef] [EDP Sciences] [Google Scholar]
- Cummins, S. E., Linke, R. A., & Thaddeus, P. 1986, ApJS, 60, 819 [NASA ADS] [CrossRef] [Google Scholar]
- Curtis, E. I., Richer, J. S., Swift, J. J., & Williams, J. P. 2010, MNRAS, 408, 1516 [CrossRef] [Google Scholar]
- Dalgarno, A., & Lepp, S. 1984, ApJ, 287, L47 [NASA ADS] [CrossRef] [Google Scholar]
- Davis, C. J., Scholz, P., Lucas, P., Smith, M. D., & Adamson, A. 2008, MNRAS, 387, 954 [NASA ADS] [CrossRef] [Google Scholar]
- Davis, C. J., Chrysostomou, A., Hatchell, J., et al. 2010, MNRAS, 405, 759 [NASA ADS] [Google Scholar]
- Deeyamulla, M., & Husain, D. 2006, J. Photochem. Photobiol., A184, 347 [CrossRef] [Google Scholar]
- Doddipatla, S., He, C., Kaiser, R. I., et al. 2020, Proc. Natl. Acad. Sci, 117, 22712 [NASA ADS] [CrossRef] [Google Scholar]
- Drozdovskaya, M. N., van Dishoeck, E. F., Jørgensen, J. K., et al. 2018, MNRAS, 476, 4949 [Google Scholar]
- Druard, C., & Wakelam, V. 2012, MNRAS, 426, 354 [NASA ADS] [CrossRef] [Google Scholar]
- Dunham, M. M., Arce, H. G., Allen, L. E., et al. 2013, AJ, 145, 94 [Google Scholar]
- Emprechtinger, M., Caselli, P., Volgenau, N. H., Stutzki, J., & Wiedner, M. C. 2009, A&A, 493, 89 [NASA ADS] [CrossRef] [EDP Sciences] [Google Scholar]
- Esplugues, G. B., Tercero, B., Cernicharo, J., et al. 2013, A&A, 556, A143 [NASA ADS] [CrossRef] [EDP Sciences] [Google Scholar]
- Esplugues, G. B., Viti, S., Goicoechea, J. R., & Cernicharo, J. 2014, A&A, 567, A95 [NASA ADS] [CrossRef] [EDP Sciences] [Google Scholar]
- Fabricant, B., Krieger, D., & Muenter, J. S. 1977, J. Chem. Phys., 67, 1576 [NASA ADS] [CrossRef] [Google Scholar]
- Feng, S., Caselli, P., Wang, K., et al. 2019, ApJ, 883, 202 [NASA ADS] [CrossRef] [Google Scholar]
- Fontani, F., Palau, A., Caselli, P., et al. 2011, A&A, 529, L7 [NASA ADS] [CrossRef] [EDP Sciences] [Google Scholar]
- Francioso, A., Baseggio, A. C., Mosca, L., & Fontana, M. 2020, Oxidative Medicine and Cellular Longevity (UK: Hindawi), 8294158 [Google Scholar]
- Fuente, A., Navarro, D. G., Caselli, P., et al. 2019, A&A, 624, A105 [NASA ADS] [CrossRef] [EDP Sciences] [Google Scholar]
- Garrod, R. T., Wakelam, V., & Herbst, E. 2007, A&A, 467, 1103 [NASA ADS] [CrossRef] [EDP Sciences] [Google Scholar]
- Gatley, I., Becklin, E. E., Mattews, K., et al. 1974, ApJ, 191, L121 [Google Scholar]
- Geballe, T. R., Baas, F., Greenberg, J. M., & Schutte, W. 1985, A&A, 146, L6 [NASA ADS] [Google Scholar]
- Gerner, T., Shirley, Y. L., Beuther, H., et al. 2015, A&A, 579, A80 [NASA ADS] [CrossRef] [EDP Sciences] [Google Scholar]
- Goicoechea, J. R., & Cuadrado, S. 2021, A&A, 647, L7 [NASA ADS] [CrossRef] [EDP Sciences] [Google Scholar]
- Goldsmith, P. F., & Langer, W. D. 1978, ApJ, 222, 881 [Google Scholar]
- Goldsmith, P. F., Heyer, M., Narayanan, G., et al. 2008, ApJ, 680, 428 [Google Scholar]
- Goodman, A. A., Jones, T. J., Lada, E. A., & Myers, P. C. 1992, ApJ, 399, 108 [Google Scholar]
- Güver, T., & Özel, F. 2009, MNRAS, 400, 2050 [Google Scholar]
- Hacar, A., Tafalla, M., Kauffmann, J., & Kovâcs, A. 2013, A&A, 554, A55 [NASA ADS] [CrossRef] [EDP Sciences] [Google Scholar]
- Hacar, A., Alves, J., Burkert, A., & Goldsmith, P. 2016, A&A, 591, A104 [NASA ADS] [CrossRef] [EDP Sciences] [Google Scholar]
- Hartmann, L. 2002, ApJ, 578, 914 [Google Scholar]
- Hatchell, J., Thompson, M. A., Millar, T. J., & MacDonald, G. H. 1998, A&AS, 133, 29 [NASA ADS] [CrossRef] [EDP Sciences] [Google Scholar]
- Hatchell, J., Richer, J. S., Fuller, G. A., et al. 2005, A&A, 440, 151 [NASA ADS] [CrossRef] [EDP Sciences] [Google Scholar]
- Hatchell, J., Fuller, G. A., Richer, J. S., Harries, T. J., & Ladd, E. F. 2007, A&A, 468, 1009 [NASA ADS] [CrossRef] [EDP Sciences] [Google Scholar]
- Herbst, E., & van Dishoeck, E. F. 2009, ARA&A, 47, 427 [NASA ADS] [CrossRef] [Google Scholar]
- Hirota, T., & Yamamoto, S. 2006, ApJ, 646, 258 [Google Scholar]
- Howe, D. A., & Millar, T. J. 1993, MNRAS, 262, 868 [NASA ADS] [Google Scholar]
- Indriolo, N., & McCall, B. J. 2012, ApJ, 745, 91 [NASA ADS] [CrossRef] [Google Scholar]
- Irvine, W. M., Friberg, P., Kaifu, N., et al. 1989, ApJ, 342, 871 [NASA ADS] [CrossRef] [Google Scholar]
- Ivlev, A. V., Dogiel, V. A., Chernyshov, D. O., et al. 2018, ApJ, 855, 23 [NASA ADS] [CrossRef] [Google Scholar]
- Ivlev, A. V., Silsbee, K., Padovani, M., & Galli, D., 2021, ApJ, 909, 2 [NASA ADS] [CrossRef] [Google Scholar]
- Jiménez-Escobar, A., & Munoz Caro, G. M. 2011, A&A, 536, A91 [NASA ADS] [CrossRef] [EDP Sciences] [Google Scholar]
- Johnstone, D., & Bally, J. 1999, ApJ, 510, L49 [Google Scholar]
- Johnstone, D., & Bally, J. 2006, ApJ, 653, 383 [NASA ADS] [CrossRef] [Google Scholar]
- Kaifu, N., Ohishi, M., Kawaguchi, K., et al. 2004, PASJ, 56, 69 [Google Scholar]
- Kimura, H., Wada, K., Kobayashi, H., et al. 2020, MNRAS, 498, 1801 [Google Scholar]
- Kirk, J. M., Ward-Thompson, D., Palmeirim, P., et al. 2013, MNRAS, 432, 1424 [Google Scholar]
- Knee, L. B. G., & Sandell, G. 2000, A&A, 361, 671 [NASA ADS] [Google Scholar]
- Kutner, M. L., Evans, N. J.I., & Tucker, K. D. 1976, ApJ, 209, 452 [NASA ADS] [CrossRef] [Google Scholar]
- Laas, J. C., & Caselli, P. 2019, A&A, 624, A108 [NASA ADS] [CrossRef] [EDP Sciences] [Google Scholar]
- Lada, C. J., Alves, J., & Lada, E. A. 1996, AJ, 111, 1964 [Google Scholar]
- Ladd, E. F., Lada, E. A., & Myers, P. C. 1993, ApJ, 410, 168 [NASA ADS] [CrossRef] [Google Scholar]
- Ladd, E. F., Myers, P. C., & Goodman, A. A. 1994, ApJ, 433, 117 [NASA ADS] [CrossRef] [Google Scholar]
- Langer, W. D., Velusamy, T., & Xie, T. 1996, ApJ, 468, L41 [NASA ADS] [CrossRef] [Google Scholar]
- Leustek, T. 2002, Arabidopsis Book, 1, e0017 [CrossRef] [Google Scholar]
- Linsky, J. L., Draine, B. T., Moos, H. W., et al. 2006, ApJ, 647, 1106 [Google Scholar]
- Lombardi, M., Bouy, H., Alves, J., & Lada, C. J. 2014, A&A, 568, C1 [Google Scholar]
- Luhman, K. L., Stauffer, J. R., Muench, A. A., et al. 2003, ApJ, 593, 1093 [Google Scholar]
- Lynds, B. T. 1962, ApJS, 7, 1 [NASA ADS] [CrossRef] [Google Scholar]
- Maddalena, R. J., Morris, M., Moscowitz, J., & Thaddeus, P. 1986, ApJ, 303, 375 [NASA ADS] [CrossRef] [Google Scholar]
- Majumdar, L., Gratier, P., Ruaud, M., et al. 2017, MNRAS, 466, 4470 [Google Scholar]
- Malinen, J., Juvela, M., Rawlings, M. G., et al. 2012, A&A, 544, A50 [NASA ADS] [CrossRef] [EDP Sciences] [Google Scholar]
- Marcelino, N., Cernicharo, J., Roueff, E., Gerin, M., & Mauersberger, R. 2005, ApJ, 620, 308 [NASA ADS] [CrossRef] [Google Scholar]
- Martín-Doménech, R., Jiménez-Serra, I., Munoz Caro, G. M., et al. 2016, A&A, 585, A112 [NASA ADS] [CrossRef] [EDP Sciences] [Google Scholar]
- Millar, T. J. 2005, Astron. Geophys., 46, 2.29 [NASA ADS] [CrossRef] [Google Scholar]
- Millar, T. J., Bennett, A., & Herbst, E. 1989, ApJ, 340, 906 [NASA ADS] [CrossRef] [Google Scholar]
- Minh, Y. C., Brewer, M. K., Irvine, W. M., Friberg, P., & Johansson, L. E. B. 1991, A&A, 244, 470 [NASA ADS] [Google Scholar]
- Minh, Y. C., Liu, H. B., Galvan-Madrid, R., et al. 2018, ApJ, 864, 102 [NASA ADS] [CrossRef] [Google Scholar]
- Minowa, H., Satake, M., Hirota, T., et al. 1997, ApJ, 491, L63 [NASA ADS] [CrossRef] [Google Scholar]
- Molinari, A., & Ricci, R. A. 1986, in From nuclei to stars. A meeting in nuclear physics and astrophysics exploring the path opened by H.A. Berthe, International School of Physics Enrico Fermi, Course XCI, 91 [Google Scholar]
- Molinari, S., Swinyard, B., Bally, J., et al. 2010, A&A, 518, L100 [NASA ADS] [CrossRef] [EDP Sciences] [Google Scholar]
- Moscoso, J., de Souza, R. S., Coc, A., & Iliadis, C. 2021, ApJ, 923, 49 [NASA ADS] [CrossRef] [Google Scholar]
- Myers, P. C. 2009, ApJ, 700, 1609 [Google Scholar]
- Navarro-Almaida, D., Le Gal, R., Fuente, A., et al. 2020, A&A, 637, A39 [NASA ADS] [CrossRef] [EDP Sciences] [Google Scholar]
- Navarro-Almaida, D., Fuente, A., Majumdar, L., et al. 2021, A&A, 653, A15 [NASA ADS] [CrossRef] [EDP Sciences] [Google Scholar]
- Neufeld, D. A., & Wolfire, M. G. 2017, ApJ, 845, 163 [Google Scholar]
- Neufeld, D. A., Gusdorf, A., Güsten, R., et al. 2014, ApJ, 781, 102 [NASA ADS] [CrossRef] [Google Scholar]
- Neufeld, D. A., Godard, B., Gerin, M., et al. 2015, A&A, 577, A49 [NASA ADS] [CrossRef] [EDP Sciences] [Google Scholar]
- Ohishi, M., & Kaifu, N. 1998, Faraday Discuss., 109, 205 [NASA ADS] [CrossRef] [Google Scholar]
- Oliveira, C. M., Hébrard, G., Howk, J. C., et al. 2003, ApJ, 587, 235 [NASA ADS] [CrossRef] [Google Scholar]
- Onishi, T., Mizuno, A., Kawamura, A., Tachihara, K., & Fukui, Y. 2002, ApJ, 575, 950 [NASA ADS] [CrossRef] [Google Scholar]
- Padovani, M., Hennebelle, P., & Galli, D. 2013, A&A, 560, A114 [NASA ADS] [CrossRef] [EDP Sciences] [Google Scholar]
- Palla, F., & Stahler, S. W. 2002, ApJ, 581, 1194 [NASA ADS] [CrossRef] [Google Scholar]
- Palmeirim, P., André, P., Kirk, J., et al. 2013, A&A, 550, A38 [NASA ADS] [CrossRef] [EDP Sciences] [Google Scholar]
- Palumbo, M. E., Tielens, A. G. G. M., & Tokunaga, A. T. 1995, ApJ, 449, 674 [NASA ADS] [CrossRef] [Google Scholar]
- Palumbo, M. E., Geballe, T. R., & Tielens, A. G. G. M. 1997, ApJ, 479, 839 [NASA ADS] [CrossRef] [Google Scholar]
- Parise, B., Leurini, S., Schilke, P., et al. 2009, A&A, 508, 737 [NASA ADS] [CrossRef] [EDP Sciences] [Google Scholar]
- Pineda, J. E., Caselli, P., & Goodman, A. A. 2008, ApJ, 679, 481 [Google Scholar]
- Pineda, J. E., Goodman, A. A., Arce, H. G., et al. 2010, ApJ, 712, L116 [Google Scholar]
- Pineda, J. E., Goodman, A. A., Arce, H. G., et al. 2011, ApJ, 739, L2 [NASA ADS] [CrossRef] [Google Scholar]
- Plunkett, A. L., Arce, H. G., Corder, S. A., et al. 2013, ApJ, 774, 22 [NASA ADS] [CrossRef] [Google Scholar]
- Prasad, S. S., & Huntress, W. T., J. 1982, ApJ, 260, 590 [NASA ADS] [CrossRef] [Google Scholar]
- Punanova, A., Caselli, P., Pineda, J. E., et al. 2018, A&A, 617, A27 [NASA ADS] [CrossRef] [EDP Sciences] [Google Scholar]
- Qian, L., Li, D., Offner, S., & Pan, Z. 2015, ApJ, 811, 71 [Google Scholar]
- Redaelli, E., Sipilä, O., Padovani, M., et al. 2021, A&A, 656, A109 [NASA ADS] [CrossRef] [EDP Sciences] [Google Scholar]
- Rivière-Marichalar, P., Fuente, A., Goicoechea, J. R., et al. 2019, A&A, 628, A16 [Google Scholar]
- Roberts, H., & Millar, T. J. 2000, A&A, 361, 388 [NASA ADS] [Google Scholar]
- Roberts, H., Herbst, E., & Millar, T. J. 2003, ApJ, 591, L41 [CrossRef] [Google Scholar]
- Roccatagliata, V., Franciosini, E., Sacco, G. G., Randich, S., & Sicilia-Aguilar, A. 2020, A&A, 638, A85 [NASA ADS] [CrossRef] [EDP Sciences] [Google Scholar]
- Rodríguez-Baras, M., Fuente, A., Riviére-Marichalar, P., et al. 2021, A&A, 648, A120 [NASA ADS] [CrossRef] [EDP Sciences] [Google Scholar]
- Roueff, E., & Gerin, M. 2003, Space Sci. Rev., 106, 61 [NASA ADS] [CrossRef] [Google Scholar]
- Roueff, E., Parise, B., & Herbst, E. 2007, A&A, 464, 245 [NASA ADS] [CrossRef] [EDP Sciences] [Google Scholar]
- Ruaud, M., Wakelam, V., & Hersant, F. 2016, MNRAS, 459, 3756 [Google Scholar]
- Ruffle, D. P., Hartquist, T. W., Caselli, P., & Williams, D. A. 1999, MNRAS, 306, 691 [Google Scholar]
- Sakai, T., Sakai, N., Furuya, K., et al. 2012, ApJ, 747, 140 [NASA ADS] [CrossRef] [Google Scholar]
- Schmalzl, M., Kainulainen, J., Quanz, S. P., et al. 2010, ApJ, 725, 1327 [NASA ADS] [CrossRef] [Google Scholar]
- Shimajiri, Y., Kitamura, Y., Nakamura, F., et al. 2015, ApJS, 217, 7 [NASA ADS] [CrossRef] [Google Scholar]
- Shingledecker, C. N., Lamberts, T., Laas, J. C., et al. 2020, ApJ, 888, 52 [Google Scholar]
- Shu, F. H., Adams, F. C., & Lizano, S. 1987, ARA&A, 25, 23 [Google Scholar]
- Sinclair, M. W., Fourikis, N., Ribes, J. C., et al. 1973, Austr. J. Phys., 26, 85 [NASA ADS] [CrossRef] [Google Scholar]
- Soler, J. D. 2019, A&A, 629, A96 [NASA ADS] [CrossRef] [EDP Sciences] [Google Scholar]
- Spezzano, S., Fuente, A., Caselli, P., et al. 2022, A&A, 657, A10 [NASA ADS] [CrossRef] [EDP Sciences] [Google Scholar]
- Tatematsu, K., Umemoto, T., Kandori, R., & Sekimoto, Y. 2004, ApJ, 606, 333 [NASA ADS] [CrossRef] [Google Scholar]
- Treviño-Morales, S. P., Pilleri, P., Fuente, A., et al. 2014, A&A, 569, A19 [NASA ADS] [CrossRef] [EDP Sciences] [Google Scholar]
- Tsujimoto, T., & Bland-Hawthorn, J. 2010, Front. Astron. Space Sci., 268, 499 [NASA ADS] [Google Scholar]
- van der Tak, F.F.S., & van Dishoeck, E. F. 2000, A&A, 358, L79 [NASA ADS] [Google Scholar]
- van der Tak, F. F. S., Black, J. H., Schöier, F. L., et al. 2007, A&A, 468, 627 [NASA ADS] [CrossRef] [EDP Sciences] [Google Scholar]
- van Dishoeck, E. F., & Blake, G. A. 1998, ARA&A, 36, 317 [Google Scholar]
- Vastel, C., Quénard, D., Le Gal, R., et al. 2018, MNRAS, 478, 5514 [Google Scholar]
- Vidal, T. H. G., Loison, J.-C., Jaziri, A. Y., et al. 2017, MNRAS, 469, 435 [Google Scholar]
- Wakelam, V., Castets, A., Ceccarelli, C., et al. 2004, A&A, 413, 609 [NASA ADS] [CrossRef] [EDP Sciences] [Google Scholar]
- Walawender, J., Bally, J., Kirk, H., & Johnstone, D. 2005, AJ, 130, 1795 [NASA ADS] [CrossRef] [Google Scholar]
- Walmsley, C. M., Flower, D. R., & Pineau des Forêts, G. 2004, A&A, 418, 1035 [NASA ADS] [CrossRef] [EDP Sciences] [Google Scholar]
- Wiesenfeld, L., & Faure, A. 2013, MNRAS, 432, 2573 [NASA ADS] [CrossRef] [Google Scholar]
- Wilking, B. A., Meyer, M. R., Greene, T. P., Mikhail, A., & Carlson, G. 2004, AJ, 127, 1131 [NASA ADS] [CrossRef] [Google Scholar]
- Wilson, R. W., Jefferts, K. B., & Penzias, A. A. 1970, ApJ, 161, L43 [NASA ADS] [CrossRef] [Google Scholar]
- Wootten, A., & Mangum, J. 2009, ASP Conf. Ser., 417, 219 [NASA ADS] [Google Scholar]
- Yan, Q.-Z., Zhang, B., Xu, Y., et al. 2019, A&A, 624, A6 [NASA ADS] [CrossRef] [EDP Sciences] [Google Scholar]
- Yang, Y.-L., Sakai, N., Zhang, Y., et al. 2021, ApJ, 913, 155 [NASA ADS] [CrossRef] [Google Scholar]
- Zari, E., Lombardi, M., Alves, J., Lada, C. J., & Bouy, H. 2016, A&A, 587, A106 [NASA ADS] [CrossRef] [EDP Sciences] [Google Scholar]
- Zari, E., Hashemi, H., Brown, A. G. A., Jardine, K., & de Zeeuw, P. T. 2018, A&A, 620, A172 [NASA ADS] [CrossRef] [EDP Sciences] [Google Scholar]
- Zasowski, G., Kemper, F., Watson, D. M., et al. 2009, ApJ, 694, 459 [CrossRef] [Google Scholar]
- Zucker, C., Speagle, J. S., Schlafly, E. F., et al. 2019, ApJ, 879, 125 [NASA ADS] [CrossRef] [Google Scholar]
- Zucker, C., Speagle, J. S., Schlafly, E. F., et al. 2020, A&A, 633, A51 [NASA ADS] [CrossRef] [EDP Sciences] [Google Scholar]
Obtained by Palmeirim et al. (2013), Lombardi et al. (2014), and Zari et al. (2016) on the basis of the Herschel Gould Belt Survey (André et al. 2010) and Planck data (Bernard et al. 2010).
All Tables
All Figures
|
Fig. 1 B 213 molecular hydrogen column density maps as derived by Palmeirim et al. (2013), reconstructed at an angular resolution of 18.2″. A general view of the region is shown in the top-right panel, and main regions of interest are enlarged. Contours are (3, 6, 9, 12, 15, 20, and 25) × 1021 cm−2. Positions observed by GEMS with the 30 m telescope are indicated with white triangles. Red circles represent the position of the starless cores. Labels in red indicate the cut IDs. See Table 1 for further details. |
| In the text | |
|
Fig. 2 Perseus filament (from right to left and top to bottom: NGC 1333, IC 348, L 1448, and B 5) dust opacity maps at 850 µm by Zari et al. (2016), convolved at an angular resolution of 36″. Contours are (0.056, 0.13, 0.24, 0.56, 1.01, and 1.6) × 1021 cm−2, which, according to Eq. (7) from Zari et al. (2016), corresponds to visual extinctions of ~5, 7.5, 10, 15, 20, and 25 mag, respectively. Positions observed with the 30 m telescope are indicated with white triangles. Red circles represent the positions of the starless cores. |
| In the text | |
|
Fig. 3 Orion dust opacity map at 850 µm by Lombardi et al. (2014), convolved at an angular resolution of 36″. Contours are (0.056, 0.24, 0.56, 1.36, and 1.61) × 1021 cm−2, which, according to Lombardi et al. (2014), correspond to visual extinctions of ~1.3, 5.6, 13.2, 23.8, and 38 mag. Positions observed with the 30m telescope are indicated with white triangles. Red circles represent the positions of the starless cores. Labels in red indicate the cut IDs (see Table 1). |
| In the text | |
|
Fig. 4 Fractional abundances of H2CS, HDCS, and D2CS with respect to total H nuclei for the core sample. |
| In the text | |
|
Fig. 5 Deuterium fractionation ratios in different interstellar sources. References are (Minowa et al. 1997) for TMC-1, (Irvine et al. 1989) for L183, (Marcelino et al. 2005 for Barnard 1, (Agúndez et al. 2019) for L 483, (Drozdovskaya et al. 2018) for IRAS 16293-2422, (Rivière-Marichalar et al. 2019) for the Horeshead PDR, and (Minh et al. 2018) for G33.92+0.11. |
| In the text | |
|
Fig. 6 Evolution of the HDCS/H2CS ratio (colour bar) as a function of time and temperature for a CR ionisation rate ξ = 1.3 × 10⁻¹⁷ s−1, a hydrogen number density nH = 105, 106, and 107 cm−3, and an initial sulphur abundance S+ = 1.5 × 10⁻⁵, 1.5 × 10⁻⁶, and 1.5 × 10⁻⁷. |
| In the text | |
|
Fig. 7 Evolution of the D2CS/H2CS ratio (colour bar) as a function of time and temperature for a CR ionisation rate ξ =1.3 × 10⁻¹⁷ s−1, a hydrogen number density nH = 105, 106, and 107 cm−3, and an initial sulphur abundance S+ = 1.5 × 10⁻⁵, 1.5 × 10⁻⁶, and 1.5 × 10⁻⁷. |
| In the text | |
|
Fig. 8 Evolution of the HDCS/H2CS (left) and D2CS ratio (right) as a function of time and temperature for an initial sulphur fractional abundance S+ = 1.5 × 10⁻⁷, a hydrogen number density nH = 106 cm−3, and a CR ionisation rate ζ = 1 × 10⁻¹⁶ (bottom row) and 1.3 × 10⁻¹⁷ s−1 (top row). |
| In the text | |
|
Fig. 9 Main chemical reaction rates forming (top) and destroying (bottom) H2CS. |
| In the text | |
|
Fig. 10 Main chemical reaction rates forming (top) and destroying (bottom) HDCS. |
| In the text | |
|
Fig. 11 Main chemical reaction rates forming (top) and destroying (bottom) D2CS. |
| In the text | |
|
Fig. A.1 Observed lines of o-H2CS and p-H2CS in B 213-C1, C2, C5, C6, C7, C10, C12, and C16 (black), and the best fit (red). |
| In the text | |
|
Fig. A.2 Observed lines of o-H2CS and p-H2CS in L 1448 (black), and the best fit (red). |
| In the text | |
|
Fig. A.3 Observed lines of o-H2CS and p-H2CS in the core sample of NGC 1333 (black) and the best fit (red). |
| In the text | |
|
Fig. A.4 Observed lines of o-H2CS and p-H2CS in Barnard 5 (black) and the best fit (red). |
| In the text | |
|
Fig. A.5 Observed lines of o-H2CS and p-H2CS in the core sample of IC 348 (black) and the best fit (red). |
| In the text | |
|
Fig. A.6 Observed lines of o-H2CS and p-H2CS in the core sample of Orion A (black) and the best fit (red). |
| In the text | |
|
Fig. A.7 Observed lines of HDCS in B 213-C1, C2, C5, C6, C7, C10, and C16 (black) and the best fit (red). |
| In the text | |
|
Fig. A.8 Observed lines of HDCS in L1448 (black) and the best fit (red). |
| In the text | |
|
Fig. A.9 Observed lines of HDCS in the core sample of NGC 1333 (black) and the best fit (red). |
| In the text | |
|
Fig. A.10 Observed line of HDCS in Barnard 5 (black) and the best fit (red). |
| In the text | |
|
Fig. A.11 Observed line of HDCS in Orion A (black) and the best fit (red). |
| In the text | |
|
Fig. A.12 Observed lines of o-D2CS and p-D2CS in L1448 (black) and the best fit (red). |
| In the text | |
|
Fig. A.13 Observed lines of o-D2CS in the core sample of NGC 1333 (black) and the best fit (red). |
| In the text | |
|
Fig. A.14 Observed lines of o-H2CS and p-H2CS in B 213-C1, C2, C5, C6, C7, C12, and C16 (black) and the best fit (red). |
| In the text | |
|
Fig. A.15 Evolution of the H2CS fractional abundance as a function of time for an initial sulphur abundance S+=1.5×10⁻⁷, a hydrogen number density nH=105 cm−3, and a CR ionisation rate ζ=1.3×10⁻¹⁷ s−1 (left) and ζ=1.3×10⁻¹⁶ s−1 (right). |
| In the text | |
Current usage metrics show cumulative count of Article Views (full-text article views including HTML views, PDF and ePub downloads, according to the available data) and Abstracts Views on Vision4Press platform.
Data correspond to usage on the plateform after 2015. The current usage metrics is available 48-96 hours after online publication and is updated daily on week days.
Initial download of the metrics may take a while.