Fig. 1
Download original image
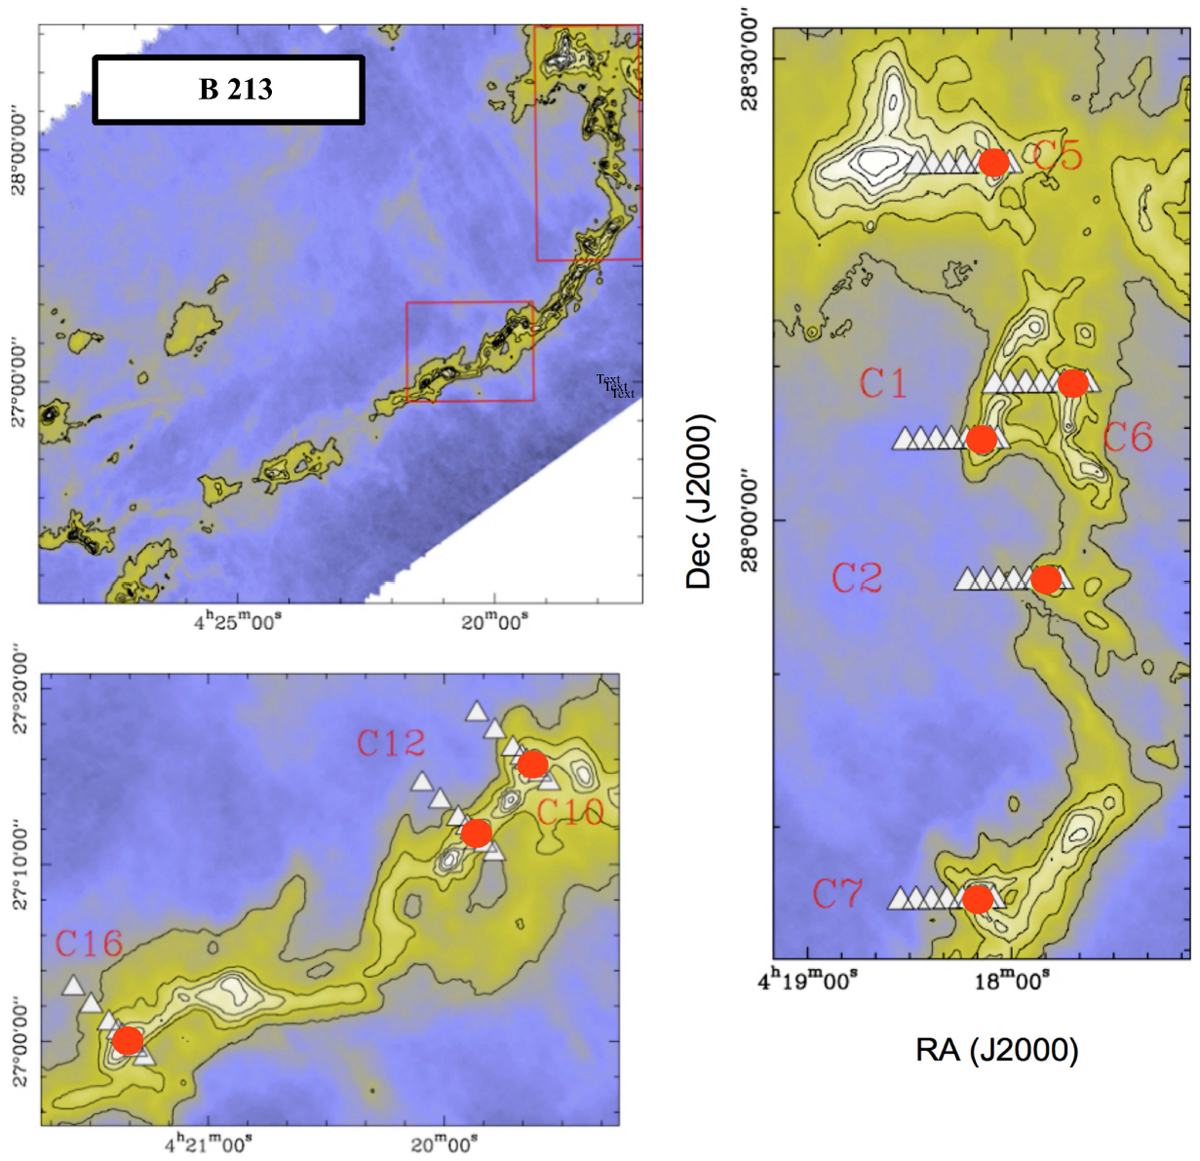
B 213 molecular hydrogen column density maps as derived by Palmeirim et al. (2013), reconstructed at an angular resolution of 18.2″. A general view of the region is shown in the top-right panel, and main regions of interest are enlarged. Contours are (3, 6, 9, 12, 15, 20, and 25) × 1021 cm−2. Positions observed by GEMS with the 30 m telescope are indicated with white triangles. Red circles represent the position of the starless cores. Labels in red indicate the cut IDs. See Table 1 for further details.
Current usage metrics show cumulative count of Article Views (full-text article views including HTML views, PDF and ePub downloads, according to the available data) and Abstracts Views on Vision4Press platform.
Data correspond to usage on the plateform after 2015. The current usage metrics is available 48-96 hours after online publication and is updated daily on week days.
Initial download of the metrics may take a while.