Fig. 3
Download original image
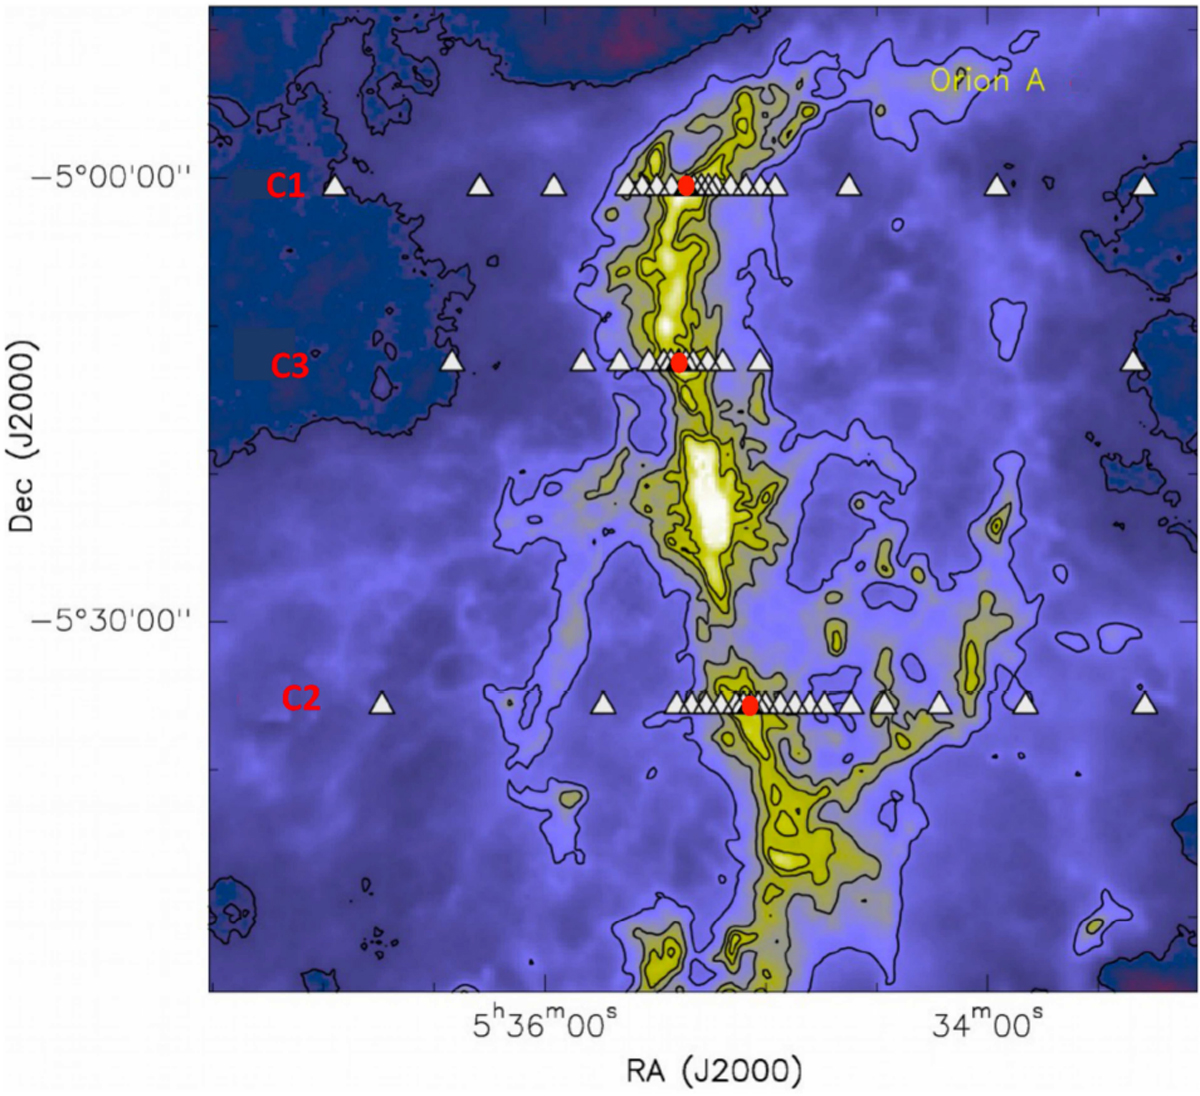
Orion dust opacity map at 850 µm by Lombardi et al. (2014), convolved at an angular resolution of 36″. Contours are (0.056, 0.24, 0.56, 1.36, and 1.61) × 1021 cm−2, which, according to Lombardi et al. (2014), correspond to visual extinctions of ~1.3, 5.6, 13.2, 23.8, and 38 mag. Positions observed with the 30m telescope are indicated with white triangles. Red circles represent the positions of the starless cores. Labels in red indicate the cut IDs (see Table 1).
Current usage metrics show cumulative count of Article Views (full-text article views including HTML views, PDF and ePub downloads, according to the available data) and Abstracts Views on Vision4Press platform.
Data correspond to usage on the plateform after 2015. The current usage metrics is available 48-96 hours after online publication and is updated daily on week days.
Initial download of the metrics may take a while.