| Issue |
A&A
Volume 660, April 2022
|
|
|---|---|---|
| Article Number | A112 | |
| Number of page(s) | 5 | |
| Section | Cosmology (including clusters of galaxies) | |
| DOI | https://doi.org/10.1051/0004-6361/202142313 | |
| Published online | 21 April 2022 | |
X-ray characterisation of the massive galaxy cluster ClG J104803.7+313843 at z = 0.76 with XMM-Newton
1
INAF – Istituto di Astrofisica Spaziale e Fisica Cosmica di Milano, Via A. Corti 12, 20133 Milano, Italy
e-mail: This email address is being protected from spambots. You need JavaScript enabled to view it.
2
INAF – Osservatorio Astronomico di Brera, Via E. Bianchi 46, 23807 Merate (LC), Italy
3
INAF – Osservatorio Astronomico di Roma, Via di Frascati 33, 00078 Monte Porzio Catone, Italy
4
Dipartimento di Fisica, Università di Roma “Tor Vergata”, Via della Ricerca Scientifica 1, 00133 Roma, Italy
Received:
27
September
2021
Accepted:
30
November
2021
Abstract
We present the characterisation of the massive cluster ClG J104803.7+313843 at z = 0.76 performed using a serendipitous XMM-Newton observation. High redshift and massive objects represent an ideal laboratory to benchmark our understanding of how clusters form and assembly formation is mainly driven by gravity. Leveraging the high throughput of XMM-Newton we were firstly able to determine the redshift of the object, shedding light on ambiguous photometric redshift associations. We investigated the morphology of this cluster which shows signs of merging activities in the outskirts and a flat core. We also measured the radial density profile up to R500. With these quantities in hand, we were able to determine the mass, M500 = 5.64−0.62+0.79 × 10¹⁴ M⊙, using the YX proxy. This quantity improves the previous measurement of the mass of this object by a factor of ∼3.5. The characterisation of one cluster at such a mass and redshift regime is fundamental as these objects are intrinsically rare, with the number of objects discovered so far being less than ∼25. Our study highlights the importance of using X-ray observations in combination with ancillary multi-wavelength data to improve our understanding of high-z and massive clusters.
Key words: X-rays: galaxies: clusters / galaxies: clusters: intracluster medium / galaxies: clusters: general / large-scale structure of Universe
© ESO 2022
1. Introduction
Galaxy clusters are fundamental tools to test the standard Λ cold-dark-matter (ΛCDM) paradigm for structure formation. Their abundance as a function of time is sensitive to the underlying cosmology (e.g., Vikhlinin et al. 2009; Allen et al. 2011). Furthermore, the dark matter (DM) density profile shape probes the gravitational collapse history. In the standard scenario, the collapse of DM is gravity-driven and hence scale-free.
The success of galaxy clusters in helping to establish the current understanding of the Universe, from the existence and nature of DM (Zwicky 1933; Clowe et al. 2006) amidst cosmological models being ruled out, just as the model with a critical matter density (White et al. 1993), and to the constraints to the ΛCDM model (e.g. Allen et al. 2004; Vikhlinin et al. 2009; Mantz et al. 2010) have been based upon observations of the most massive clusters, M500 > 5 × 10¹⁴ M⊙1, at relatively low redshifts where well characterised samples with high quality observations exist. The investigation of massive clusters at high redshifts has potential to progress our understanding. Within the cosmological context, the sensitivity of the evolution of the cluster mass function is enhanced at the high mass end. Furthermore, the abundance of the most extreme massive clusters is sensitive to the details of the initial fluctuations from inflation, for instance the existence of high mass, high redshift clusters can be used to identify deviations from ΛCDM (e.g., Harrison & Coles 2011; Harrison & Hotchkiss 2013)
Recent works obtained surprising results using high redshift objects. McDonald et al. (2017) have shown the remarkable stability of cool core clusters using the stacking a sample of 139 clusters in the redshift range 0.025 < z < 1.2 in five redshift bins. On the simulation side, Le Brun et al. (2018) studied the evolution of the DM profiles of the most massive clusters, M > 5.5 × 10¹⁴ M⊙, extracted from a large suite of cosmological simulations and found little evolution with redshift. Bartalucci et al. (2018) started to test these predictions by measuring the hydrostatic mass of five massive objects at z ∼ 0.9 out to R500. Unfortunately, high redshift and massive objects are intrinsically rare. Furthermore, X-ray observations are extremely challenging because of the cosmological dimming.
The importance of the difficult task to detect and characterise clusters has motivated a substantial effort to be made at various wavelengths: through X-rays with ROSAT (e.g., Rosati et al. 1998; Ebeling et al. 2001) and XMM-Newton (e.g., Fassbender et al. 2011; Willis et al. 2013), through optical and infrared data (e.g., SPARCS: Muzzin et al. 2009 and MADCoWS: Gonzalez et al. 2019), and through the Sunyaev–Zel’Dovich effect (SZ, Sunyaev & Zeldovich 1980) with a large portion of the sky surveys such as the Planck all sky-survey (Planck Collaboration VIII 2011; Planck Collaboration XXXII 2015; Planck Collaboration XXVII 2016), the South Pole Telescope survey (SPT, Bleem et al. 2015), or the Atacama Cosmology Telescope (ACT, Hasselfield et al. 2013; Marriage et al. 2011). The leverage of these objects for astrophysical as well as cosmological purposes requires X-ray and optical follow-ups. Generally speaking, their fundamental quantities, such as M500 or the redshift, are affected by large uncertainties. Ideally, X-ray deep observations are required to obtain thermodynamic and dynamic radial profiles and fully exploit clusters as a cosmological probe (e.g., see Bartalucci et al. 2017, 2018, 2019). Such observations are extremely time-consuming and the construction of a sample of objects whose global quantities are well characterised is fundamental to carefully pick the objects.
In this context, we present the X-ray analysis of the cluster ClG-J104803.7+313843. This object is part of a sample of 44 candidate clusters presented in Buddendiek et al. (2015) which have been confirmed by an optical follow-up using the William Herschel Telescope (WHT) and the Large Binocular Telescope (LBT). The authors used the optical datasets to measure the redshift and the richness of these clusters, which were initially detected combining RASS and SDSS datasets. Furthermore, the authors analysed the SZ CARMA observations for 21 clusters, finding an SZ signature for 11 of them. The optical photometric redshift of ClG J104803.7+313843 is 0.75 and its mass estimated via the M − YSZ relation from the CARMA dataset is M500 = 9.8 ± 3.2 × 10¹⁴ M⊙. This objects falls within the field of view of the XMM-Newton observation ID 0843830401 targeting the AGN J104817.98+312905.8. Interestingly, this cluster has not been found by the full sky survey of Planck nor in any previous X-ray catalogue either; however, it appears as a candidate in the Combined Planck-RASS catalogue of X-ray-SZ clusters published by Tarrío et al. (2019) at z = 0.5.
The paper is organised as follows: the data preparation is presented in Sect. 2, we present the analysis of the cluster and the results in Sect. 3, and we discuss the results in Sect. 4. We adopt a flat ΛCDM cosmology with Ωm = 0.3, ΩΛ = 0.7, H0 = 70 km Mpc−1 s−1, and h(z) = (Ωm(1 + z)3 + ΩΛ)1/2 throughout. Uncertainties are given at the 68% confidence level (1σ). All fits were performed via χ2 minimisation.
2. Data preparation
The XMM-Newton observation ID 0843830401 (PI: Piconcelli) was taken using the European Photon Imaging Camera (EPIC, Strüder et al. 2001; Turner et al. 2001). The camera is formed by three detectors, MOS1, MOS2, and pn, which observe the same object simultaneously. This observation has an exposure time of 18 ks. We followed the reduction procedure detailed in Sect. 2.3 of Bartalucci et al. (2019) and report the main steps here briefly. The dataset has been reduced by applying the latest calibration files using the Science Analysis System (SAS)2 pipeline version 18.0 and calibration files available as of July 2021 by using emchain and epchain tools. Events for which the PATTERN keyword is >4 and >13 for MOS1, MOS2, and pn cameras, respectively, were removed from the analysis. We filtered the datasets from flares and we obtained a useful exposure time of 16.3 ks and 12.6 ks for MOS1, MOS2, and pn cameras, respectively. Exposure maps were computed using the SAS tool eexpmap and the vignetting was taken in account following the weighting scheme of Arnaud et al. (2001) and using the SAS tool evigweight. At the end of these steps, we combined the datasets from the three detectors to maximise the statistic. We identified point sources using the multi-resolution wavelet software by Starck et al. (1998) and masked them out from the analysis.
X-ray observations are affected by the sky and the instrumental background. The latter component is formed by the interaction of high energy particles with the detectors and it was removed following the procedure described in Sect. 3.1 of Bartalucci et al. (2018). Briefly, we subtracted the particle background by using tailored instrumental background datasets. The sky background that affects X-ray observations was removed differently for the imaging, that is to say the surface brightness profile and spectroscopy analysis. For this reason, we explain these procedures in Sect. 3. This component was formed by the Galaxy thermal emission and the superimposed emission of all the unresolved point sources, namely the cosmic X-ray background (Lumb et al. 2002; Kuntz & Snowden 2000; Giacconi et al. 2001).
We also performed the wavelet filtering of the exposure-corrected and background-subtracted image in the [0.5−2.5] keV band using a soft 3σ thresholding of B3-spline wavelet coefficients, the significance thresholds being computed from Poissonian realisations of the image, following the stabilisation scheme of Zhang et al. (2008) and the procedures described in Bourdin & Mazzotta (2008). The wavelet filtered image is shown in the right panel of Fig. 1.
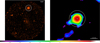 |
Fig. 1. Left panel: background-subtracted and exposure-corrected image in the [0.5−2.5] keV band of the full field of view of the XMM-Newton observation used in this work. This image was obtained by combining the three EPIC cameras. The cluster is in the NW sector. The white circle encompasses R500 derived using the YX proxy, assuming self-similar evolution, as described in Sect. 3.4. Right panel: wavelet filtered image of the cluster in the [0.5−2.5] keV band. The emission shown is detected at a significance level greater than 3σ. The white circle is the same as in the left panel. The colour bar refers to the count level of the wavelet filtered image. |
3. Cluster analysis
3.1. Morphology
In the left panel of Fig. 1, we show the exposure-corrected and background-subtracted image of the field of view containing the cluster ClG J104803.7+313843. The object is located in the NW sector and is ∼9 arcmin off-axis from the centre of the observation. We firstly determined the position of the X-ray peak by determining the maximum in the count-rate image in the [0.3−2.5] keV band after being smoothed using a two-dimensional Gaussian kernel with a width of 4 pixels. The coordinates are reported in Table 1.
Observational and global properties of the cluster analysed in this work.
We show the results of the wavelet filtered map in the right panel of Fig. 1. There are two behaviours regarding the morphology of the cluster. The inner part of the object within ∼1.5 arcmin appears to be quite regular showing a roundish shape with a moderately bright core. We used the ratio of the flux computed within fixed apertures, CSB, to measure the concentration of the cluster using the technique described in Sect. 4.2 of Bartalucci et al. (2019) and we obtain CSB = 0.22 ± 0.02. The PSF was accounted for in the calculation using the model of Ghizzardi (2001). Generally speaking, clusters are considered to be concentrated and possible candidates to host a cool-core if the CSB > 0.3 (e.g., see Bartalucci et al. 2019 and references therein). The morphology appears to be more irregular at large scales, with the shape being ellipsoidal and elongated along the NW–SE direction. There are two faint substructures appearing in the S and SE sectors. The X-ray morphology is consistent with the SZ morphology of the CARMA data shown in Fig. D1 of Buddendiek et al. (2015).
3.2. Redshift confirmation
The redshift of a cluster can be determined by X-ray measuring the shift of the 7 keV iron line, successfully performed in Yu et al. (2011) and Planck Collaboration XXVI (2011), for example. Generally speaking, this measurement is particularly challenging because at such energy, the effective area of an X-ray telescope is particularly low. However, the effective energy of this line for a high-redshift object is moved towards lower energies where the effective area is significantly higher and thus the statistic can be sufficient in determining the position of the line and thus the redshift. This offers a unique opportunity to confirm the redshift of ClG J104803.7+313843 and to benchmark the X-ray capabilities.
The spectral analysis to determine the redshift is as follows. We defined a circular region centred on the X-ray peak whose radius is defined to maximise the S/N. We extracted the spectrum from each of the three detectors following the procedures described in Pratt et al. (2010) and Sect. 3.4 of Bartalucci et al. (2017). The spectra were subtracted from the instrumental background using the tailored background datasets. The sky background was estimated modelling the emission of the sky in a region free from cluster emission with two unabsorbed APEC thermal models plus an absorbed power law with a fixed slope of Γ = 1.42. The best-fitting model was re-normalised by the ratio of the extraction areas and added as an extra component in the fit. We then fitted the instrumental background-subtracted spectrum of each camera simultaneously using an absorbed APEC model plus the sky re-normalised model. The parameters that are free in the fit procedure are the normalisation, the temperature and the redshift of the APEC model. The absorption was folded in using the absorption cross-section of Morrison & McCammon (1983) and fixing the Hydrogen column density to NH = 2.13 × 1020 cm−2, as determined from the Kalberla et al. (2005) survey. The abundance was fixed to 0.3. The fit of the redshift yields  , which is in good agreement with the photometric redshift zphot = 0.75 ± 0.047. We used this result for the entire analysis reported. The result of the fit is shown in Fig. 2. Each camera spectrum is shown with different colours and the corresponding model comprising the cluster emission and the sky background is shown with a solid model. The line is visible and its position is highlighted by the black arrow.
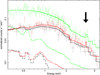 |
Fig. 2. Particle background-subtracted spectra extracted from the circular region centred on the X-ray peak of the cluster whose radius is defined to maximise the signal-to-noise ratio. The black, red, and green points represent the spectrum extracted from the MOS1, MOS2, and pn camera, respectively. The solid lines represent the model used to fit the spectra and their colour legend is the same as the points. The dash-dotted lines represent the sky background component. The arrow highlights the position of the iron line used to constrain the redshift. |
With the X-ray determination of the redshift and the determination of the X-ray peak in hand, we can investigate the detection of the joint X-ray SZ COMPRASS catalogue at z = 0.5. This detection is probably due to the presence of another cluster at z = 0.52 detected by RedMapper (Rozo et al. 2015), which is ∼4 arcmin distant from ClG J104803.7+313843, with the uncertainty of the Planck position being assumed to be 5 arcmin.
3.3. Radial analysis
The radial density profile of the intra-cluster medium was measured following the scheme detailed in Sects. 3.2 and 3.3 of Bartalucci et al. (2017). Firstly, we extracted the instrumental background-subtracted and vignetting-corrected surface brightness profiles, SX, from concentric annuli of width 2″, centred on the X-ray peak. The mean value of the sky background was estimated in a region free of cluster emission and then subtracted. The profile was re-binned to have at least 3σ in each bin. The SX profile was used to derive the radial density profiles, ne(r), by employing the deprojection technique detailed in Croston et al. (2006). We corrected for the PSF using the model of Ghizzardi (2001) who adopted a King function to model the PSF profile as a function of the energy and offsets, the parameters of which are reported in EPIC-MCT-TN-0113 and EPIC-MCT-TN-0124 for the MOS and pn cameras, respectively; this model has been demonstrated to account for the XMM-Newton PSF up to 7 arcsec by Bartalucci et al. (2017).
The scaled density profile of ClG J104803.7+313843 is shown in Fig. 3 with red rectangles. The profile shows no hints of features related to merging activities. This is coherent with the picture emerging from the morphological analysis in which the cluster seems to be mostly dynamically relaxed. Any hint of merging phenomena shown above that radius in Fig. 11 is too faint to be detected in the density profile.
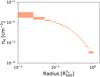 |
Fig. 3. Density profile extracted using, as the centre, the X-ray peak and scaled by |

3.4. Global quantities
The observation is too shallow to extract the temperature radial profile. For this reason, we were not able to measure the hydrostatic mass profile. The measurement of the mass at the density contrast Δ = 500 with high precision is fundamental to build a sample of high redshift and massive objects. To do this, we determined the mass,  , and the corresponding radius,
  , from the mass proxy YX. This quantity is defined as the product of the temperature measured within the [0.15−0.75]R500 region and the gas mass within R500, as detailed in Kravtsov et al. (2006). We used the M500–YX relation as calibrated from Arnaud et al. (2010) assuming self-similar evolution and the gas mass being computed from the volume integration of the density profile.
The results of this computation as well as other global quantities are summarised in Table 1. The ![Mathematical equation: $ {M_{500}^{{Y}_{\text{ X}}}}= 5.64^{+0.79}_{-0.62} \times 10^{14} [M_{\odot}] $](/articles/aa/full_html/2022/04/aa42313-21/aa42313-21-eq16.gif) is consistent at 1σ with the value of M500 = 9.8 ± 3.2 × 10¹⁴ M⊙ computed by Buddendiek et al. (2015) through the M500–YSZ relation, but they differ by almost a factor of 2. This is not surprising, with the scatter of this relation being already of the order of ∼20−30%.
is consistent at 1σ with the value of M500 = 9.8 ± 3.2 × 10¹⁴ M⊙ computed by Buddendiek et al. (2015) through the M500–YSZ relation, but they differ by almost a factor of 2. This is not surprising, with the scatter of this relation being already of the order of ∼20−30%.
4. Discussion
We have presented in this work the X-ray analysis of ClG J104803.7+313843, leveraging its serendipitous observation. With this XMM-Newton observation in hand, we have been able to do the following:
– We investigated the morphology of the cluster within  and inferred the dynamical status which appears to be relaxed in the inner part with hints of interacting substructures in the outskirts. However, the lack of significant merger features could simply be due to the result of low statistics combined with low angular resolution of the data. The cluster does not appear to host a cool core.
– We confirmed the optical photometric redshift and benchmarked the possibility of using X-rays to estimate the redshift at such a low-statistic regime. This result shows the efficiency of XMM-Newton snapshots in being useful not only to confirm cluster presence, but also give important information such as redshift.
– We measured the density profile up to  . This quantity strengthens the picture emerging from the morphological analysis.
– We combined the gas density profile and temperature measured within fixed apertures to estimate the mass through the low-scatter and high-precision mass proxy YX, which yields an unprecedented ∼10% precision measurement of the mass.
We stress the fact that we were able to achieve such a level of characterisation with a short-exposure observation and, furthermore, the object of interest is 9 arcmin offset from the aim point.
Building a well-characterised sample of high-redshift and massive clusters is a crucial point for any study envisaging to significantly improve our understanding of these peculiar objects. We show in Fig. 4 the distribution in the mass-redshift plane of all the clusters found by the Planck, SPT, and ACT SZ surveys. The ClG J104803.7+313843 cluster is shown with a red cross. The region of the most massive and distant redshift objects highlighted with a blue polygon is the least populated region compared to the others, and any effort to add even one cluster is fundamental. Optical-based surveys are also fundamental to enrich these populations. MadCows (Gonzalez et al. 2019) successfully delivered ∼2000 candidates at z > 0.7. However, the mass M500 measured with a low-scatter proxy such as the YSZ is available only for 14 clusters, with only three being more massive than M500 > 5 × 10¹⁴ M⊙.
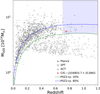 |
Fig. 4. Cluster distribution in the mass-redshift plane. Filled points: Clusters identified by the Planck all-sky survey. Empty boxes: Clusters from the SPT collaboration. Empty triangles: Clusters from the ACT survey. Masses in the Planck catalogue were derived iteratively from the M500–YSZ relation calibrated using hydrostatic masses from XMM-Newton. They were not corrected for the hydrostatic equilibrium (HE) bias. Published SPT masses were estimated ‘true’ mass and were re-normalised by a factor of 0.8 to the Planck standard for comparison. The confirmed cluster studied in this work is shown using a red cross. The blue shaded box identifies a region of massive clusters, M500 > 5 × 10¹⁴M⊙, at z > 0.7 which is poorly populated. There are ∼25 objects in this region as found by all the SZ surveys. The green and blue dashed lines indicate the 20% and 80% survey completeness contours, respectively, of the Planck SZ release 2 (PSZ2) catalogue which are shown in Fig. 26 of Planck Collaboration XXVII (2016). |
The multiwavelength approach is the game-changer to study high redshift and massive objects. The dashed coloured lines shown in Fig. 4 represent the minimum mass above which we have a probability of 20% and 80%, in green and blue, respectively, of finding a cluster with Planck, that is to say the completeness of the sample at a given redshift and mass. These curves show that Planck alone is not capable of delivering numerous massive and distant objects. The current combination of a relatively limited sensitivity at a high redshift of the all-sky Planck survey and the limited sky coverage of the ground-based SZ observatory will greatly benefit from the future combination of optical-near-infrared facilities such as LSST and Euclid and to eROSITA to increase the population of the massive clusters at high redshift (e.g. Mantz et al. 2019 and references therein). X-rays and their combination with the new SZ high resolution observations are the key elements to derive fundamental thermodynamic quantities such as density and temperature or dynamical information such as the hydrostatic mass profile.
Furthermore, the characterisation of this sample is also fundamental to carefully plan future observation campaigns with deep observations. That is, observing these objects is extremely time-consuming and knowing the mass and the morphology in advance is crucial to carefully selecting objects. ClG J104803.7+313843 has been initially detected as a ∼1015M⊙ object, while our work shows that it is still massive, but it has a smaller mass with a reduction on the relative error of the order of ∼3 times. This result shows the importance of the X-ray characterisation.
RΔ is defined as the radius enclosing Δ times the critical matter density at the cluster redshift. MΔ is the corresponding mass.
Acknowledgments
The results reported in this article are based on data obtained from the XMM-Newton observatory, an ESA science mission with instruments and contributions directly funded by ESA Member States and NASA. EP and LZ acknowledge financial support under ASI/INAF contract 2017-14-H.0. ML acknowledges financial support from the Ph.D. programme in Astronomy, Astrophysics and Space Science supported by MIUR (Ministero dell’Istruzione, dell’Università e della Ricerca).
References
- Allen, S. W., Schmidt, R. W., Ebeling, H., Fabian, A. C., & van Speybroeck, L. 2004, MNRAS, 353, 457 [NASA ADS] [CrossRef] [Google Scholar]
- Allen, S. W., Evrard, A. E., & Mantz, A. B. 2011, ARA&A, 49, 409 [Google Scholar]
- Arnaud, M., Neumann, D. M., Aghanim, N., et al. 2001, A&A, 365, L80 [NASA ADS] [CrossRef] [EDP Sciences] [Google Scholar]
- Arnaud, M., Pratt, G. W., Piffaretti, R., et al. 2010, A&A, 517, A92 [CrossRef] [EDP Sciences] [Google Scholar]
- Bartalucci, I., Arnaud, M., Pratt, G. W., et al. 2017, A&A, 598, A61 [NASA ADS] [CrossRef] [EDP Sciences] [Google Scholar]
- Bartalucci, I., Arnaud, M., Pratt, G. W., & Le Brun, A. M. C. 2018, A&A, 617, A64 [NASA ADS] [CrossRef] [EDP Sciences] [Google Scholar]
- Bartalucci, I., Arnaud, M., Pratt, G. W., Démoclès, J., & Lovisari, L. 2019, A&A, 628, A86 [EDP Sciences] [Google Scholar]
- Bleem, L. E., Stalder, B., de Haan, T., et al. 2015, ApJS, 216, 27 [Google Scholar]
- Bourdin, H., & Mazzotta, P. 2008, A&A, 479, 307 [NASA ADS] [CrossRef] [EDP Sciences] [Google Scholar]
- Buddendiek, A., Schrabback, T., Greer, C. H., et al. 2015, MNRAS, 450, 4248 [NASA ADS] [CrossRef] [Google Scholar]
- Clowe, D., Bradač, M., Gonzalez, A. H., et al. 2006, ApJ, 648, L109 [NASA ADS] [CrossRef] [Google Scholar]
- Croston, J. H., Arnaud, M., Pointecouteau, E., & Pratt, G. W. 2006, A&A, 459, 1007 [NASA ADS] [CrossRef] [EDP Sciences] [Google Scholar]
- Ebeling, H., Edge, A. C., & Henry, J. P. 2001, ApJ, 553, 668 [Google Scholar]
- Fassbender, R., Böhringer, H., Nastasi, A., et al. 2011, New J. Phys., 13 [Google Scholar]
- Ghizzardi, S. 2001, In-Flight Calibration of the On-Axis and Near Off-Axis PSF for the MOS1 and MOS2 cameras, XMM-SOC-CAL-TN-0022 [Google Scholar]
- Giacconi, R., Rosati, P., Tozzi, P., et al. 2001, ApJ, 551, 624 [Google Scholar]
- Gonzalez, A. H., Gettings, D. P., Brodwin, M., et al. 2019, ApJS, 240, 33 [NASA ADS] [CrossRef] [Google Scholar]
- Harrison, I., & Coles, P. 2011, MNRAS, 418, L20 [NASA ADS] [Google Scholar]
- Harrison, I., & Hotchkiss, S. 2013, J. Cosmol. Astropart. Phys., 2013, 022 [CrossRef] [Google Scholar]
- Hasselfield, M., Hilton, M., Marriage, T. A., et al. 2013, J. Cosmol. Astropart. Phys., 7, 008 [Google Scholar]
- Kalberla, P. M. W., Burton, W. B., Hartmann, D., et al. 2005, A&A, 440, 775 [NASA ADS] [CrossRef] [EDP Sciences] [Google Scholar]
- Kravtsov, A. V., Vikhlinin, A., & Nagai, D. 2006, ApJ, 650, 128 [Google Scholar]
- Kuntz, K. D., & Snowden, S. L. 2000, ApJ, 543, 195 [Google Scholar]
- Le Brun, A. M. C., Arnaud, M., Pratt, G. W., & Teyssier, R. 2018, MNRAS, 473, L69 [Google Scholar]
- Lumb, D. H., Warwick, R. S., Page, M., & De Luca, A. 2002, A&A, 389, 93 [CrossRef] [EDP Sciences] [Google Scholar]
- Mantz, A., Allen, S. W., Rapetti, D., & Ebeling, H. 2010, MNRAS, 406, 1759 [NASA ADS] [Google Scholar]
- Mantz, A., Allen, S. W., Battaglia, N., et al. 2019, BAAS, 51, 279 [NASA ADS] [Google Scholar]
- Marriage, T. A., Acquaviva, V., Ade, P. A. R., et al. 2011, ApJ, 737, 61 [Google Scholar]
- McDonald, M., Allen, S. W., Bayliss, M., et al. 2017, ApJ, 843, 28 [Google Scholar]
- Morrison, R., & McCammon, D. 1983, ApJ, 270, 119 [Google Scholar]
- Muzzin, A., Wilson, G., Yee, H. K. C., et al. 2009, ApJ, 698, 1934 [Google Scholar]
- Planck Collaboration VIII. 2011, A&A, 536, A8 [NASA ADS] [CrossRef] [EDP Sciences] [Google Scholar]
- Planck Collaboration XXXII. 2015, A&A, 581, A14 [NASA ADS] [CrossRef] [EDP Sciences] [Google Scholar]
- Planck Collaboration XXVI. 2011, A&A, 536, A26 [NASA ADS] [CrossRef] [EDP Sciences] [Google Scholar]
- Planck Collaboration XXVII. 2016, A&A, 594, A27 [NASA ADS] [CrossRef] [EDP Sciences] [Google Scholar]
- Pratt, G. W., Arnaud, M., Piffaretti, R., et al. 2010, A&A, 511, A85 [NASA ADS] [CrossRef] [EDP Sciences] [Google Scholar]
- Rosati, P., Della Ceca, R., Norman, C., & Giacconi, R. 1998, ApJ, 492, L21 [NASA ADS] [CrossRef] [Google Scholar]
- Rozo, E., Rykoff, E. S., Becker, M., Reddick, R. M., & Wechsler, R. H. 2015, MNRAS, 453, 38 [NASA ADS] [CrossRef] [Google Scholar]
- Starck, J.-L., Murtagh, F., & Bijaoui, A. 1998, Image Processing and Data Analysis: The Multiscale Approach (New York, NY, USA: Cambridge University Press) [CrossRef] [Google Scholar]
- Strüder, L., Briel, U., Dennerl, K., et al. 2001, A&A, 365, L18 [Google Scholar]
- Sunyaev, R. A., & Zeldovich, I. B. 1980, ARA&A, 18, 537 [Google Scholar]
- Tarrío, P., Melin, J. B., & Arnaud, M. 2019, A&A, 626, A7 [NASA ADS] [CrossRef] [EDP Sciences] [Google Scholar]
- Turner, M. J. L., Abbey, A., Arnaud, M., et al. 2001, A&A, 365, L27 [CrossRef] [EDP Sciences] [Google Scholar]
- Vikhlinin, A., Burenin, R. A., Ebeling, H., et al. 2009, ApJ, 692, 1033 [Google Scholar]
- White, S. D. M., Navarro, J. F., Evrard, A. E., & Frenk, C. S. 1993, Nature, 366, 429 [Google Scholar]
- Willis, J. P., Clerc, N., Bremer, M. N., et al. 2013, MNRAS, 430, 134 [NASA ADS] [CrossRef] [Google Scholar]
- Yu, H., Tozzi, P., Borgani, S., Rosati, P., & Zhu, Z. H. 2011, A&A, 529, A65 [NASA ADS] [CrossRef] [EDP Sciences] [Google Scholar]
- Zhang, B., Fadili, J. M., & Starck, J.-L. 2008, IEEE Trans. Image Process., 17, 1093 [CrossRef] [Google Scholar]
- Zwicky, F. 1933, Helv. Phys. Acta, 6, 110 [NASA ADS] [Google Scholar]
All Tables
All Figures
|
Fig. 1. Left panel: background-subtracted and exposure-corrected image in the [0.5−2.5] keV band of the full field of view of the XMM-Newton observation used in this work. This image was obtained by combining the three EPIC cameras. The cluster is in the NW sector. The white circle encompasses R500 derived using the YX proxy, assuming self-similar evolution, as described in Sect. 3.4. Right panel: wavelet filtered image of the cluster in the [0.5−2.5] keV band. The emission shown is detected at a significance level greater than 3σ. The white circle is the same as in the left panel. The colour bar refers to the count level of the wavelet filtered image. |
| In the text | |
|
Fig. 2. Particle background-subtracted spectra extracted from the circular region centred on the X-ray peak of the cluster whose radius is defined to maximise the signal-to-noise ratio. The black, red, and green points represent the spectrum extracted from the MOS1, MOS2, and pn camera, respectively. The solid lines represent the model used to fit the spectra and their colour legend is the same as the points. The dash-dotted lines represent the sky background component. The arrow highlights the position of the iron line used to constrain the redshift. |
| In the text | |
|
Fig. 3. Density profile extracted using, as the centre, the X-ray peak and scaled by |
| In the text | |
|
Fig. 4. Cluster distribution in the mass-redshift plane. Filled points: Clusters identified by the Planck all-sky survey. Empty boxes: Clusters from the SPT collaboration. Empty triangles: Clusters from the ACT survey. Masses in the Planck catalogue were derived iteratively from the M500–YSZ relation calibrated using hydrostatic masses from XMM-Newton. They were not corrected for the hydrostatic equilibrium (HE) bias. Published SPT masses were estimated ‘true’ mass and were re-normalised by a factor of 0.8 to the Planck standard for comparison. The confirmed cluster studied in this work is shown using a red cross. The blue shaded box identifies a region of massive clusters, M500 > 5 × 10¹⁴M⊙, at z > 0.7 which is poorly populated. There are ∼25 objects in this region as found by all the SZ surveys. The green and blue dashed lines indicate the 20% and 80% survey completeness contours, respectively, of the Planck SZ release 2 (PSZ2) catalogue which are shown in Fig. 26 of Planck Collaboration XXVII (2016). |
| In the text | |
Current usage metrics show cumulative count of Article Views (full-text article views including HTML views, PDF and ePub downloads, according to the available data) and Abstracts Views on Vision4Press platform.
Data correspond to usage on the plateform after 2015. The current usage metrics is available 48-96 hours after online publication and is updated daily on week days.
Initial download of the metrics may take a while.