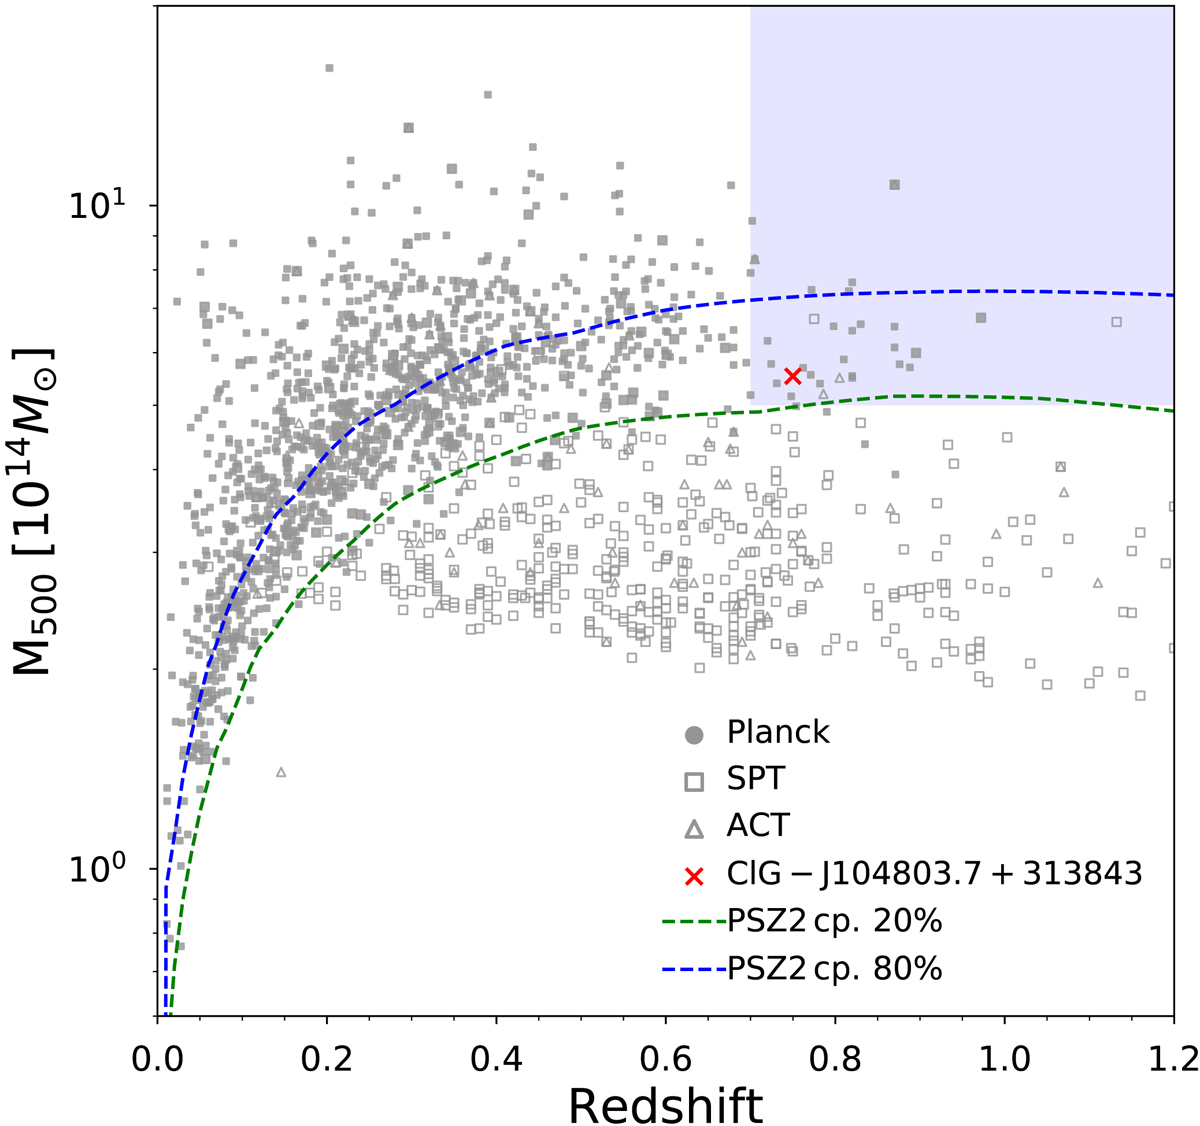
Fig. 4.
Download original image
Cluster distribution in the mass-redshift plane. Filled points: Clusters identified by the Planck all-sky survey. Empty boxes: Clusters from the SPT collaboration. Empty triangles: Clusters from the ACT survey. Masses in the Planck catalogue were derived iteratively from the M500–YSZ relation calibrated using hydrostatic masses from XMM-Newton. They were not corrected for the hydrostatic equilibrium (HE) bias. Published SPT masses were estimated ‘true’ mass and were re-normalised by a factor of 0.8 to the Planck standard for comparison. The confirmed cluster studied in this work is shown using a red cross. The blue shaded box identifies a region of massive clusters, M500 > 5 × 10¹⁴M⊙, at z > 0.7 which is poorly populated. There are ∼25 objects in this region as found by all the SZ surveys. The green and blue dashed lines indicate the 20% and 80% survey completeness contours, respectively, of the Planck SZ release 2 (PSZ2) catalogue which are shown in Fig. 26 of Planck Collaboration XXVII (2016).
Current usage metrics show cumulative count of Article Views (full-text article views including HTML views, PDF and ePub downloads, according to the available data) and Abstracts Views on Vision4Press platform.
Data correspond to usage on the plateform after 2015. The current usage metrics is available 48-96 hours after online publication and is updated daily on week days.
Initial download of the metrics may take a while.