Free Access
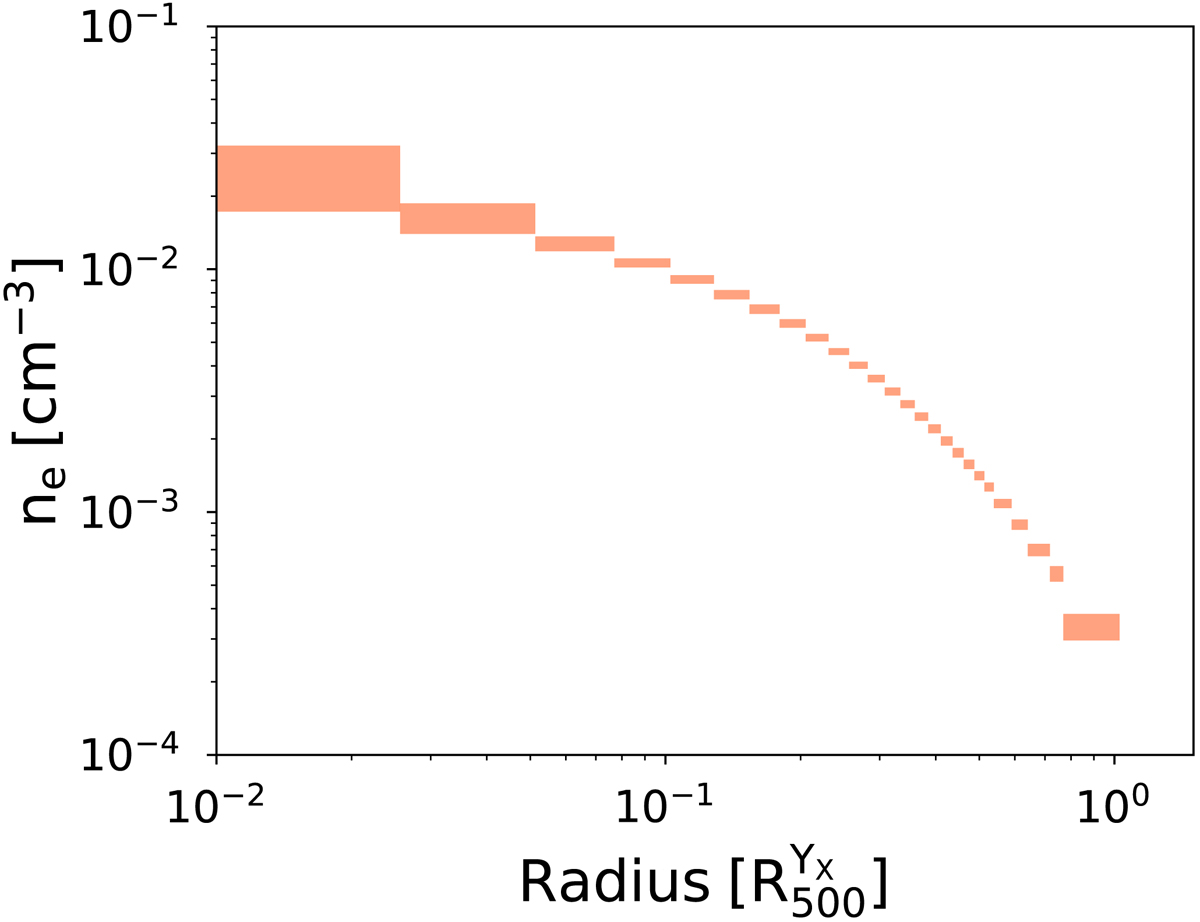
Fig. 3.
Download original image
Density profile extracted using, as the centre, the X-ray peak and scaled by ![]() . The size of each polygon along the y-axis represents the 1σ error.
. The size of each polygon along the y-axis represents the 1σ error.
Current usage metrics show cumulative count of Article Views (full-text article views including HTML views, PDF and ePub downloads, according to the available data) and Abstracts Views on Vision4Press platform.
Data correspond to usage on the plateform after 2015. The current usage metrics is available 48-96 hours after online publication and is updated daily on week days.
Initial download of the metrics may take a while.