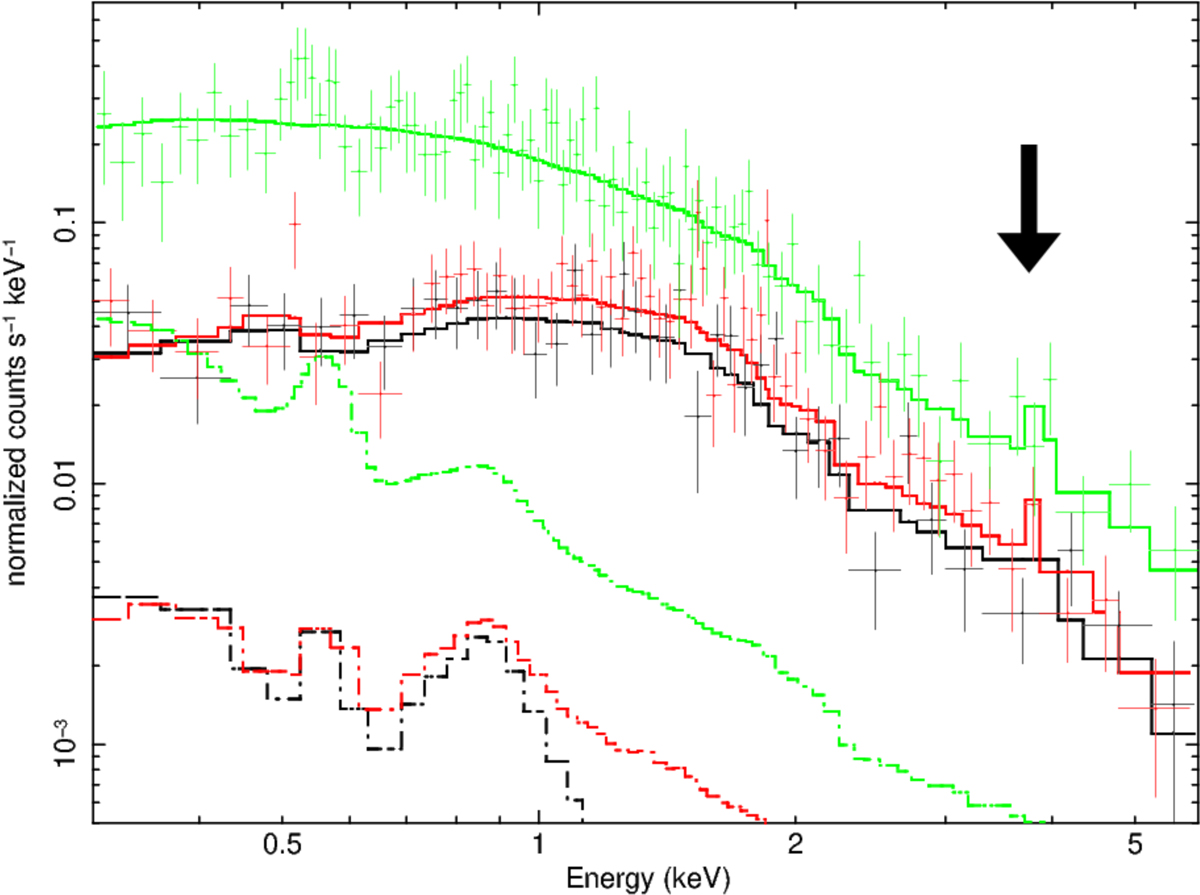
Fig. 2.
Download original image
Particle background-subtracted spectra extracted from the circular region centred on the X-ray peak of the cluster whose radius is defined to maximise the signal-to-noise ratio. The black, red, and green points represent the spectrum extracted from the MOS1, MOS2, and pn camera, respectively. The solid lines represent the model used to fit the spectra and their colour legend is the same as the points. The dash-dotted lines represent the sky background component. The arrow highlights the position of the iron line used to constrain the redshift.
Current usage metrics show cumulative count of Article Views (full-text article views including HTML views, PDF and ePub downloads, according to the available data) and Abstracts Views on Vision4Press platform.
Data correspond to usage on the plateform after 2015. The current usage metrics is available 48-96 hours after online publication and is updated daily on week days.
Initial download of the metrics may take a while.