Fig. 1.
Download original image
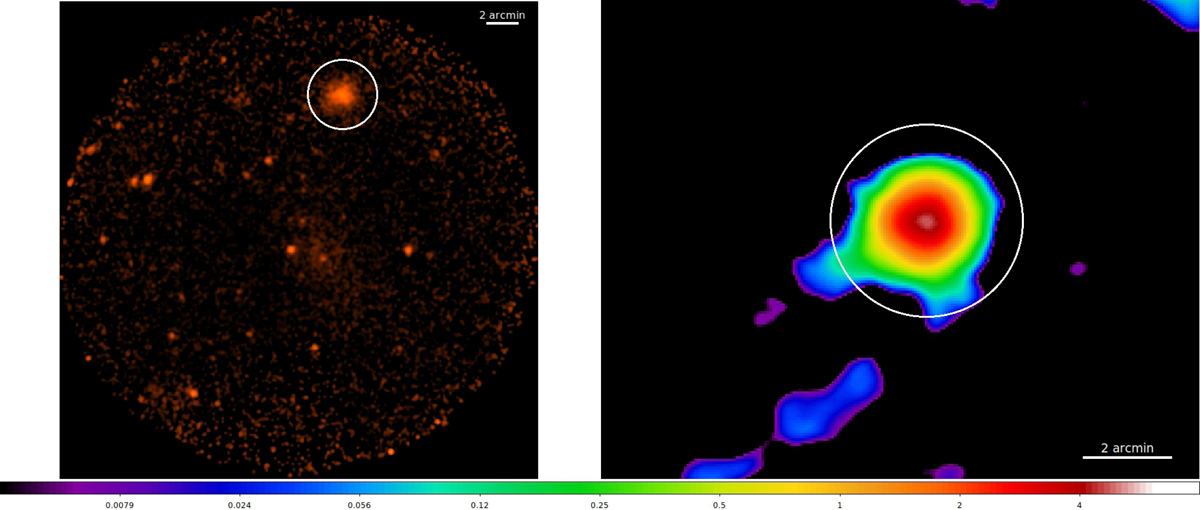
Left panel: background-subtracted and exposure-corrected image in the [0.5−2.5] keV band of the full field of view of the XMM-Newton observation used in this work. This image was obtained by combining the three EPIC cameras. The cluster is in the NW sector. The white circle encompasses R500 derived using the YX proxy, assuming self-similar evolution, as described in Sect. 3.4. Right panel: wavelet filtered image of the cluster in the [0.5−2.5] keV band. The emission shown is detected at a significance level greater than 3σ. The white circle is the same as in the left panel. The colour bar refers to the count level of the wavelet filtered image.
Current usage metrics show cumulative count of Article Views (full-text article views including HTML views, PDF and ePub downloads, according to the available data) and Abstracts Views on Vision4Press platform.
Data correspond to usage on the plateform after 2015. The current usage metrics is available 48-96 hours after online publication and is updated daily on week days.
Initial download of the metrics may take a while.