| Issue |
A&A
Volume 657, January 2022
|
|
|---|---|---|
| Article Number | A137 | |
| Number of page(s) | 12 | |
| Section | Stellar structure and evolution | |
| DOI | https://doi.org/10.1051/0004-6361/202142144 | |
| Published online | 25 January 2022 | |
The symbiotic binary St 2-22: Orbital and stellar parameters and jet evolution following its 2019 outburst
1
Nicolaus Copernicus Astronomical Center, Polish Academy of Sciences, Bartycka 18, 00-716 Warsaw, Poland
e-mail: This email address is being protected from spambots. You need JavaScript enabled to view it.
2
Centre for Extragalactic Astronomy, Department of Physics, University of Durham, South Road, Durham DH1 3LE, UK
3
Kleinkaroo Observatory, Calitzdorp, Western Cape, South Africa
4
Institute of Astronomy, Faculty of Physics, Astronomy and Informatics, Nicolaus Copernicus University in Toruń, Grudzidzka 5, Toruń 87-100, Poland
5
Institute of Astronomy and National Astronomical Observatory, Bulgarian Academy of Sciences, Tsarigradsko Shose 72, 1784 Sofia, Bulgaria
Received:
3
September
2021
Accepted:
22
October
2021
Abstract
Context. St 2-22 is a relatively poorly studied S-type symbiotic system that belongs to a small group of jet-producing systems as a result of disc accretion onto a white dwarf fed by its red giant companion.
Aims. The goal of this paper is to analyse the nature and derive the basic parameters of St 2-22, and to follow the jet evolution.
Methods. Photometric monitoring for over 16 yr and high-quality spectroscopic data enabled us to shed new light on its nature. The high-resolution SALT spectra and V Ic photometry obtained during and between the last two outbursts have been used to search for periodic changes, to derive spectroscopic orbits of both system components, and to study the outburst and jet evolution.
Results. We present the orbital and stellar parameters of the system components. The orbital period is Porb = 918 ± 6d. The double-line spectroscopic orbits indicate the mass ratio q = Mg Mh−1 = 3.50 ± 0.53, and the components masses Mgsin3i ∼ 2.35 M⊙ and Mhsin3i ∼ 0.67 M⊙. The orbit shows significant eccentricity, e = 0.16 ± 0.07. The orbital inclination is close to 70°. During outbursts, accelerating and decelerating jets are observed with changes in their radial velocity component in a range from ∼1500 up to nearly 1800 km s−1. St 2-22 turned out to be a classical symbiotic system very similar to the precursor of the group – Z And.
Key words: binaries: symbiotic / stars: jets / novae, cataclysmic variables / stars: individual: St 2-22 (PN Sa 3-22)
© ESO 2022
1. Introduction
St 2-22 = PN Sa 3-22 (α2000: 13h14m30.3s, δ2000: −58°51′49.6″) is a poorly studied classical symbiotic binary, composed of an ∼M4-type red giant (RG) and a hot accreting white dwarf (WD). It is one of a handful of symbiotic systems (SySt) known to produce high-velocity (∼a few × 103 km s−1) collimated jets during their outbursts (Tomov et al. 2017). However, so far only one outburst has been recorded with only two spectra taken during it, and many issues have yet to be addressed.
Initially, the object was classified as a planetary nebula (Sanduleak 1976), but the object was reclassified as SySt by Allen (1984) who identified the Raman scattered O VI 6825 Å line in its spectrum. Van Winckel et al. (1993) reported brightness variations at the end of the 1980s and the beginning of the 1990s, however without details about their nature. A search for linear polarisation by García (2003) gave a negative result. Zamanov et al. (2008) included St 2-22 in their studies of rotational velocities of the RGs in SySt. Mürset & Schmid (1999) estimated an M4.5 spectral type for the RG. Mikołajewska et al. (1997) estimated the distance ∼5 kpc as well as the temperature Th ∼ 54 − 100 × 103 K and luminosity Lh ∼ 600 L⊙ of the WD. Collimated, bipolar jets with an average velocity of ∼1700 km s−1 were discovered in spectra collected during an unnoticed outburst in 2005 (Tomov et al. 2017). The nature of the outburst was similar to those observed in classical SySt. The chemical composition and physical parameters of the RG, [O III] emission line ratios, and infrared colours of St 2-22 are consistent with an S-type SySt (Tomov et al. 2017).
At the beginning of 2019, another eruption began that is still ongoing. Here we discuss the characteristics of the last outburst phenomenon and evolution of jets. We also provide the orbital and physical parameters of St 2-22 based on spectra collected around the last two outbursts.
2. Observations
2.1. Spectra
High-resolution (R ∼ 40 000; range: 3920−8780 Å) spectra were collected with the Southern African Large Telescope (SALT) High Resolution Spectrograph (HRS) in medium–resolution mode under programmes 2018-2-SCI-021 and 2019-1-MLT-008 (PI: C. Gałan). These data are complemented with publically available, HRS spectra acquired in low–resolution mode (R ∼ 14 000; useful range: 4000−8790 Å) under programmes 2017-1-SCI-046 and 2017-2-SCI-044 (PI: T. Tomov). In this case, three exposures were collected for each night which have been finally summed into single spectra. The HRS observations were reduced using the MIDAS–based pipeline1 (Kniazev 2016; Kniazev et al. 2017). We also used four high-resolution (R ∼ 48 000; 3710−9215 Å) FEROS spectra obtained with the 2.2-m MPG/ESO telescope at La Silla Observatory under the programme 074.D-0114. The journal of our spectroscopic observations is presented in Table 1.
Heliocentric radial velocities of the red giant and the cF-absorption lines with their 1σ errors, and the maximum IP observed.
2.2. Photometry
St 2-22 was monitored for over 16 years starting in December 2004 (JD 2453353) with a 35 cm Meade RCX400 telescope equipped with an SBIG ST8-XME CCD camera and V and Ic (beginning in November 2012; JD 2456232) filters at the Kleinkaroo Observatory (South Africa). Each single data point is the result of several individual exposures, which were calibrated (dark subtraction and flat-fielding) and stacked selectively. Magnitudes were derived from differential photometry to nearby reference stars using the single image mode of AIP4 image processing software. Our photometry was supplemented by the data in V and g filters from the All Sky Automated Survey for Supernovae (ASAS-SN, Shappee et al. 2014; Kochanek et al. 2017) and by OGLE I-band measurements (see Tomov et al. 2017). Moreover, the V-band data collected by the ASAS survey (Pojmański 1997) are used for comparison. The light curves are shown in Fig. 1 with arrows marking the times of our spectroscopic observations.
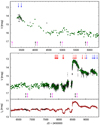 |
Fig. 1. Light curve of St 2-22 with the ongoing outburst. Green and brown dots correspond to the V- and Ic-band data, respectively, acquired at the Kleinkaroo Observatory, whereas the ASAS and ASAS-SN V- and g-band, as well as OGLE I-band data, are plotted as black points. The zero-point of the OGLE photometry is shifted by −0.38 mag. Arrows above the light curves mark the HRS and FEROS observations with (blue) and without (red) jet detection, while those below mark the times of periastron passage (black) and inferior conjunction (magenta) according to the eccentric orbit solution (Table 3). |
3. Results and discussion
3.1. Optical light curves
The light curves of St 2-22 show a systematic brightness decline (by ΔV ∼ 2 over ∼2000 days) followed by about 10 yr of a stable V ∼ 16 with moderate periodic-like fluctuations, and with a major outburst around JD 24558505 (January 21, 2019) that is still ongoing. This outburst began with a steep brightening by ΔV ∼ 2m (ΔI ∼ 0.7) in ≲10d, followed by a slower brightening over a month up to Vmax ≈ 13.2 (Imax ≈ 11.1). The steady decline began after a short (JD 2458537−614) optical plateau, initially by ΔV ∼ 1 (ΔI ∼ 0.6) within about 180 days, and then, around JD 2458860 St 2-22 has come to a standstill at V ∼ 14.5 (I ∼ 11.7), with small amplitude fluctuations on timescales of ∼300 days.
While Tomov et al. (2017) needed support from spectroscopy in addition to photometry to prove the occurrence of the outburst, our light curve confirms the reality of the 2005 outburst. Tomov et al. (2017) also reported the outburst as relatively short, ≲200d. However, they did not observed the outburst onset, and they assumed an incorrect quiescent brightness of V =  . In fact, St 2-22 was not detected by ASAS before September 2004 which implies V ≳ 15 (i.e. below the detection limit of ASAS) but then it remained invisible for ∼5 months (September–January) due to its position in the sky, and it was detected at V ∼ 14.2 just when is became visible again. Hence, it is very likely that the 2005 outburst occurred during the invisibility gap.
To search for any periodic changes, we analysed V-band light curve from the quiescent phase (JD 2454416–8283) using the discrete Fourier transform method in the Period 04 programme (Lenz & Breger 2005). We found two periods, P1 = 891d ± 15, which could be attributed to the orbital cycle, and P2 =  , which is most likely due to RG pulsation. However, there is no evidence for a much shorter period of 51d ± 7 reported by Tomov et al. (2017). The analysis of the Ic-band light curve confirmed the periods found in the V-band data within 3σ error. Phased light curves are presented in Fig. A.1.
3.2. Spectral changes
HRS spectra cover all the phases of recent activity – the maximum, the standstill following the early decline, and the substantial part of the quiescent state (see Fig. 1). Quiescent spectra of St 2-22 are characteristic of most SySt, with prominent emission lines from H I, He I, He II, [O III] as well as high ionisation [Fe VII] lines and the Raman scattered O VI line (Fig. 2), and a strong red continuum with deep TiO absorption bands. The highest ionisation potential (IPmax) observed in the spectrum is given in Table 1 while the behaviour of the main emission line profiles is shown in Figs. A.2 and 2, and the equivalent widths are found in Table 2. The strength of H I and He I lines increases significantly in the spectra taken in 2018, preceding the outburst by almost a year. At the same time, the He II lines remain unchanged.
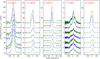 |
Fig. 2. Evolution of the He II (λ4685.680 Å) and He I (λ5875.640 Å, λ6678.151 Å, and λ7065.190 Å) line profiles, and the Raman scattered O VI (λ6825 Å) line with the radial velocity scale corresponding to the parent O VI (λ1032 Å) line in the HRS/SALT spectra (low-resolution mode: R ∼ 14 000) collected during quiescence. The red dashed vertical lines mark the systemic velocity. |
Journal of spectroscopic observations with information about time (UT, HJD, phase) and exposure times.
[2]http://cds-espri.ipsl.fr/tapas/
The outburst amplitude and timescales, as well as spectral changes, resemble those observed in other classical SySt (e.g. Z And, CI Cyg, and AX Per), the so-called Z And-type outbursts. In all epochs, in the observed members of the Balmer series, the broad emission is cut by a central absorption, blueshifted by ∼30−40 km s−1 with respect to the systemic velocity (Figs. A.2 and A.3). The lines become stronger during the outburst, and the absorption component seems to be broader, especially in the spectrum closest to the outburst maximum (February 15, 2019). All He I and He II lines completely or nearly disappear during the brightest phase of the outburst. The red giant absorption features (e.g. TiO bands) weaken, and at times (e.g. on July 1, 2020) almost completely disappear (Fig. 3). The spectra in the blue range are dominated by a hot continuum with absorption lines mostly from Ti II, Fe II, and Cr II which most closely resembles spectra of A–F supergiants. This so-called cF-shell absorption system is believed to be linked to the hot companion and formed either in a thick accretion disc around the compact object (Mikołajewska & Kenyon 1992; Brandi et al. 2005) or in the stream of accreted matter (e.g. in AR Pav, RS Oph, and V3890 Sgr; Schild et al. 2001; Quiroga et al. 2002; Brandi et al. 2009; Mikołajewska et al. 2021).
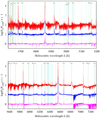 |
Fig. 3. Parts of blue (top), and red-arm (bottom), HRS/SALT spectra obtained close to the outburst maximum on February 15, 2019 (magenta), when the jets were first noticed on July 1, 2020 (blue), and during quiescence on February 5, 2018 (red). The laboratory wavelengths for identified emission lines are shown with green dashed lines labelled with the corresponding element. The position of the most frequent lines from singly ionised iron (Fe II) are shown with cyan dashed lines without labels for clarity. |
The spectra taken in 2020, after the significant drop in optical brightness, reveal the reappearance of He II emission lines, while the blue continuum and cF-shell absorption lines are still present, although significantly weakened. However, the most remarkable change occurred in July 2020 when two satellite components with a velocity ∼ ± 1650 km s−1 appeared in Hα wings, which we attribute to a launch of bipolar jets. The jets were detected for the first time since their discovery during the 2005 outburst (Tomov et al. 2017), and they have been present in all subsequent spectra.
The FEROS spectra obtained in 2005 resemble the HRS spectra taken during the light curve standstill (2020 to 2021), and, in particular, the spectrum taken on February 1, 2005 is almost identical with the HRS spectrum on April 2, 2021 (almost exactly during a small secondary maximum). This suggests that both outbursts could have been similar and that the 2005 outburst had very likely started much earlier and reached a higher amplitude than reported by Tomov et al. (2017).
3.3. Spectroscopic orbits
All our spectra in the red region contain plenty of absorption lines from the atmosphere of the cool, red giant. We used the synthetic spectra from the BT-NextGen grid of the theoretical spectra of Allard et al. (2011)2, who used the solar abundances of Asplund et al. (2009), convolved with the appropriate profile, to meet the resolution of the observed spectra. The synthetic spectrum of an M5 III star (Teff = 3400 K, log g = 0.5, and z = −0.25) best fitted the observed quiescent spectra (see Fig. 4). To measure the radial velocities, our spectra were cross-correlated with the synthetic spectrum. To avoid the regions with emission lines or polluted by the telluric features from absorption of the Earth’s atmosphere, the following masks were applied: 6110–6130, 6133–6147, 6597–6607, 6624–6656, 7069–7154, 7378–7513, 7899–8138, and 8670–8700 Å. The resulting velocities are given in Table 1 and plotted in Fig. 5.
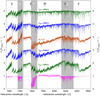 |
Fig. 4. Average of three spectra of St 2-22 obtained during quiescence in June and July 2017, compared with the spectra from the grid BT-NextGen of the theoretical spectra (Allard et al. 2011, log g = 0.5 dex and Teff in the range 3300−3600 K). The spectrum of St 2-22 most resembles the giant’s spectrum with Teff = 3400 K. The spectrum of the atmospheric transmission is shown at the bottom in magenta; it was not subtracted from the observed spectra. It was generated with the use of the TAPAS2 service (Bertaux et al. 2014), adopting conditions similar to those during our observations in Sutherland. |
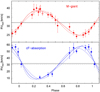 |
Fig. 5. Radial velocity curves of the cool (top) and hot (bottom) components folded with the period Psp = 918d. The values measured from SALT/HRS and FEROS data are shown with filled and open circles, respectively. Lines show synthetic radial velocity curves: for the case of the eccentric orbit (solid), circular orbit (dashed), and from the solution for RVcF only (dot dashed). The corresponding horizontal lines represent the systemic velocities in these three cases. |
Table A.1 lists more than 100 cF-shell absorption system lines, located in the range ∼4200 − 5200 Å, which were indentified in the Feros and HRS spectra taken from 2019 to 2021 and used to measure the radial velocities (Table 1). The radial velocities of these lines are in anti-phase with the red giant (Fig. 5), and we attribute them to the orbital motion of the WD.
Table 3 shows the orbital solutions. The obtained orbital period Psp = 918 ± 6d is consistent within 3σ errors with that from periodic analysis of the light curves. Due to its better precision, we adopt it as the final value. The best solution gives a significantly eccentric orbit (see Fig. 5), although the periastron longitude, ω ∼ 270°, may indicate some geometrical effect tied to the line of sight as in AR Pav (Quiroga et al. 2002), FN Sgr (Brandi et al. 2005), and V3890 Sgr (Mikołajewska et al. 2021). However, in St 2-22 the same eccentric solution fits both radial velocity curves which suggests that the orbit is indeed eccentric. The semi-amplitudes of the radial velocity curves of both components indicate the mass ratio q = 3.50 ± 0.53, the masses Mgsin3i = 2.35 ± 0.55 M⊙, and MWDsin3i = 0.67 ± 0.15 M⊙, and the separation of the components a sin i ∼ 2.67 AU. The lack of eclipses sets the upper limit for the orbit inclination, i ≲ 70°, whereas the lower limit, i ≳ 52°, results from the fact that the WD cannot exceed the Chandrasekhar limit (MWD ≲ 1.4 M⊙). This indicates a moderately massive WD, MWD ≳ 0.8 ± 0.2 M⊙. The red giant mass is then Mg ≳ 2.8 ± 0.7 M⊙.
Orbital solutions for St 2-22.
3.4. Red giant and distance
Gaia DR3 gives a parallax of π = 0.085 ± 0.023 mas (Gaia Collaboration 2021) for St 2-22, resulting in a value of a distance d =  kpc (Bailer-Jones et al. 2021). The goodness-of-fit statistic parameter for this parallax is gofAL ≈ 2.05, which means a good fit to the data, thus giving credibility to the measured distance. The 2MASS colours (Phillips 2007) and the mean quiescent V − Ic ∼ 4.2 (this paper) are consistent with M5 III (Teff = 3400 K; Sect. 3.3) and the reddening EB − V = 0.7 ± 0.1, which agrees with the total Galactic extinction EB − V < 0.80 ± 0.04 (Schlafly & Finkbeiner 2011) and is consistent with EB − V = 0.81 ± 0.10 (Zamanov et al. 2021), as well as marginally consistent with EB − V ∼ 1 ± 0.3 estimated by Mikołajewska et al. (1997). We adopt the distance d = 6.9 kpc and EB − V = 0.7 for the rest of the paper.
The reddening-corrected K0 = 7.97 ± 0.05 and (J − K)0 = 1.20 ± 0.09 combined with the corresponding bolometric correction BCK = 2.94 ± 0.10 (Bessell & Wood 1984) gives Mbol = −3.28 ± 0.45, the luminosity Lg =  L⊙, and the radius Rg = 117 ± 20 R⊙. The mass ratio, q ∼ 3.5, a sin i ∼ 2.7 AU, and sin i ≲ 70° (Sect. 3.3), gives the Roche lobe radius RRL = 0.5a ∼ 306 R⊙ (Paczyński 1971, Eq. (4)) which indicates that the giant does not fill its tidal lobe even at the periastron (Rg/RRL, p ∼ 0.5).
Hut (1981) showed that in a binary with an eccentric orbit, the tidal force acts to synchronise the donor’s rotation with the orbital motion of the companion, and the equilibrium (called pseudo synchronisation) is reached for the rotational period, Prot, lower than Porb by an amount depending on the eccentricity. Using the orbital parameters for St 2-22 (Table 3), we estimated Prot/Porb = 0.86 ± 0.09 (Hut 1981, Eq. (42)) which combined with the RG rotational velocity v sin i = 9.8 ± 1.5 km s−1 (Zamanov et al. 2008) gives the RG radius Rg = 153 ± 40 R⊙, in good agreement with that derived above.
The luminosity and effective temperature (log Teff = 3.53, log Lg = 3.21 ± 0.20) locate the giant on the HR diagram between the evolutionary tracks of 1.6 and 2.5 M⊙ (e.g. Hurley et al. 2000), which more or less agree with our dynamical mass estimate (Sect. 3.3). The systemic velocity γ = 32.58 km s−1 and proper motions μα cos δ = −5.713 ± 0.018 mas yr−1 and μδ = 1.085 ± 0.022 mas yr−1 imply the following Galactic velocities: U = −136, V = −138, and W = −16.3 km s−1 which via confrontation with the Toomre diagram (see, e.g. Feltzing et al. 2003, – Fig. 1) suggest that St 2-22 may belong to the extended thick-disc population, despite being placed relatively close to the Galactic plane z = 0.46 ± 0.08 kpc (b = 3.87°).
3.5. Hot component activity and jet evolution
The optical magnitudes recorded for St 2-22 was ⟨V⟩hot ≈ 13.25 during the optical plateau (JD 2458537–614), which after correcting for the RG contribution (Vg ≈ 16.2) corresponds to Vhot ≈ 13.3. Assuming that most of the hot component continuum emission is shifted to the optical (a lower limit to luminosity if not), and that during outburst mbol ≈ Vhot, we estimate the reddening corrected mbol ≈ 11.1, and the absolute bolometric magnitude Mbol ≈ −3.1, which corresponds to Lhot ≈ 1380 L⊙.
Similarly, we estimate the luminosity of the F-type component, Lhot ∼ 300 − 400 L⊙, during the standstill from 2020 to 2021 and in 2005, respectively. In addition, to the F-type features, the spectra display very strong H I, He I, and He II emission lines. Unfortunately, the SALT spectra are not flux-calibrated, thus we cannot estimate the emission line fluxes and the corresponding temperature and luminosity of the ionising source. The FEROS spectra have relative flux-calibration, and we applied an absolute flux scale to the observed V mag (Table 4) such that convolution of the spectrum with the Johnson V filter agrees with the V mag. The emission line fluxes measured on the calibrated FEROS spectra are F(Hβ) = 7.7 and 7.4 × 10⁻¹⁴ erg s−1 cm−2, F(He I5876) = 9.3 and 8.3 × 10⁻¹⁴ erg s−1 cm−2, and F(He II4686) = 1.2 and 2.0 × 10⁻¹⁴ erg s−1 cm−2 on February 1 and May 5, 2005, respectively. These values are significantly different from those reported by Tomov et al. (2017, Table 1): For example, the reddened (using their EB − V = 1) values of F(Hβ) = 1.0 and 2.8 × 10⁻¹³ erg s−1 cm−2 from February 1 and May 5, 2005, respectively, are larger than ours, and, moreover, the fluxes measured in May are ∼3 times larger than those in February, whereas both the observed V mag and the EWs (Tables 2 and 4) are practically identical. Apparently, there is something wrong with the absolute flux calibration of the FEROS spectra in Tomov et al. (2017). Assuming a blackbody spectrum and case B recombination, the fluxes of Hβ, He I 5876, and He II 4686 lines require Th ∼ 100 kK (also indicated by the presence of weak [Fe VII] emission lines in the best-exposed spectra), and luminosity (within a factor of 2), Lh ∼ 200 L⊙ (see, e.g. Merc et al. 2020). The estimated luminosity is similar to the quiescent Lh ≈ 220 L⊙ resulting from the emission line fluxes published by Mikołajewska et al. (1997) corrected for the reddening and distance adopted in this study (Sect. 3.4), although the line ratios indicate a higher temperature, Th ∼ 140 kK. Based on the lack of Raman scattered lines in this spectrum, Tomov et al. (2017) suggested that this spectrum was obtained during another missed outburst. However, the visual magnitude, V ≈ 15.5 ± 0.3, that we derived from this spectrum is more or less consistent with quiescent magnitudes (Figs. 1 and A.1), and the lack of the Raman O VI and [Fe VII] lines is probably due to insufficient sensitivity to detect these relatively faint lines of this observation.
Radial velocities (RV) of the jets, FWHM values, and equivalent widths (EW) measured in the HRS and FEROS spectra.
The simultaneous presence of the F-type component and the much hotter ionising source points to a double-temperature structure of the active hot component that can be associated with an accretion disc. The F-type shell spectrum would be then formed in the optically thick disc seen nearly edge-on (i ≲ 70), while the hot radiation produced in a boundary layer and/or in the innermost disc regions would photoionise low density material above and below the disc and give rise to strong emission lines. A similar interpretation was proposed for other active SySt which simultaneously show an A/F-type shell spectrum and high ionisation emission lines (e.g. Kenyon & Webbink 1984; Quiroga et al. 2002; Mikołajewska et al. 2021). The luminosities estimated for both components agree within a factor of two which supports such an interpretation. Finally, the presence of an accretion disc is also compatible with the jet production.
Figure 6 shows the evolution of the jet components in the Hα line profile. The jets are clearly visible as two satellite emission components at velocity VJ ∼ ±1650 km s−1 in the spectrum acquired in July 2020 (JD 2459032), while they were absent in that taken in May (JD 2458980). This indicates that the jets were launched somewhere between May and July, shortly after St 2-22 reached a standstill in the optical light curve. These additional components are present in all subsequent spectra.
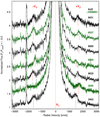 |
Fig. 6. Evolution of Hα line profile in the high-resolution spectra (HRS and FEROS) of St 2-22 with visible emission components from collimated jets on its wings. The measured positions of their centres (Table 4) after correction on Vγ are shown with red dashed lines. |
Table 4 presents radial velocities (measured by fitting Gaussian profiles) of both – approaching ( ) and receding (
 ) – jets together with the values of full widths at half maximum (FWHM), equivalent width (EW), and other characteristics. The outflow velocities, FWHMs, and EWs vary with time although there are no obvious trends. The approaching component is always stronger than the receding one with
  ∼ 2 from 2020 to 2021. The slowest jets were observed on JD 2459249, and their FWHM and EW are the lowest there as well. On the contrary, during the 2005 outburst, the slowest jets were observed on February 1 (JD 2453402) when their FWHM and EW were at their highest values. However, in any case, the departures of the jet radial velocity VJ, and FWHM from their average values, ⟨VJ⟩ = 1647 ± 48 km s−1 and ⟨FWMH⟩ = 279 ± 21 km s−1, are less than ∼10%. Assuming that the jets are launched perpendicularly to the disc and orbital plane, the jet opening angle, ϕ, is related to the observed jet width (Δv) and radial velocity, Δv = 2VJ sin ϕ/2, (e.g. Solf 1987). Using the average FWHM and VJ values, we estimate ϕ ∼ 10°. The total width of the jet component is a factor of ∼2 larger which may suggest a somewhat larger cone. However, in any case, the degree of collimation is quite high. The jet centre velocity, VCJ, seems to follow the WD radial velocities, but with a higher amplitude (Fig. A.5); more observations are, however, necessary to confirm this behaviour.
The general picture for the majority of jets is that the outflow velocity corresponds to the escape velocity at their origin (Livio 1998). Hence, the maximum expansion velocity is set by the WD escape velocity since no ejection can originate under its surface. Assuming the jet expansion perpendicular to the orbital plane, the expansion velocity is 2675 km s−1 ≲ Vexp = VJcos−1i ≲ 4816 km s−1 for 52° ≲ i ≲ 70° (Sect. 3.3). The WD escape velocity, vesc, increases with WD mass and by the same token with decreasing inclination (MWD ≈ 0.67 sin−3i M⊙), in particular, vesc ≈ 5500 ± 1500 km s−1 for MWD ≈ 0.8 ± 0.2 M⊙ (Sect. 3.3). Hence, the binary inclination should be close to its upper limit, i ∼ 70° if the jets are launched near the WD.
4. Epilogue
Based on high-resolution spectroscopy combined with 16 years of optical photometry, we have revealed the nature of the S-type symbiotic binary St 2-22 and derived physical parameters of the system components. Our double-line spectroscopic orbits indicate the orbital period Porb = 918d, the mass ratio q = Mg/MWD = 3.50 ± 0.5, and significant eccentricity e = 0.16 ± 0.07. The most likely orbital solution for the component masses are MWD ≈ 0.8 ± 0.2 M⊙ and Mg ≈ 2.8 ± 0.7 M⊙, whereas the orbit inclination is ∼70°.
St 2-22 shows outbursts with amplitudes in the range from 2−3 mag, which seem to recur with a timescale of a dozen years. In the quiescence, the changes  are observed with the period
  . The outburst behaviour of St 2-22 resembles that of the classical symbiotic binary Z And, and its binary parameters very similar to those of Z And (masses, temperatures, luminosities, etc.; Mikołajewska & Kenyon 1992) makes St 2-22 almost a twin in a slightly wider orbit. In both systems, we observed the ejection of strongly collimated jets during the late outburst phase. The jet behaviour in St 2-22, overall, resembles that in Z And where gradual changes within 200 − 300 km s−1 were observed on a time scale of several months (Skopal et al. 2009), with the difference that the jets of St 2-22 were undetectable in Hβ (probably due to the sensitivity of our spectra being too low); additionally, in St 2-22, after their first appearance in July 2020, we observed first deceleration and then acceleration of the jets. The phenomenon is still ongoing and our monitoring is continued. We also encourage high-resolution (R ≳ 15 000) spectroscopic monitoring to document the outburst and jet evolution well.
Acknowledgments
We dedicate this work to the memory of the wonderful man and friend, Toma Tomov, who sadly passed away in 2019. The present work is a continuation of the research he initiated and CG had the honour to participate. This research has been partly financed by the Polish National Science Centre (NCN) grants OPUS 2017/27/B/ST9/01940, MAESTRO 2015/18/A/ST9/00746, and SONATA No. DEC-2015/19/D/ST9/02974. KI was supported by STFC [ST/T000244/1]. The paper is based on spectroscopic observations made with the Southern African Large Telescope (SALT) under programmes: 2017-1-SCI-046 and 2017-2-SCI-044 (PI: T. Tomov), and 2018-2-SCI-021 and 2019-1-MLT-008 (PI: C. Gałan). Polish participation in SALT is funded by grant No. MNiSW DIR/WK/2016/07.
References
- Allard, F., Homeier, D., & Freytag, B. 2011, ASP Conf. Ser., 448, 91 [Google Scholar]
- Allen, D. A. 1984, PASA, 5, 369 [NASA ADS] [CrossRef] [Google Scholar]
- Asplund, M., Grevesse, N., Sauval, A., & Scott, P. 2009, ARA&A, 47, 481 [Google Scholar]
- Bailer-Jones, C. A. L., Rybizki, J., Fouesneau, M., et al. 2021, AJ, 161, 147 [NASA ADS] [CrossRef] [Google Scholar]
- Bertaux, J. L., Lallement, R., Ferron, S., et al. 2014, A&A, 564, A46 [NASA ADS] [CrossRef] [EDP Sciences] [Google Scholar]
- Bessell, M. S., & Wood, P. R. 1984, PASP, 96, 24 [Google Scholar]
- Brandi, E., Mikołajewska, J., Quiroga, C., et al. 2005, A&A, 440, 239 [NASA ADS] [CrossRef] [EDP Sciences] [Google Scholar]
- Brandi, E., Quiroga, C., Mikołajewska, J., et al. 2009, A&A, 497, 815 [NASA ADS] [CrossRef] [EDP Sciences] [Google Scholar]
- Feltzing, S., Bensby, T., & Lundstrom, I. 2003, A&A, 397, 1 [Google Scholar]
- Gaia Collaboration (Brown, A. G. A., et al.) 2021, A&A, 649, A1 [NASA ADS] [CrossRef] [EDP Sciences] [Google Scholar]
- García, L. G. 2003, ASP Conf. Ser., 303, 458 [Google Scholar]
- Hurley, J. R., Pols, O. R., & Tout, C. A. 2000, MNRAS, 315, 543 [Google Scholar]
- Hut, P. 1981, A&A, 99, 126 [NASA ADS] [Google Scholar]
- Kenyon, S. J., & Webbink, R. F. 1984, ApJ, 279, 252 [NASA ADS] [CrossRef] [Google Scholar]
- Kniazev, A. Y. 2016, MIDAS Automatic Pipeline for HRS Data. Southern African Large Telescope [Google Scholar]
- Kniazev, A. Y., Gvaramadze, V. V., & Berdnikov, L. N. 2017, ASP Conf. Ser., 510, 48 [Google Scholar]
- Kochanek, C. S., Shappee, B. J., Stanek, K. Z., et al. 2017, PASP, 129, 104502 [Google Scholar]
- Lenz, P., & Breger, M. 2005, Commun. Asteroseismol., 146, 5 [NASA ADS] [Google Scholar]
- Livio, M. 1998, ASP Conf. Ser., 137, 264 [NASA ADS] [Google Scholar]
- Merc, J., Mikołajewska, J., Gromadzki, M., et al. 2020, A&A, 644, A49 [NASA ADS] [CrossRef] [EDP Sciences] [Google Scholar]
- Mikołajewska, J., & Kenyon, S. J. 1992, AJ, 103, 579 [CrossRef] [Google Scholar]
- Mikołajewska, J., Acker, A., & Stenholm, B. 1997, A&A, 327, 191 [Google Scholar]
- Mikołajewska, J., Iłkiewicz, K., Gałan, C., et al. 2021, MNRAS, 504, 2122 [CrossRef] [Google Scholar]
- Mürset, U., & Schmid, H. M. 1999, A&AS, 137, 473 [NASA ADS] [CrossRef] [EDP Sciences] [Google Scholar]
- Paczyński, B. 1971, ARA&A, 9, 183 [Google Scholar]
- Phillips, J. P. 2007, MNRAS, 376, 1120 [NASA ADS] [CrossRef] [Google Scholar]
- Pojmański, G. 1997, Acta Astron., 47, 467 [NASA ADS] [Google Scholar]
- Quiroga, C., Mikołajewska, J., Brandi, E., et al. 2002, A&A, 387, 139 [NASA ADS] [CrossRef] [EDP Sciences] [Google Scholar]
- Sanduleak, N. 1976, Publ. Warner Swasey Obs., 2, 55 [NASA ADS] [Google Scholar]
- Shappee, B. J., Prieto, J. L., Grupe, D., et al. 2014, ApJ, 788, 48 [Google Scholar]
- Schild, H., Dumm, T., Mürset, U., et al. 2001, A&A, 366, 972 [NASA ADS] [CrossRef] [EDP Sciences] [Google Scholar]
- Schlafly, E. F., & Finkbeiner, D. P. 2011, ApJ, 737, 103 [Google Scholar]
- Shafter, A. W. 1983, ApJ, 267, 222 [NASA ADS] [CrossRef] [Google Scholar]
- Skopal, A., Pribulla, T., Budaj, J., et al. 2009, ApJ, 690, 1222 [NASA ADS] [CrossRef] [Google Scholar]
- Solf, J. 1987, A&A, 180, 207 [NASA ADS] [Google Scholar]
- Tomov, T., Zamanov, R., Gałan, C., & Pietrukowicz, P. 2017, Anal. Chim. Acta, 67, 225 [Google Scholar]
- Van Winckel, H., Duerbeck, H. W., & Schwarz, H. E. 1993, A&AS, 102, 401 [NASA ADS] [Google Scholar]
- Zamanov, R. K., Bode, M. F., Melo, C. H. F., et al. 2008, MNRAS, 390, 377 [NASA ADS] [CrossRef] [Google Scholar]
- Zamanov, R. K., Marchev, V. D., & Stoyanov, K. A. 2021, Bulg. Astron. J., 34, 3 [NASA ADS] [Google Scholar]
Appendix A: Supplementary tables and figures
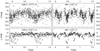 |
Fig. A.1. V (Top) and I (Bottom) light curves folded with the shorter (Left) and the longer (Right) periods, respectively, with the adopted ephemerides given at the top of each plot. Filled and open circles correspond to the Kleinkaroo and ASAS-SN/OGLE data, respectively. |
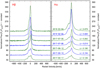 |
Fig. A.2. Evolution of the Hβ (Left) and Hα (Right) line profiles in the HRS/SALT spectra (Low-resolution mode: R ∼14000) collected during quiescence. The red dashed vertical lines mark the systemic velocity. |
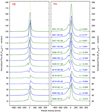 |
Fig. A.3. Evolution of the Hβ (Left) and Hα (Right) line profiles during the last outburst in the HRS/SALT spectra (medium-resolution mode: R ∼40000) and two FEROS spectra taken during the previous outburst in 2005. The red dashed vertical lines mark the systemic velocity. |
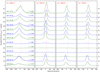 |
Fig. A.4. Evolution of the He II (λ4685.680 Å) and He I (λ5875.640 Å, λ6678.151 Å, and λ7065.190 Å) line profiles during the present outburst in the HRS/SALT spectra (medium-resolution mode: R ∼40000) and two FEROS spectra taken during the 2005 outburst. The red dashed vertical lines mark the systemic velocity. |
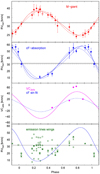 |
Fig. A.5. Radial velocity curves of the red gaint (top) and hot (middle) components folded with period Psp = 918d. SALT/HRS and FEROS data are shown with filled and open circles, respectively. Solid lines show synthetic radial velocity curves for the case of the eccentric orbit and dashed lines in the case of a circular orbit. The horizontal lines represent the systemic velocities for the eccentric (solid) and circular (dashed) cases. The lower middle panel shows the jet centre velocity VCJ. The bottom panel presents the radial velocities of the emission line wings: Hα (circles), Hβ (diamonds), He Iλ5875.6 Å (asterisks), He IIλ5411.5 Å (triangles) and the mean value from He Iλ5875.6 Å, and λ7065.2 Å lines (squares), respectively, compared to the radial velocity curve of the hot component (blue line). The method described by Shafter (1983) and references therein were used to measure the velocities of emission lines wings. |
Blue cF-type absorption lines (from Ca I, Sc II, Ti II, Cr II, Fe I, Fe II, Y II, and Zr II) that were identified in the high-resolution spectra collected during outbursts and used to measure the radial velocities associated with the hot component.
Emission lines identified in the HRS/SALT blue- and red-arm spectra of St 2-22.
All Tables
Heliocentric radial velocities of the red giant and the cF-absorption lines with their 1σ errors, and the maximum IP observed.
Journal of spectroscopic observations with information about time (UT, HJD, phase) and exposure times.
Radial velocities (RV) of the jets, FWHM values, and equivalent widths (EW) measured in the HRS and FEROS spectra.
Blue cF-type absorption lines (from Ca I, Sc II, Ti II, Cr II, Fe I, Fe II, Y II, and Zr II) that were identified in the high-resolution spectra collected during outbursts and used to measure the radial velocities associated with the hot component.
Emission lines identified in the HRS/SALT blue- and red-arm spectra of St 2-22.
All Figures
|
Fig. 1. Light curve of St 2-22 with the ongoing outburst. Green and brown dots correspond to the V- and Ic-band data, respectively, acquired at the Kleinkaroo Observatory, whereas the ASAS and ASAS-SN V- and g-band, as well as OGLE I-band data, are plotted as black points. The zero-point of the OGLE photometry is shifted by −0.38 mag. Arrows above the light curves mark the HRS and FEROS observations with (blue) and without (red) jet detection, while those below mark the times of periastron passage (black) and inferior conjunction (magenta) according to the eccentric orbit solution (Table 3). |
| In the text | |
|
Fig. 2. Evolution of the He II (λ4685.680 Å) and He I (λ5875.640 Å, λ6678.151 Å, and λ7065.190 Å) line profiles, and the Raman scattered O VI (λ6825 Å) line with the radial velocity scale corresponding to the parent O VI (λ1032 Å) line in the HRS/SALT spectra (low-resolution mode: R ∼ 14 000) collected during quiescence. The red dashed vertical lines mark the systemic velocity. |
| In the text | |
|
Fig. 3. Parts of blue (top), and red-arm (bottom), HRS/SALT spectra obtained close to the outburst maximum on February 15, 2019 (magenta), when the jets were first noticed on July 1, 2020 (blue), and during quiescence on February 5, 2018 (red). The laboratory wavelengths for identified emission lines are shown with green dashed lines labelled with the corresponding element. The position of the most frequent lines from singly ionised iron (Fe II) are shown with cyan dashed lines without labels for clarity. |
| In the text | |
|
Fig. 4. Average of three spectra of St 2-22 obtained during quiescence in June and July 2017, compared with the spectra from the grid BT-NextGen of the theoretical spectra (Allard et al. 2011, log g = 0.5 dex and Teff in the range 3300−3600 K). The spectrum of St 2-22 most resembles the giant’s spectrum with Teff = 3400 K. The spectrum of the atmospheric transmission is shown at the bottom in magenta; it was not subtracted from the observed spectra. It was generated with the use of the TAPAS2 service (Bertaux et al. 2014), adopting conditions similar to those during our observations in Sutherland. |
| In the text | |
|
Fig. 5. Radial velocity curves of the cool (top) and hot (bottom) components folded with the period Psp = 918d. The values measured from SALT/HRS and FEROS data are shown with filled and open circles, respectively. Lines show synthetic radial velocity curves: for the case of the eccentric orbit (solid), circular orbit (dashed), and from the solution for RVcF only (dot dashed). The corresponding horizontal lines represent the systemic velocities in these three cases. |
| In the text | |
|
Fig. 6. Evolution of Hα line profile in the high-resolution spectra (HRS and FEROS) of St 2-22 with visible emission components from collimated jets on its wings. The measured positions of their centres (Table 4) after correction on Vγ are shown with red dashed lines. |
| In the text | |
|
Fig. A.1. V (Top) and I (Bottom) light curves folded with the shorter (Left) and the longer (Right) periods, respectively, with the adopted ephemerides given at the top of each plot. Filled and open circles correspond to the Kleinkaroo and ASAS-SN/OGLE data, respectively. |
| In the text | |
|
Fig. A.2. Evolution of the Hβ (Left) and Hα (Right) line profiles in the HRS/SALT spectra (Low-resolution mode: R ∼14000) collected during quiescence. The red dashed vertical lines mark the systemic velocity. |
| In the text | |
|
Fig. A.3. Evolution of the Hβ (Left) and Hα (Right) line profiles during the last outburst in the HRS/SALT spectra (medium-resolution mode: R ∼40000) and two FEROS spectra taken during the previous outburst in 2005. The red dashed vertical lines mark the systemic velocity. |
| In the text | |
|
Fig. A.4. Evolution of the He II (λ4685.680 Å) and He I (λ5875.640 Å, λ6678.151 Å, and λ7065.190 Å) line profiles during the present outburst in the HRS/SALT spectra (medium-resolution mode: R ∼40000) and two FEROS spectra taken during the 2005 outburst. The red dashed vertical lines mark the systemic velocity. |
| In the text | |
|
Fig. A.5. Radial velocity curves of the red gaint (top) and hot (middle) components folded with period Psp = 918d. SALT/HRS and FEROS data are shown with filled and open circles, respectively. Solid lines show synthetic radial velocity curves for the case of the eccentric orbit and dashed lines in the case of a circular orbit. The horizontal lines represent the systemic velocities for the eccentric (solid) and circular (dashed) cases. The lower middle panel shows the jet centre velocity VCJ. The bottom panel presents the radial velocities of the emission line wings: Hα (circles), Hβ (diamonds), He Iλ5875.6 Å (asterisks), He IIλ5411.5 Å (triangles) and the mean value from He Iλ5875.6 Å, and λ7065.2 Å lines (squares), respectively, compared to the radial velocity curve of the hot component (blue line). The method described by Shafter (1983) and references therein were used to measure the velocities of emission lines wings. |
| In the text | |
Current usage metrics show cumulative count of Article Views (full-text article views including HTML views, PDF and ePub downloads, according to the available data) and Abstracts Views on Vision4Press platform.
Data correspond to usage on the plateform after 2015. The current usage metrics is available 48-96 hours after online publication and is updated daily on week days.
Initial download of the metrics may take a while.