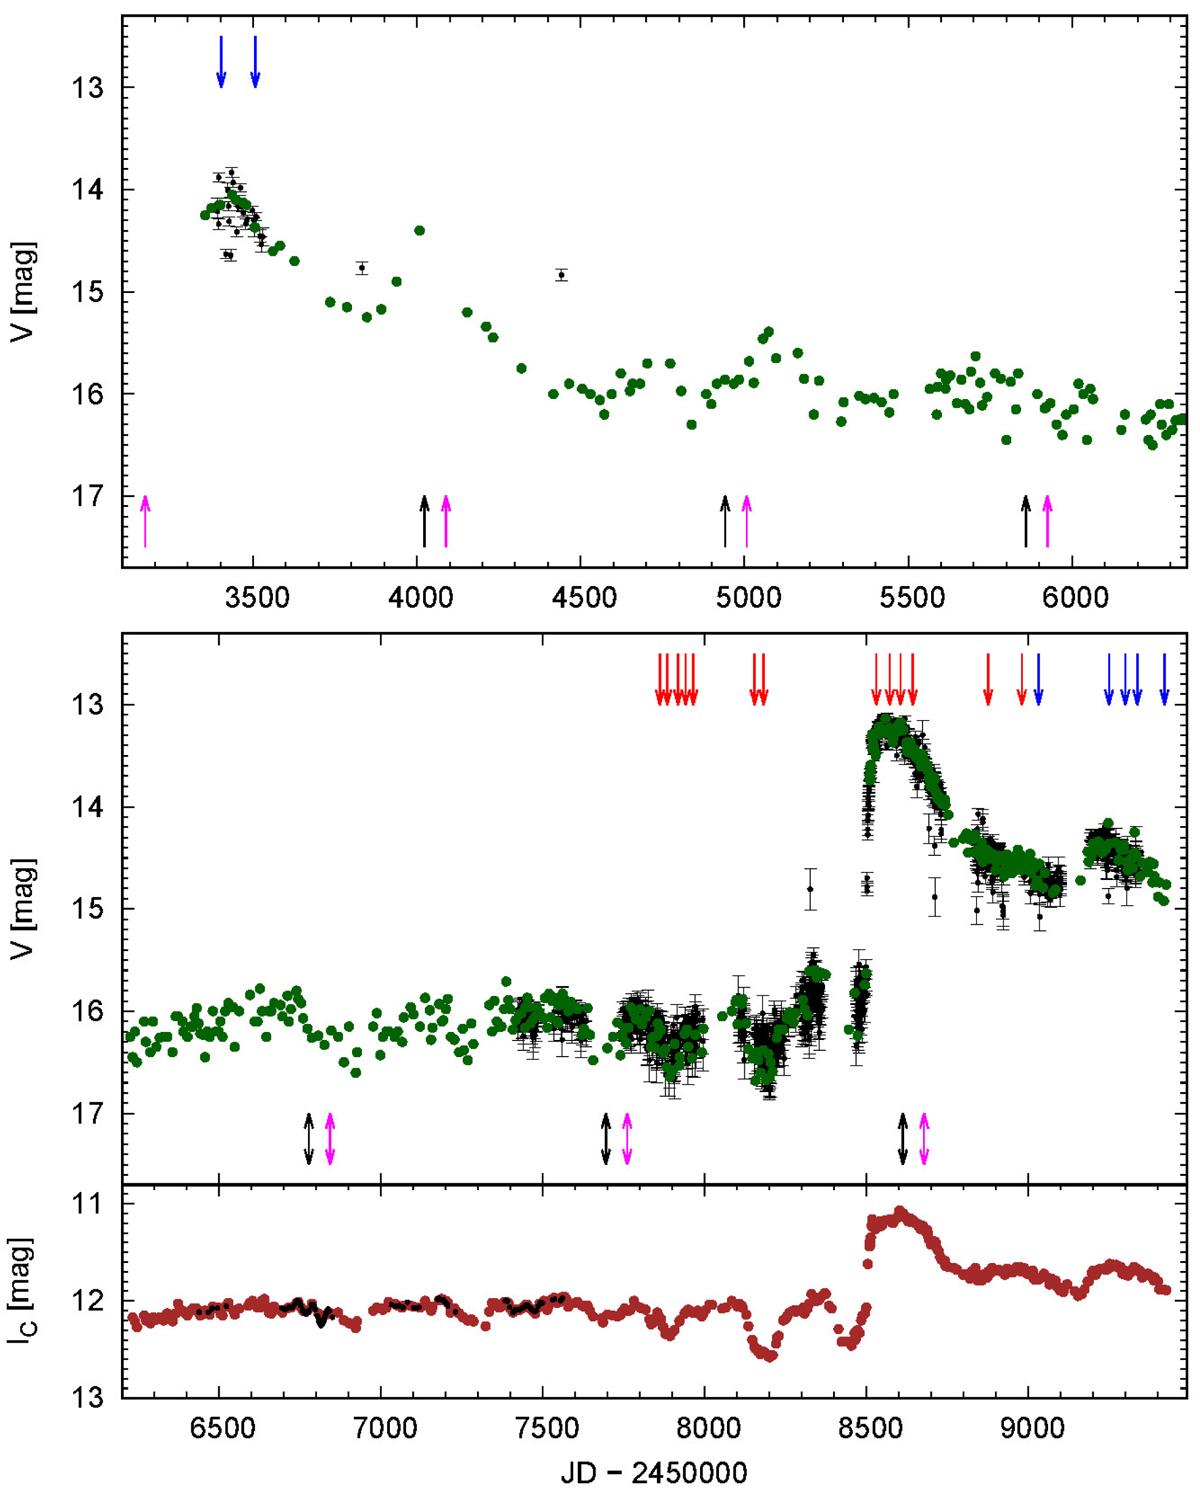
Fig. 1.
Download original image
Light curve of St 2-22 with the ongoing outburst. Green and brown dots correspond to the V- and Ic-band data, respectively, acquired at the Kleinkaroo Observatory, whereas the ASAS and ASAS-SN V- and g-band, as well as OGLE I-band data, are plotted as black points. The zero-point of the OGLE photometry is shifted by −0.38 mag. Arrows above the light curves mark the HRS and FEROS observations with (blue) and without (red) jet detection, while those below mark the times of periastron passage (black) and inferior conjunction (magenta) according to the eccentric orbit solution (Table 3).
Current usage metrics show cumulative count of Article Views (full-text article views including HTML views, PDF and ePub downloads, according to the available data) and Abstracts Views on Vision4Press platform.
Data correspond to usage on the plateform after 2015. The current usage metrics is available 48-96 hours after online publication and is updated daily on week days.
Initial download of the metrics may take a while.