Fig. A.5.
Download original image
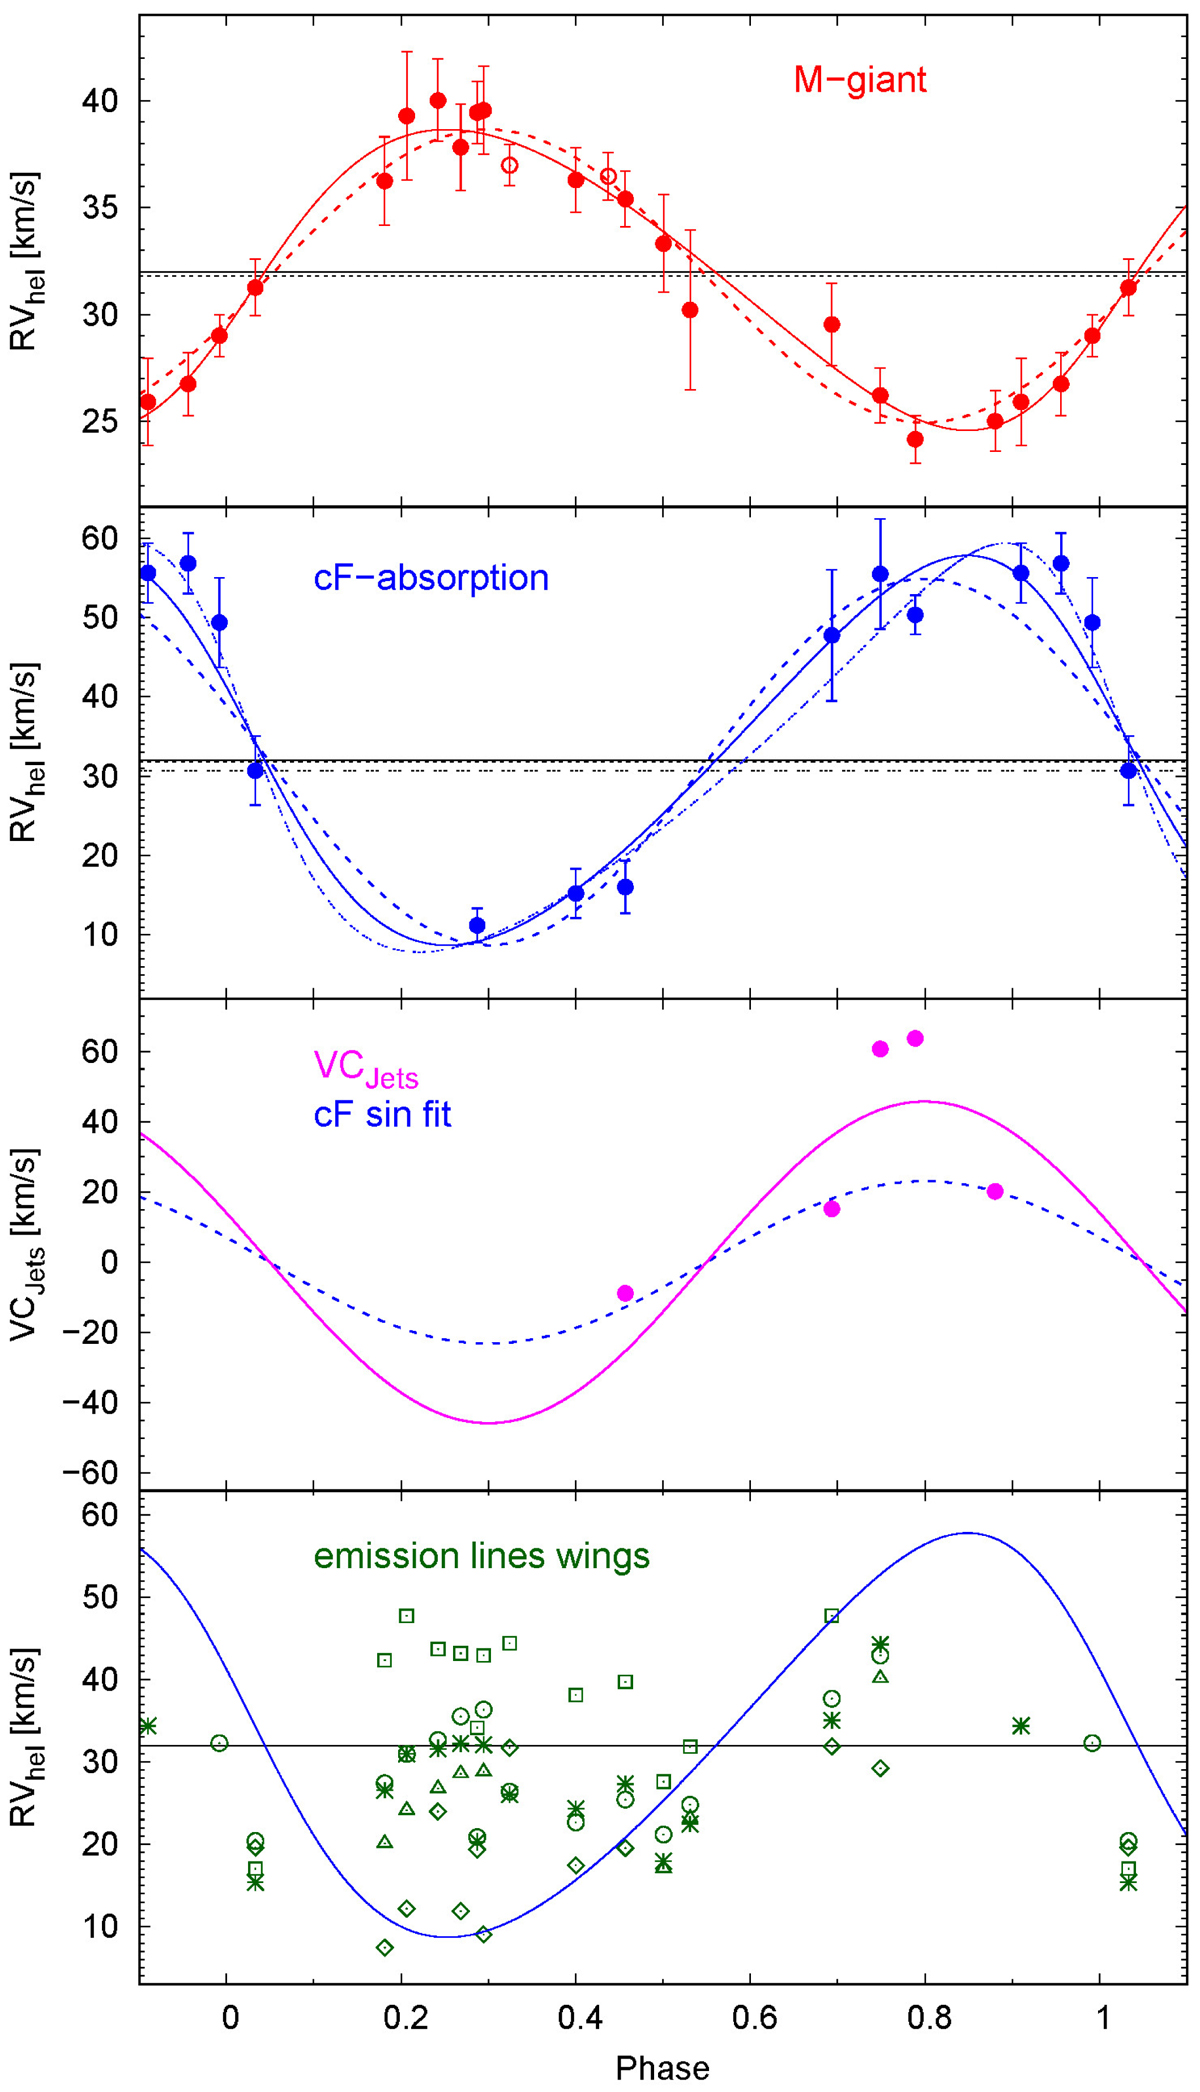
Radial velocity curves of the red gaint (top) and hot (middle) components folded with period Psp = 918d. SALT/HRS and FEROS data are shown with filled and open circles, respectively. Solid lines show synthetic radial velocity curves for the case of the eccentric orbit and dashed lines in the case of a circular orbit. The horizontal lines represent the systemic velocities for the eccentric (solid) and circular (dashed) cases. The lower middle panel shows the jet centre velocity VCJ. The bottom panel presents the radial velocities of the emission line wings: Hα (circles), Hβ (diamonds), He Iλ5875.6 Å (asterisks), He IIλ5411.5 Å (triangles) and the mean value from He Iλ5875.6 Å, and λ7065.2 Å lines (squares), respectively, compared to the radial velocity curve of the hot component (blue line). The method described by Shafter (1983) and references therein were used to measure the velocities of emission lines wings.
Current usage metrics show cumulative count of Article Views (full-text article views including HTML views, PDF and ePub downloads, according to the available data) and Abstracts Views on Vision4Press platform.
Data correspond to usage on the plateform after 2015. The current usage metrics is available 48-96 hours after online publication and is updated daily on week days.
Initial download of the metrics may take a while.