Free Access
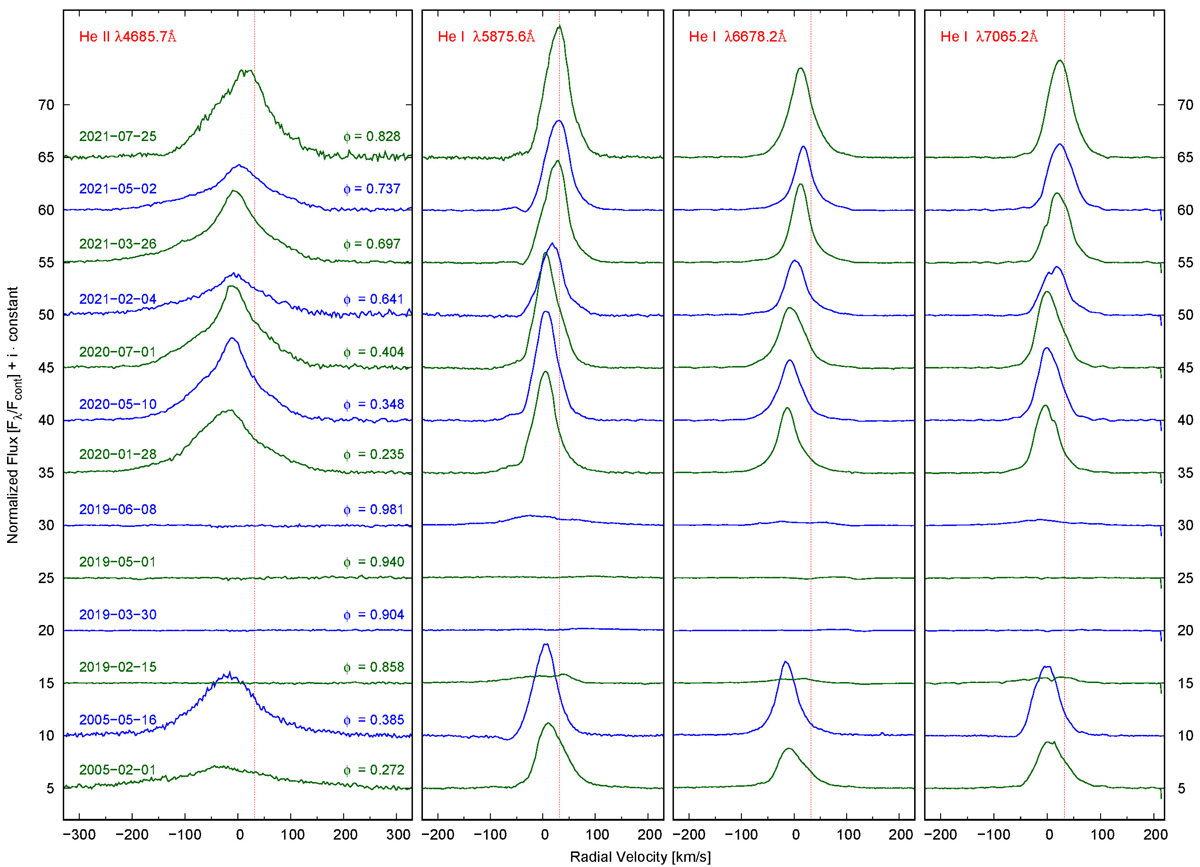
Fig. A.4.
Download original image
Evolution of the He II (λ4685.680 Å) and He I (λ5875.640 Å, λ6678.151 Å, and λ7065.190 Å) line profiles during the present outburst in the HRS/SALT spectra (medium-resolution mode: R ∼40000) and two FEROS spectra taken during the 2005 outburst. The red dashed vertical lines mark the systemic velocity.
Current usage metrics show cumulative count of Article Views (full-text article views including HTML views, PDF and ePub downloads, according to the available data) and Abstracts Views on Vision4Press platform.
Data correspond to usage on the plateform after 2015. The current usage metrics is available 48-96 hours after online publication and is updated daily on week days.
Initial download of the metrics may take a while.