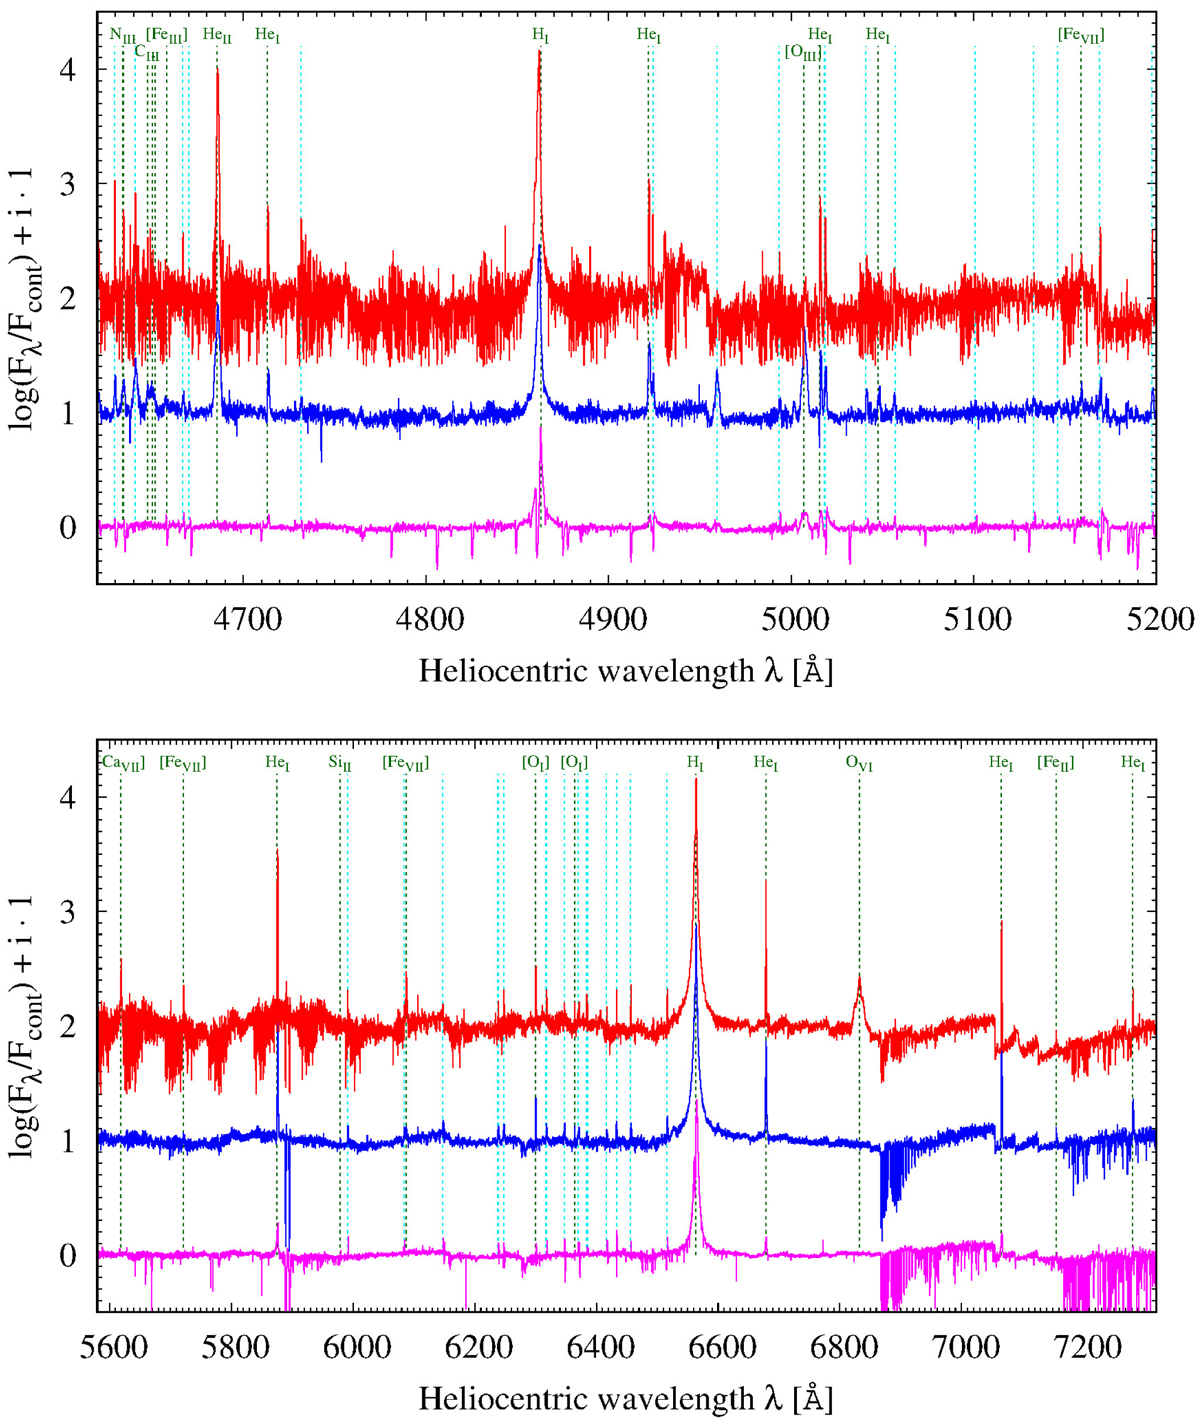
Fig. 3.
Download original image
Parts of blue (top), and red-arm (bottom), HRS/SALT spectra obtained close to the outburst maximum on February 15, 2019 (magenta), when the jets were first noticed on July 1, 2020 (blue), and during quiescence on February 5, 2018 (red). The laboratory wavelengths for identified emission lines are shown with green dashed lines labelled with the corresponding element. The position of the most frequent lines from singly ionised iron (Fe II) are shown with cyan dashed lines without labels for clarity.
Current usage metrics show cumulative count of Article Views (full-text article views including HTML views, PDF and ePub downloads, according to the available data) and Abstracts Views on Vision4Press platform.
Data correspond to usage on the plateform after 2015. The current usage metrics is available 48-96 hours after online publication and is updated daily on week days.
Initial download of the metrics may take a while.