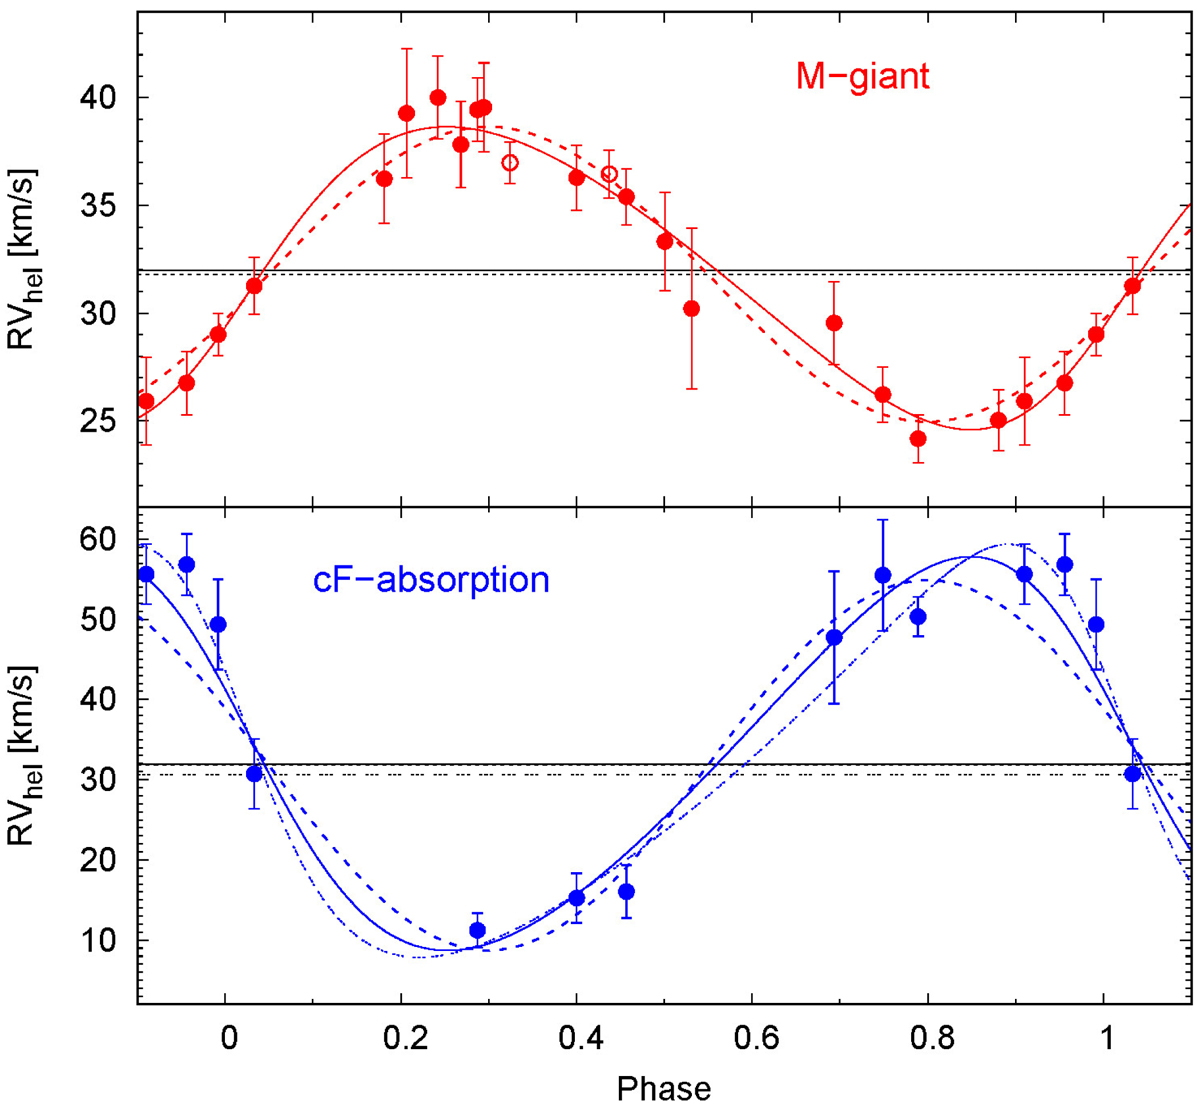
Fig. 5.
Download original image
Radial velocity curves of the cool (top) and hot (bottom) components folded with the period Psp = 918d. The values measured from SALT/HRS and FEROS data are shown with filled and open circles, respectively. Lines show synthetic radial velocity curves: for the case of the eccentric orbit (solid), circular orbit (dashed), and from the solution for RVcF only (dot dashed). The corresponding horizontal lines represent the systemic velocities in these three cases.
Current usage metrics show cumulative count of Article Views (full-text article views including HTML views, PDF and ePub downloads, according to the available data) and Abstracts Views on Vision4Press platform.
Data correspond to usage on the plateform after 2015. The current usage metrics is available 48-96 hours after online publication and is updated daily on week days.
Initial download of the metrics may take a while.