Fig. 4.
Download original image
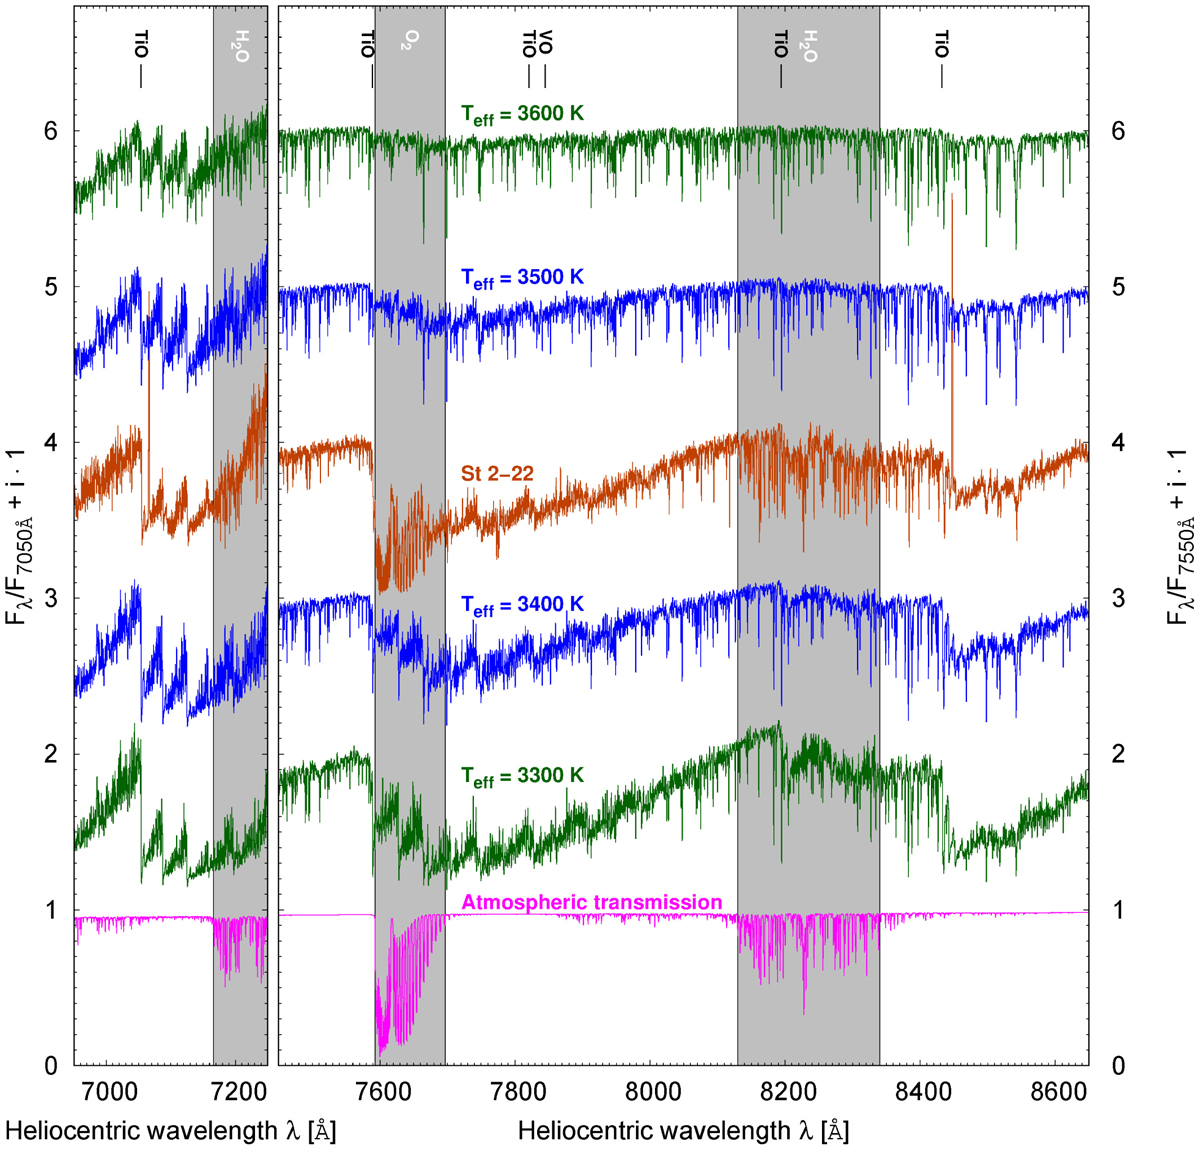
Average of three spectra of St 2-22 obtained during quiescence in June and July 2017, compared with the spectra from the grid BT-NextGen of the theoretical spectra (Allard et al. 2011, log g = 0.5 dex and Teff in the range 3300−3600 K). The spectrum of St 2-22 most resembles the giant’s spectrum with Teff = 3400 K. The spectrum of the atmospheric transmission is shown at the bottom in magenta; it was not subtracted from the observed spectra. It was generated with the use of the TAPAS2 service (Bertaux et al. 2014), adopting conditions similar to those during our observations in Sutherland.
Current usage metrics show cumulative count of Article Views (full-text article views including HTML views, PDF and ePub downloads, according to the available data) and Abstracts Views on Vision4Press platform.
Data correspond to usage on the plateform after 2015. The current usage metrics is available 48-96 hours after online publication and is updated daily on week days.
Initial download of the metrics may take a while.